 CLIFFS NATURAL RESOURCES
2012 ANALYST AND INVESTOR DAY
Exhibit 99.1 |
| CLIFFS NATURAL RESOURCES
2012 ANALYST AND INVESTOR DAY
Exhibit 99.1 |
 2012 Analyst & Investor Day
“SAFE HARBOR”
STATEMENT UNDER THE PRIVATE SECURITIES LITIGATION
REFORM ACT OF 1995
2
This presentation and accompanying oral remarks contain statements that constitute
“forward-looking statements” within the meaning of the Private Securities Litigation Reform Act of 1995. These forward-
looking statements may be identified by the use of predictive, future-tense or forward-looking
terminology, such as “believes,” “anticipates,” “expects,” “estimates,” “intends,” “may,” “will” or similar terms. These
statements speak only as of the date of this presentation and we undertake no ongoing obligation, other
than that imposed by law, to update these statements. These statements appear in a number of places
in this presentation and relate to our intent, belief or current expectations of our directors or our
officers with respect to: our future financial condition, results of operations or prospects; estimates of our
economic iron ore and coal reserves; our business and growth strategies; and our financing plans and
forecasts. You are cautioned that any such forward-looking statements are not guarantees of future
performance and involve significant risks and uncertainties, and that actual results may differ
materially from those contained in or implied by the forward-looking statements as a result of various factors, some
of which are unknown, including, without limitation:
• the ability to successfully integrate acquired companies into our operations;
• uncertainty or weaknesses in global and/or market economic conditions, including any
related impact on prices; • trends affecting our financial condition, results of operations or future prospects;
• the ability to reach agreement with our iron ore customers regarding modifications
to sales contract pricing escalation provisions to reflect a shorter-term or spot-base pricing mechanism;
• the outcome of any contractual disputes with our customers or significant energy,
material or service providers; • the outcome of any arbitration or litigation;
• changes in sales volume or mix;
• the impact of price-adjustment factors on our sales contracts;
• the ability of our customers to meet their obligations to us on a timely basis or at
all; • our actual economic ore reserves or reductions in current resource estimates;
• the success of our business and growth strategies;
• our ability to successfully identify and consummate any strategic investments;
• our ability to achieve post-acquisition synergies;
• events or circumstances that could impair or adversely impact the viability of a
mine and the carrying value of associated assets; • the results of pre-feasibility and feasibility studies in relation to projects;
• impacts of increasing governmental regulation including failure to receive or
maintain required environmental permits, approvals, modifications or other authorization of, or from, any governmental
or regulatory entity;
• adverse changes in currency values, currency exchange rates and interest rates;
• the success of our cost-savings efforts;
• our ability to maintain adequate liquidity and successfully implement our financing
plans; • our ability to maintain appropriate relations with unions and employees;
• uncertainties associated with unanticipated geological conditions, natural
disasters, weather conditions, supply and price of energy, equipment failures and other unexpected events;
• risks related to international operations;
• the potential existence of significant deficiencies or material weakness in our
internal control over financial reporting; and • the risk factors referred to or described in the “Risk Factors” section of
our documents filed with the Securities and Exchange Commission.
Reference is made to the detailed explanation of the many factors and risks that may cause such
predictive statements to turn out differently, set forth in the Company's Annual Report and Reports on Form
10-K, Form 10-Q and previous documents filed with the Securities and Exchange Commission, which
are publicly available on Cliffs Natural Resources Inc.’s website. The information contained in this
document speaks as of today and may be superseded by subsequent events.
We caution you that the foregoing list of important factors is not exclusive. In addition, in light of
these risks and uncertainties, the matters referred to in our forward-looking statements may not occur. We
undertake no obligation to publicly update or revise any forward-looking statement as a result of
new information, future events or otherwise, except as may be required by law. We also strongly urge you to not
rely on any single financial measure to evaluate our business.
|
 2012 Analyst & Investor Day
1:00pm –
1:20pm
Macro Overview and Cliffs in Canada
J. Carrabba
1:20pm –
1:50pm
Total Shareholder Return and Bloom Lake Financials
L. Brlas
1:50pm –
2:10pm
Bloom Lake Optimization and Operations
D. Blake
2:10pm –
2:35pm
Q&A and Break
2:35pm –
2:50pm
Global Exploration
C. Smith
2:50pm –
3:30pm
Building a World Class Chrome Business
B. Boor
3:30pm –
4:00pm
Closing and Q&A
J. Carrabba
TODAY’S AGENDA
3 |
 CLIFFS NATURAL RESOURCES
JOE CARRABBA |
 2012 Analyst & Investor Day
5
5
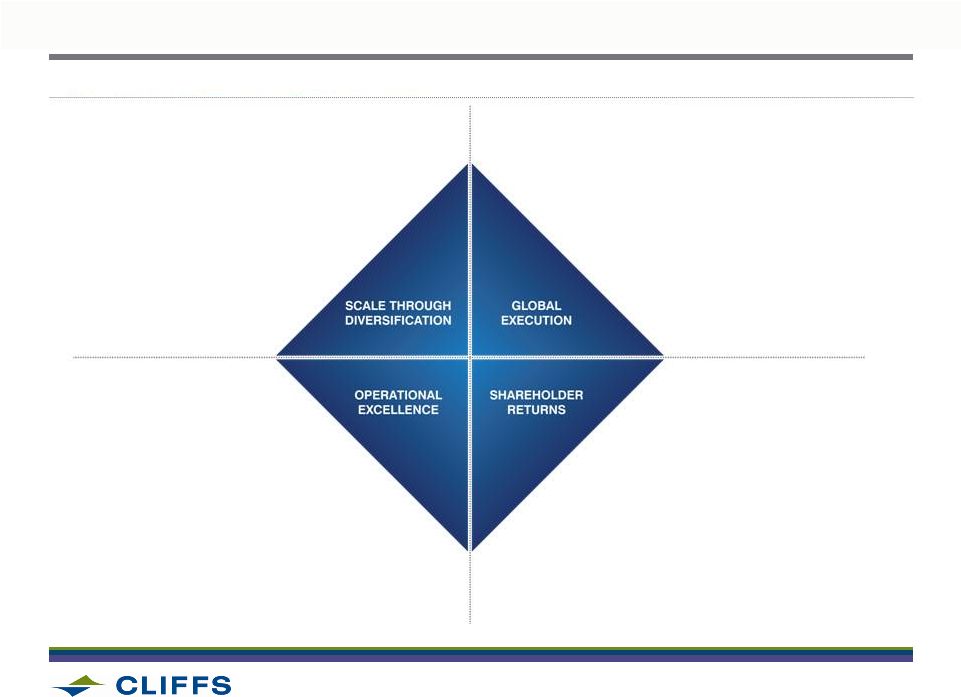
Building scale through diversification
•
Multiple Revenue Streams
•
Product Diversification
•
Geographic Presence
Operational excellence
•
Safety
•
Technical Competencies
•
Operating Efficiencies
Global execution
•
Competencies of the Firm
•
Outlook of Personnel
•
Global Scalability
Shareholder returns
•
Shareholder Value
•
Risk Management
•
“Earning the Right to Grow”
OUR STRATEGIC IMPERATIVES REMAIN THE SAME |
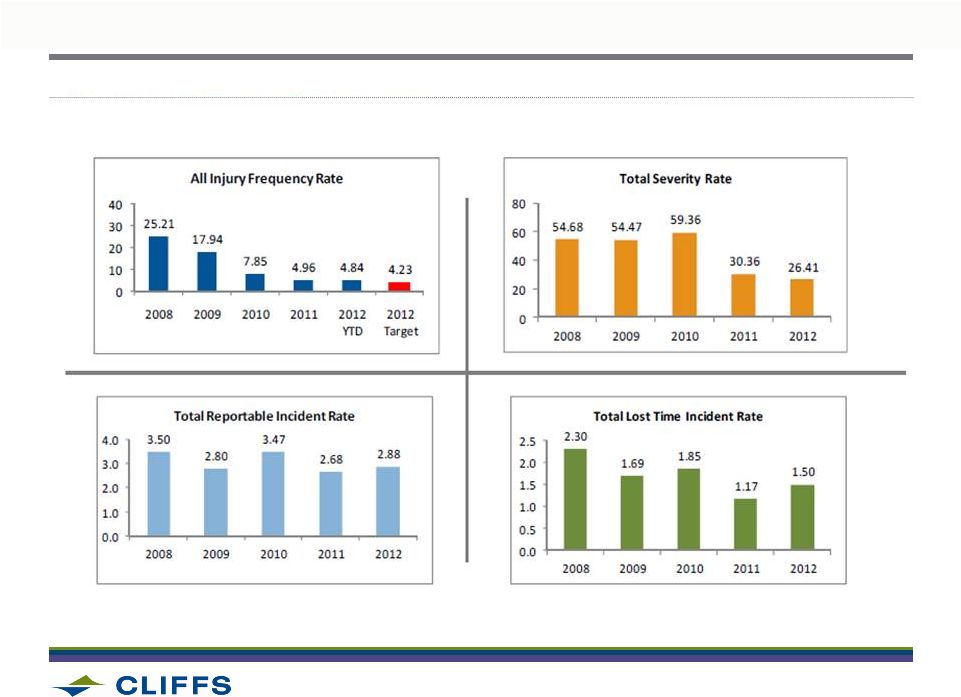 2012 Analyst & Investor Day
SAFETY
6 |
 2012 Analyst & Investor Day
CLIFFS IS A MORE MATURE, DYNAMIC AND SOPHISTICATED COMPANY IN 2012
•
International mining and natural resources company, member of
the S&P 500
•
Diverse, global footprint with major operations in the Upper Midwest and
Appalachian United States, Eastern Canada and Western Australia
•
Developing an advanced pipeline of organic growth opportunities
•
Information, Human Capital and Talent Management systems consistent
with S&P 500-level organization
•
Transitioning to more rigorous and methodical economic value-based
management
7 |
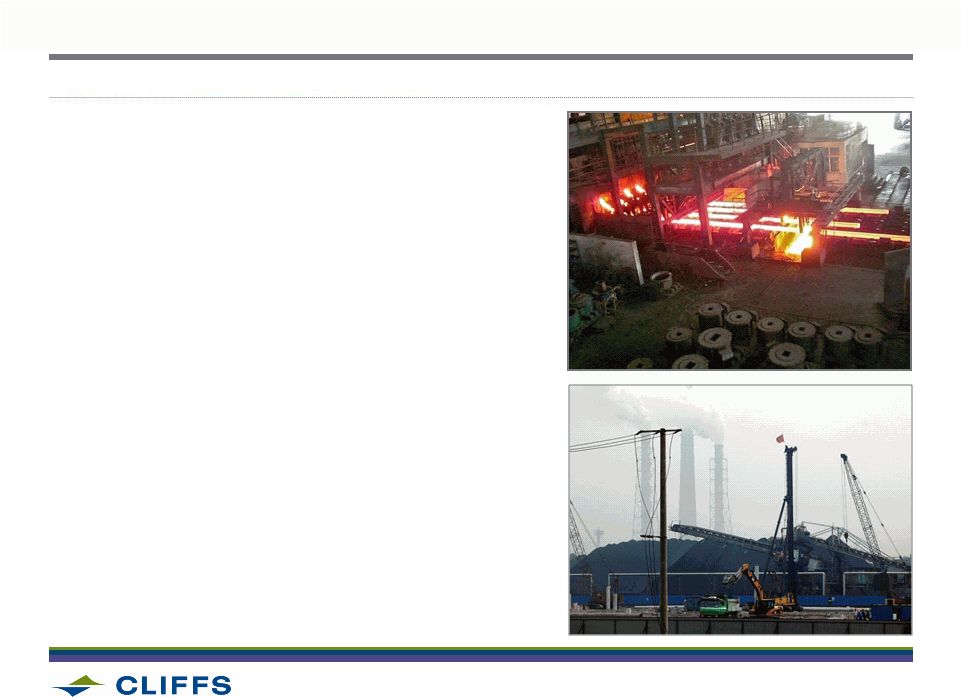
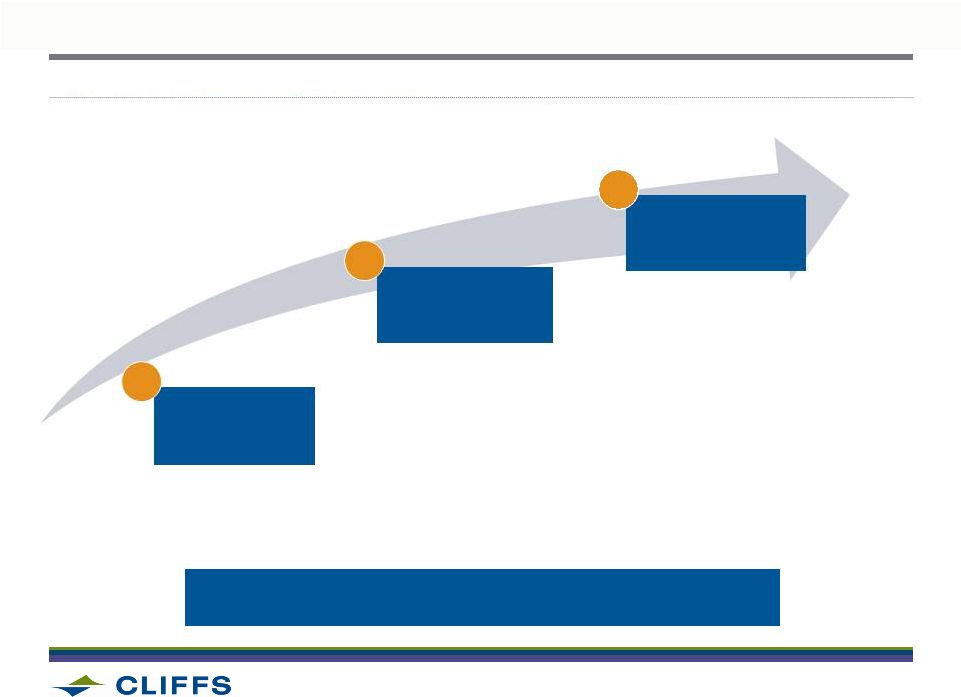
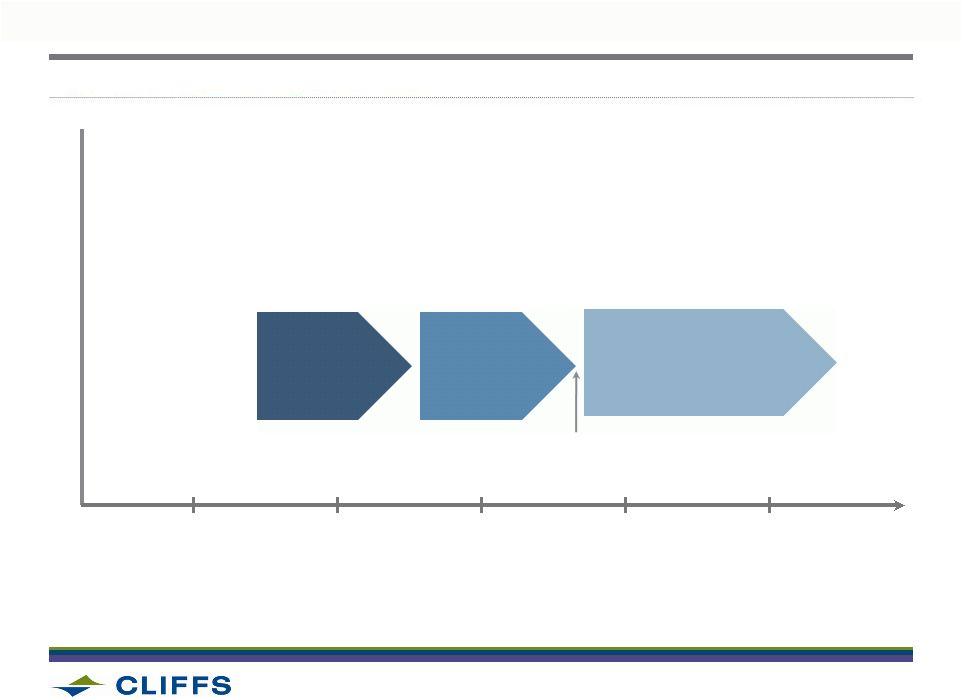
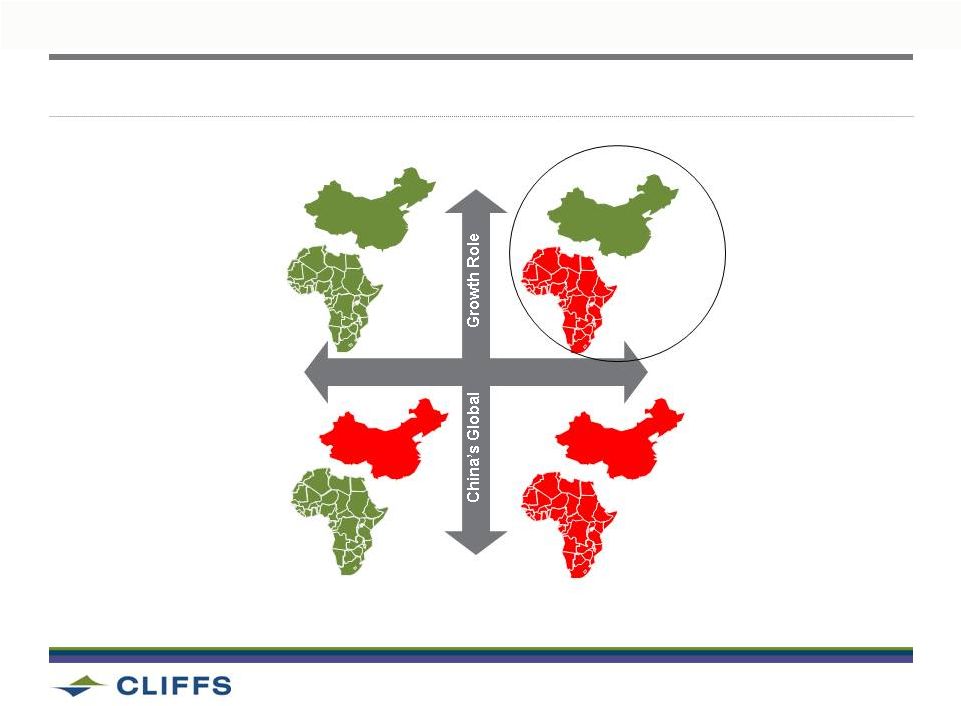 MEGATRENDS: CHINA WILL KEEP GROWING, AFRICAN SUPPLY WILL CONTINUE
TO FACE BARRIERS
INCREMENTAL CHANGE
New
Sources Of Supply
STRUCTURAL SHIFT
SMOOTH
TRANSITION
VOLATILE
EVOLUTION
8
2012 Analyst & Investor Day |
 2012 Analyst & Investor Day
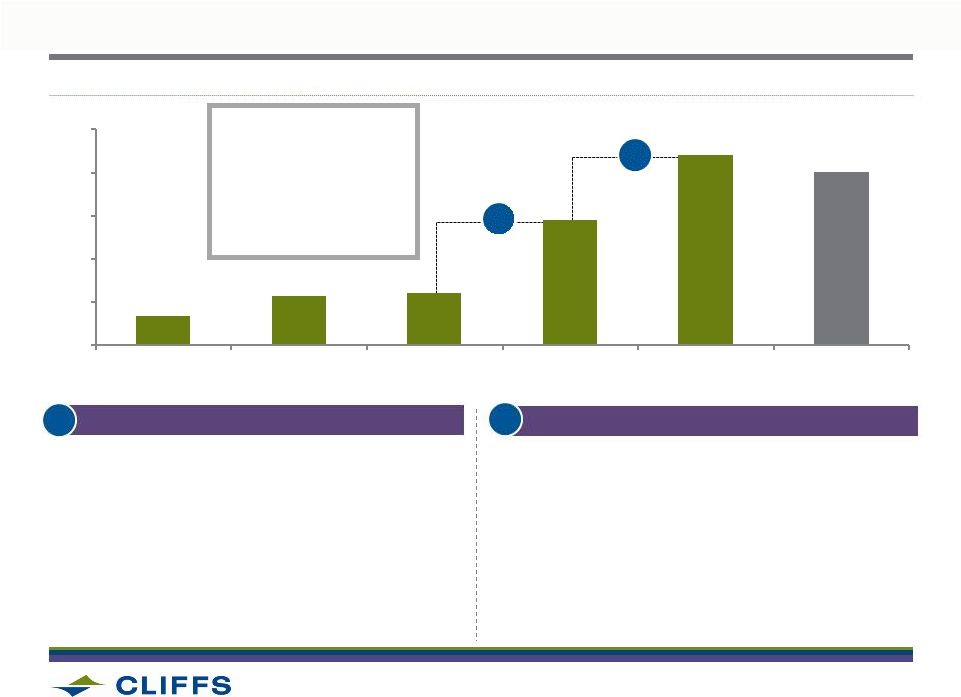
2012 CHINA CRUDE STEEL PRODUCTION GROWING BUT VOLATILE
ANNUALIZED 2012 CHINESE STEEL
PRODUCTION
BY MONTH (MILLION METRIC TONS)
JANUARY
Slow Construction Sector in China Weighs
on Steel Demand
FEBRUARY
Global Steel Production up in February
as China Switches On
MAY
Crude Steel Output Drops in May
JUNE
China’s $23 Billion Steel Push Seen
Igniting Iron Ore
SAMPLE OF CORRESPONDING MEDIA
HEADLINES
(JANUARY
–
JUNE)
Source: Cliffs, National Bureau of Statistics, Bloomberg
9
683
667
703
725
734
721
726
2011
Actual
January
February
March
April
May
June |
 2012 Analyst & Investor Day
ENVIRONMENT IN CHINA IS DYNAMIC, FULL OF CONTRADICTION
•
Fundamentals remain strong; property market
crackdown now a year old –
inflation in check
•
The People’s Bank of China reserve requirement
and interest rate cuts positioning economy for
accelerated second half growth
•
China Iron and Steel Association (CISA),
representing 80 State-owned enterprise mills,
continues to message negatively…
•
…
while 2 mills with 10 million tons of capacity
approved (Baosteel and Wuhan) in Southern China
10 |
 2012 Analyst & Investor Day
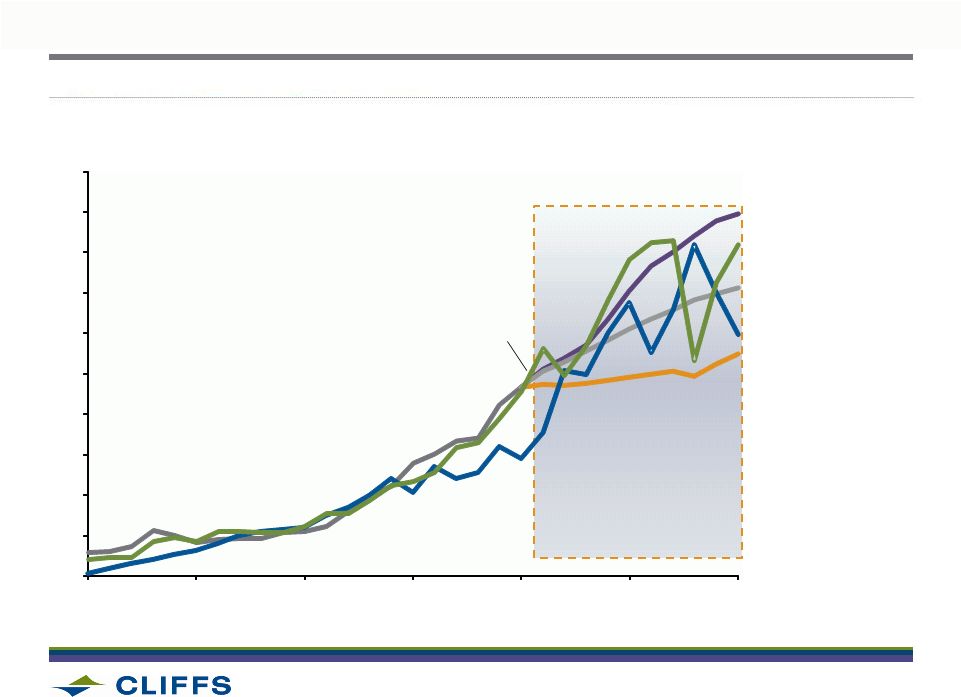
PAST INDUSTRIALIZATION PATTERNS SHOWS CHINA VOLATILITY IMMINENT
Source: The World Bank; Global Insights; National Bureau of Statistics China; ISI
Emerging Markets; Japanese Statistics Bureau Japan (1945-1985)
China –
Base Case
China –
Low Scenario
China –
High Scenario
South Korea (1970-2006)
China actual
FOCUS OF
CLIFFS’
STRATEGY
11
0
100
200
300
400
500
600
700
800
900
1,000
1990
1995
2000
2005
2010
2015
2020
STEEL
CONSUMPTION
PER
PERSON
(kg) |
 2012 Analyst & Investor Day
OVERVIEW –
GLOBAL IRON ORE SUPPLY
•
The Big 4 are committed to short-term, large scale expansions of about 500mtpa
in total •
In addition, they are close to decisions on further expansions of over 500mtpa in
total •
Miners outside of the Big 4 have matched the Big 4’s expansion rates to date,
but may struggle in the future due to capital, industry and quality
constraints •
Structural issues will make it very difficult for China to expand production
domestically •
India’s near-term impact on the global iron ore market will likely be
small •
Significant growth of West African exports is contingent upon the construction of
high- capacity deep water ports and uncertainty of capital and sovereign
risk Note:
India’s
impact
of
seaborne
market
expected
to
be
+/-
60mtpa
i.e.
a
smaller
impact
than
a
single
major
project
for
any
one
of
the
‘Big
4’
12 |
 2012 Analyst & Investor Day
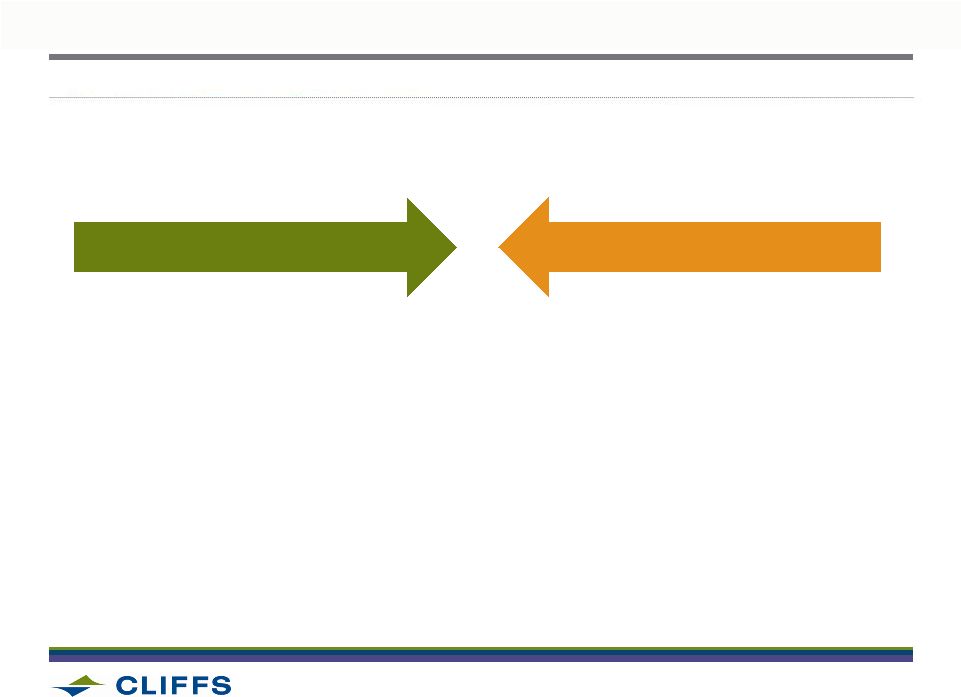
OPPOSING FORCES IMPACTING SUPPLY EXPANSIONS
FORCES SUPPORTING
SUPPLY RESPONSE
•
Window of high prices encourages
accelerated expansions and
new entrants
FORCES HINDERING
SUPPLY RESPONSE
•
Government approvals more stringent
and more time intensive
•
Investors and boards pressure to return
capital as cycle wanes
•
Operations are becoming increasingly
complex, and necessary logistics and
skills availability is tight
•
As scale increases, capacity
replenishment increasingly difficult
13 |
 2012 Analyst & Investor Day
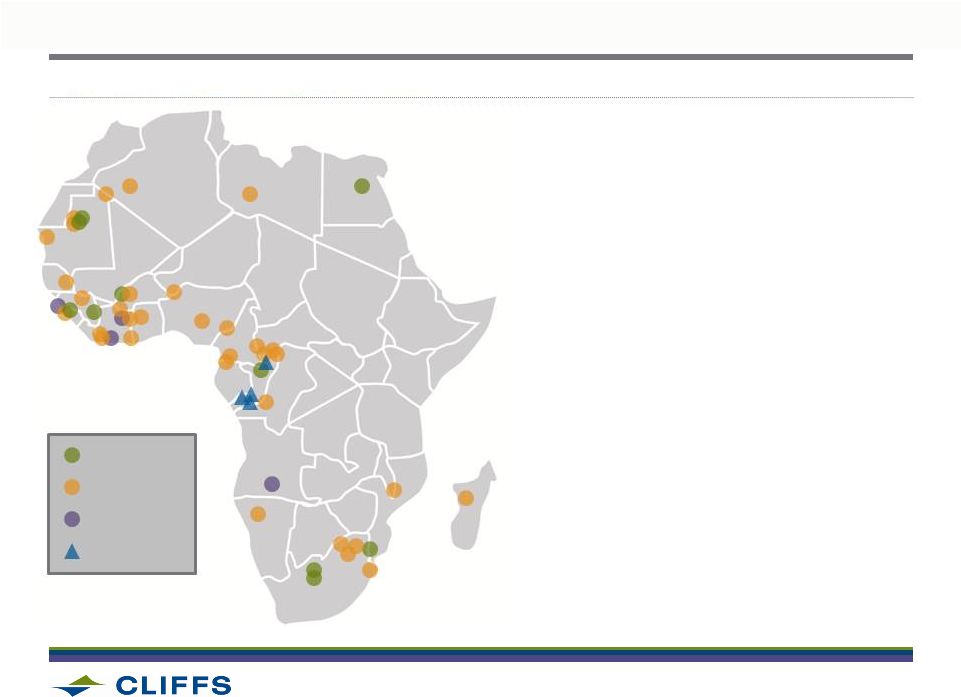
MONITORING MINING DEVELOPMENTS IN AFRICA
Source:
Global
Iron
Ore
-
Intierra,
AME
Iron
Ore
Outlook
•
Many deposits and prospects but little
meaningful supply online
•
Lack of deep water ports, rail or required
stability of political environments
•
Most likely project, Simandou, would have
first production in 2015
•
In 2011, Africa only produced about
80 million tons of iron ore
14
Active Mine
Deposit
Project
Closed Mine |
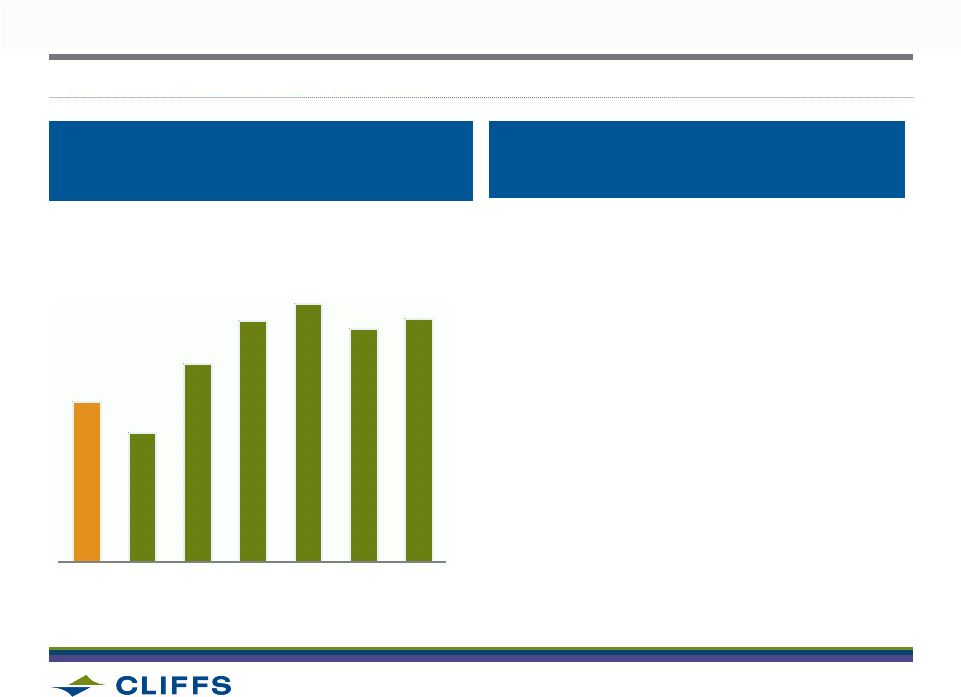
 2012 Analyst & Investor Day
Other 3%
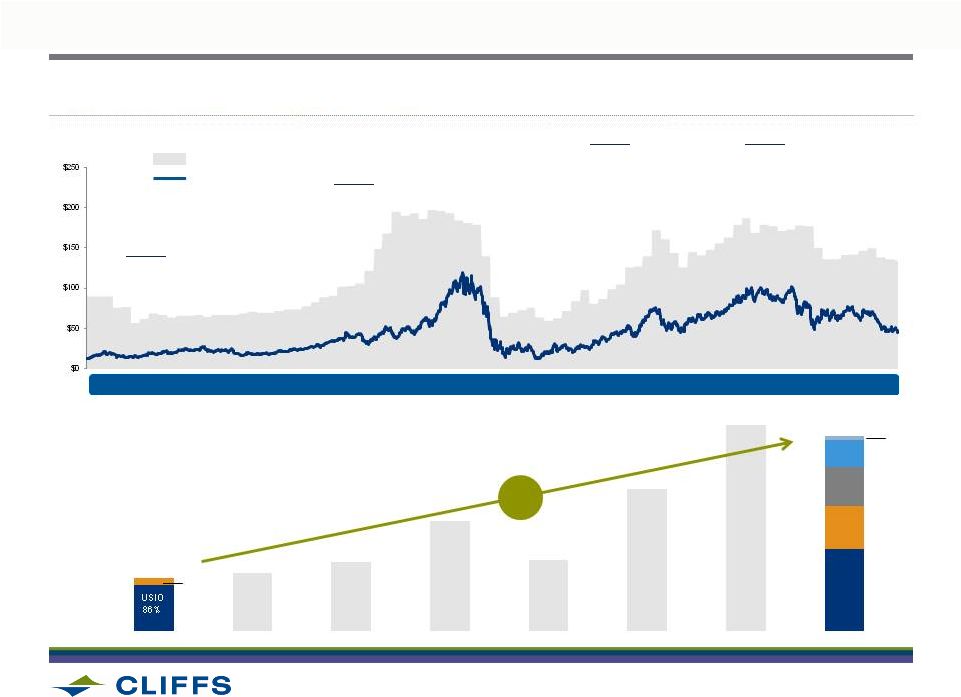
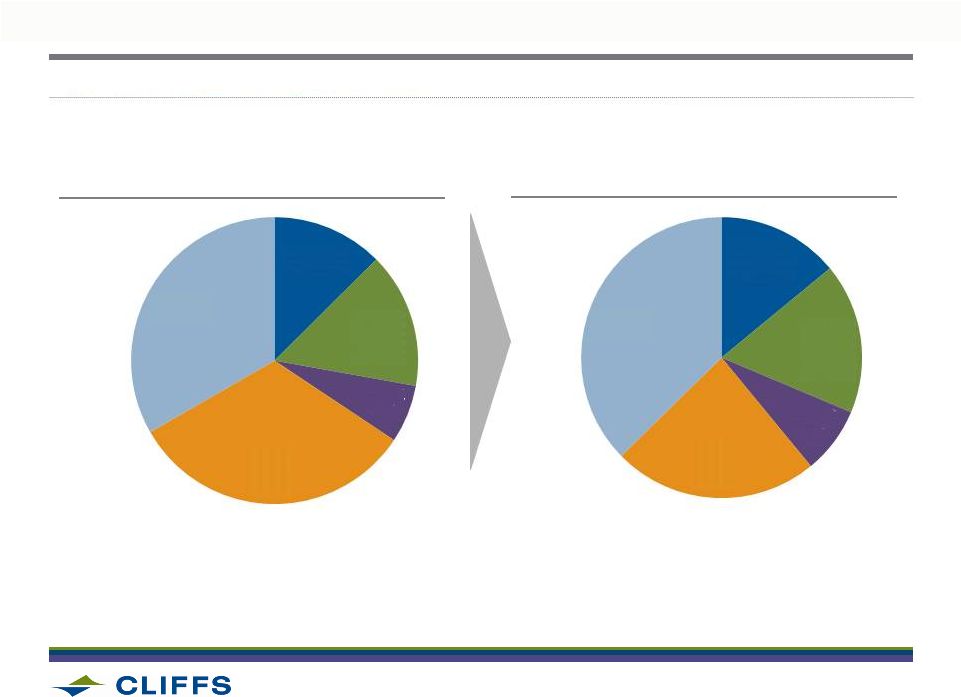
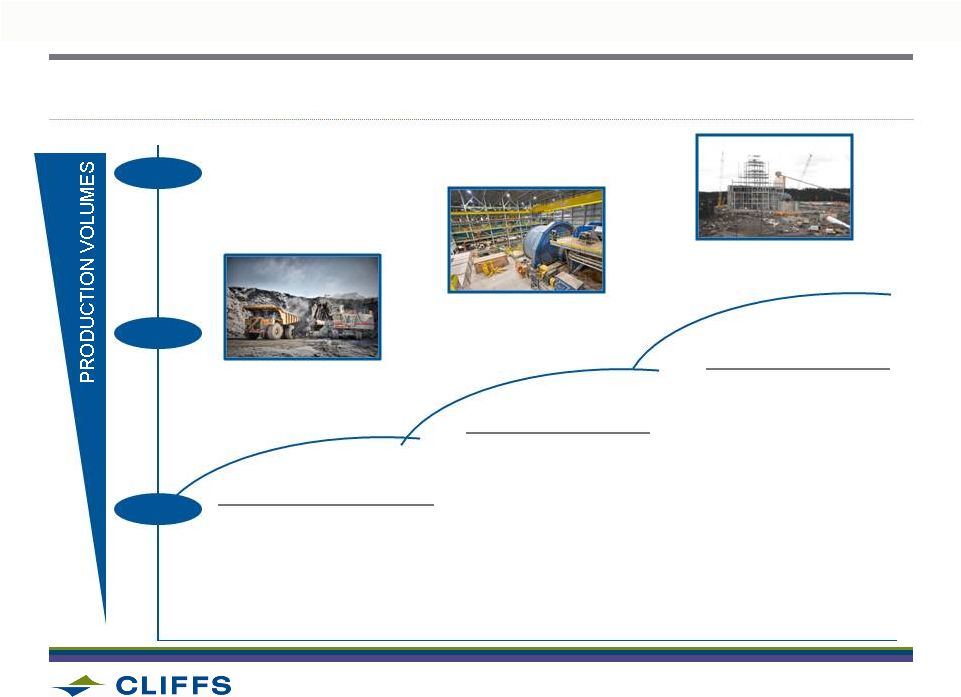
SINCE 2005 WE HAVE MAINTAINED OUR LONG-TERM STRATEGY THROUGH TIMES
OF PRICING VOLATILITY AND UNCERTAINTY
APIO
14%
USIO
42%
APIO
21%
ECIO
20%
$1.7B
$6.4B
SALES
2005
2007
2010
2011
PRICE
2005
2012F
21%
CAGR
Iron Ore Price
Share Price
NAC
14%
1
Share Price and Iron Ore Price data provided up until July 15, 2012
15
•
Acquired 80% of
Portman Limited
•
Entered low-volatile
met coal market
•
Acquired world-class
chromite assets in
Ontario, Canada
•
Acquired INR Energy,
high-volatile met and
thermal coal
•
Acquired Bloom Lake mine, an
emerging world-class iron ore
operation in Eastern Canada
1 |
 2012 Analyst & Investor Day
16
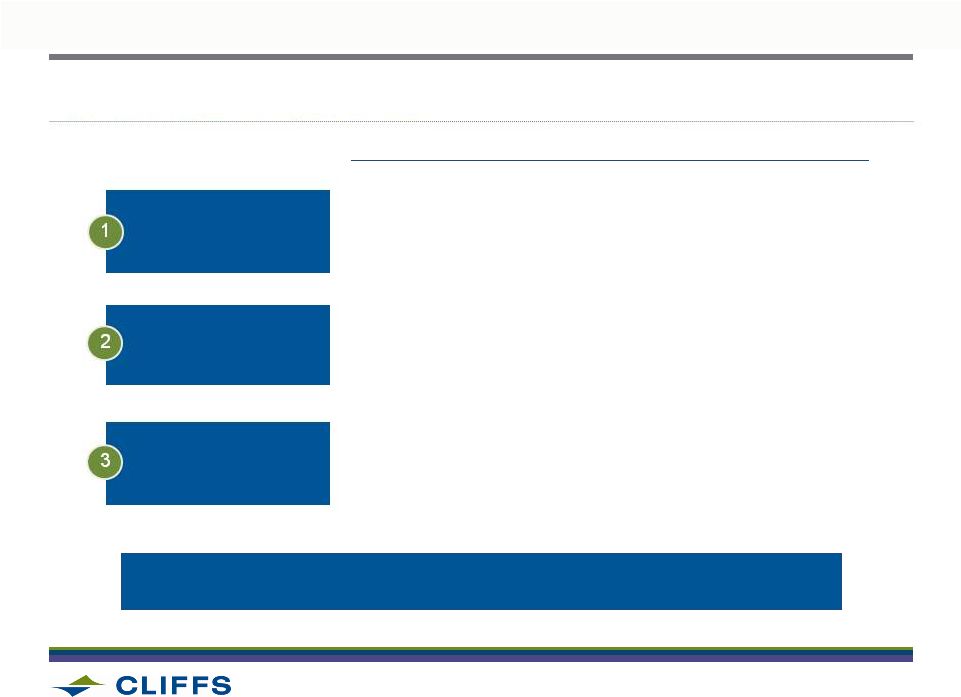
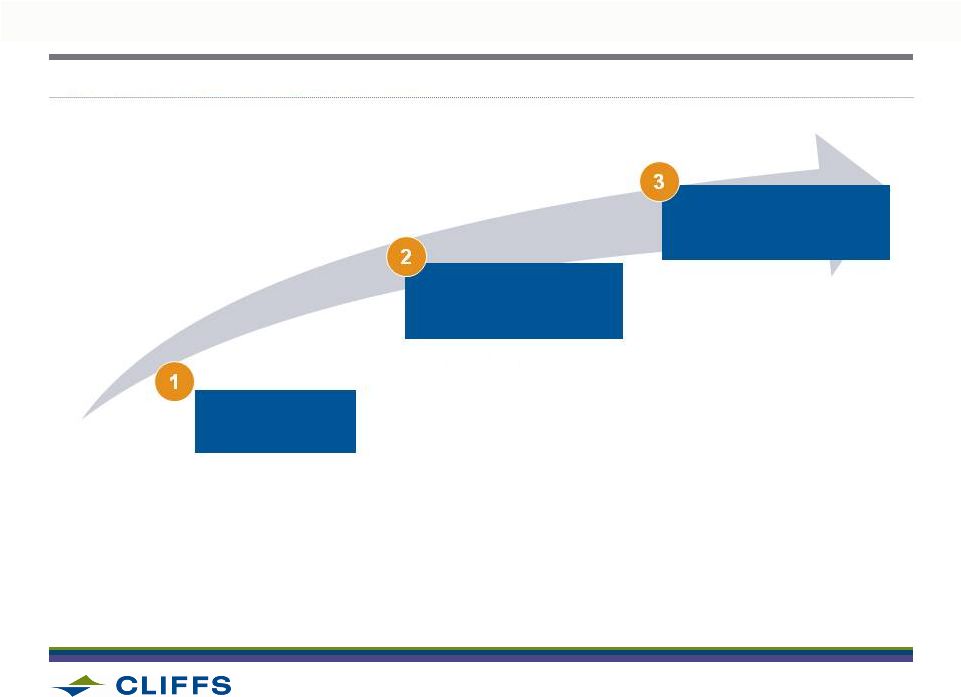
DEPLOY CLIFFS WIDE
2
ENGAGE TSR AS
MANAGEMENT TOOL
1
INTEGRATE TSR INTO
CONTROL SYSTEMS
3
DESCRIPTION
ADOPTION OF TSR WILL ENHANCE THE ABILITY TO OPTIMALLY
MANAGE TRADE OFFS AND MAXIMIZE SHAREHOLDER VALUE
•
Align goals with top-quartile relative TSR against our peers
•
Ensure discipline and prioritization in all processes, from
target setting to incentives
•
Launched as planning and target setting tool at corporate level
•
Roll-out training to employees
•
Link capital allocation, incentive and other systems
•
Reshaped portfolio and capital prioritization
•
Long-term incentive plan based 100% on relative TSR
16
DEVELOPING A VALUE-BASED MANAGEMENT SYSTEM TO DRIVE TOTAL
SHAREHOLDER RETURN |
 2012 Analyst & Investor Day
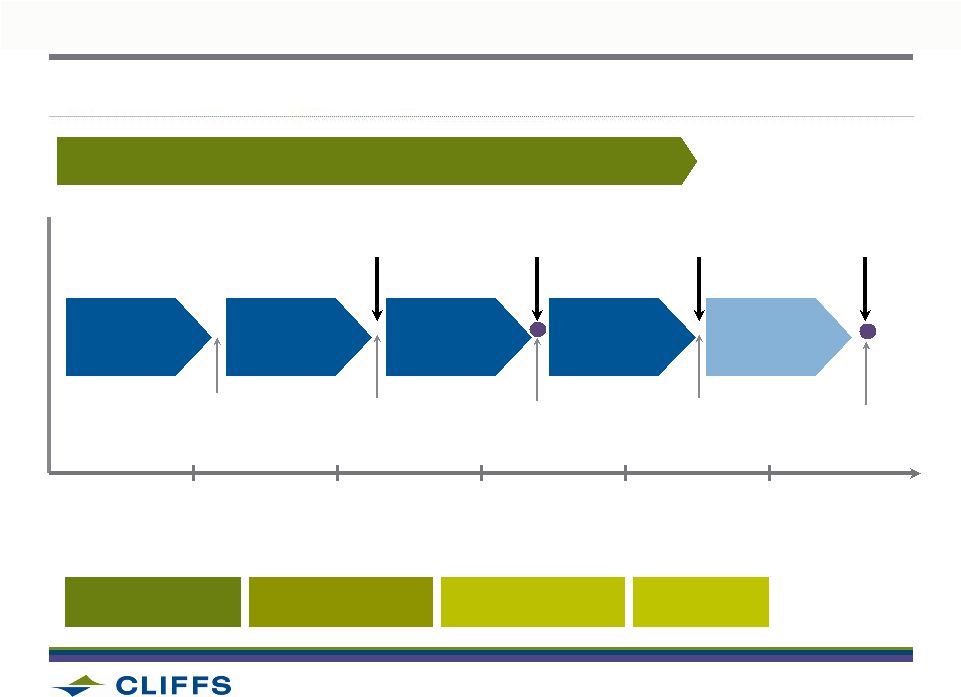
ENTIRE CAPITAL INVESTMENT SYSTEM (CIS) OCCURS WITHIN TYPICAL
APPROVAL TIMELINES
17
TYPICAL ENVIRONMENTAL PERMITTING AND APPROVALS
PROCESS…
4½
-
5 YEARS
SCOPING
STUDY
PREFEASIBILITY
STUDY (PFS)
FEASIBILITY
STUDY (FS)
EARLY
COMMITMENT
PHASE
Stage
Approval
Stage
Approval
Board
Commitment
Final
Investment
Decision
Independent Peer
Review 1
Independent Peer
Review 2
Independent Peer
Review 3
Y1
Y2
Y3
Y4
Y5
2 years post
ramp-up
Independent Peer
Review 4
TYPICAL BUDGET DISTRIBUTION ACROSS STUDIES…
GEOLOGY ~ 60%
METALLURGY ~15%
OTHER ~ 10%
ENGINEERING ~ 15%
CONSTRUCTION
PHASE |
 2012 Analyst & Investor Day
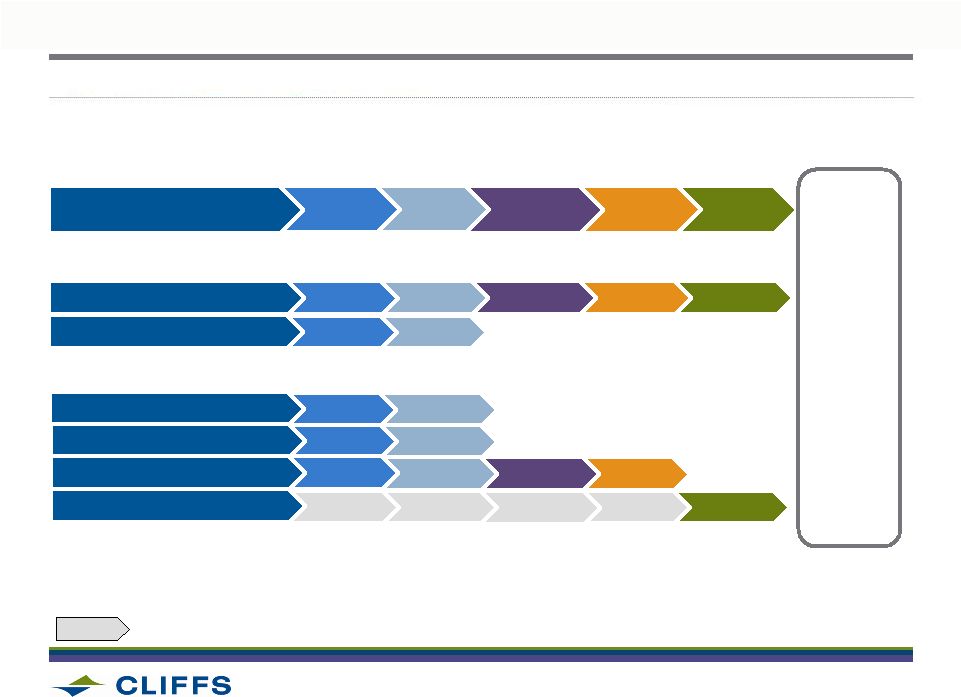
CIS PROJECTS BY STUDY PHASE
EXPECTED
NEXT IPR
Q1, 2013
Q3, 2012
Q2, 2013
IN PROGRESS
COMPLETE
CANADA
ASIA PACIFIC
CONCEPT
SCOPING
PREFEASBILITY
FEASIBILITY
EXECUTION
DECAR
BLOOM LAKE III
BLOOM LAKE II
KOOLYANOBBING EXPANSION
Indicates project did not complete all stage-gates of CIS process due to
timing of acquisition PROJECT
18
•
CIS is a deliberate and disciplined process to ensure effective deployment of
capital in a project setting.
PROJECT GUNNEL
Q4, 2012
FERROALLOYS
|
 2012 Analyst & Investor Day
SUMMARY
•
Megatrends intact and Cliffs’
strategic direction positioning company
to capitalize on Eastern Canada and Australia expansions
•
While volatile, Cliffs’
view is China continues as engine of demand
for steelmaking raw materials, incumbent producers will benefit
•
Marginal cost producers will continue providing floor for pricing
•
West African and other supply response will be delayed by capital/investor
uncertainty, cost inflation and approvals/execution delays
•
Cliffs’
strategic levers include quality products, financial flexibility
and strength of legacy operations’
market positions
19 |
 CLIFFS NATURAL RESOURCES
LAURIE BRLAS |
 2012 Analyst & Investor Day
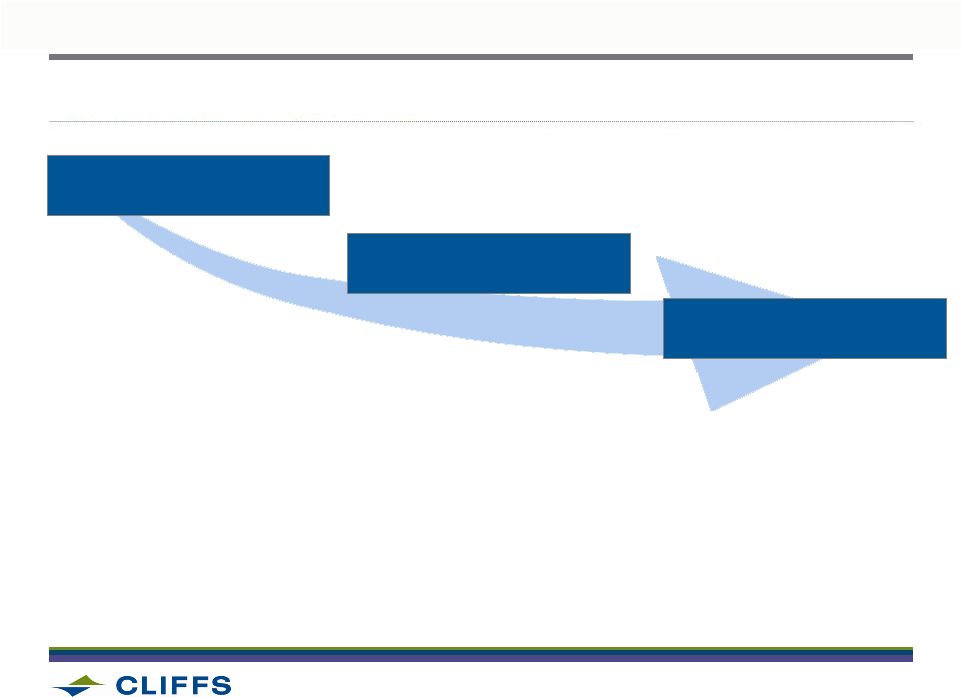
SINCE THE SECOND HALF OF 2011, WE HAVE BEEN ASSESSING HOW WE COULD
USE OUR CASH TO MAXIMIZE SHAREHOLDER VALUE
Potential Uses
Market Context
Sustainability
•
Assessed current
project pipeline
•
Analyzed drivers of relative
valuation for Cliffs vs. peers
•
Reviewed potentially available
M&A opportunities
•
Analyzed relative impact from
buybacks vs. dividends
•
Captured feedback from our
largest investors on
shareholder value creation,
strategy and capital allocation
•
Validated quantitative results
of historical multiple drivers
•
Scenario pressure-testing
•
Analyzed impact on liquidity
and TSR of various options
•
Analyzed current debt level
and paydown schedule
•
Assessed potential rating
agency responses to uses
of cash
21
from
2006
–
2011 |
 2012 Analyst & Investor Day
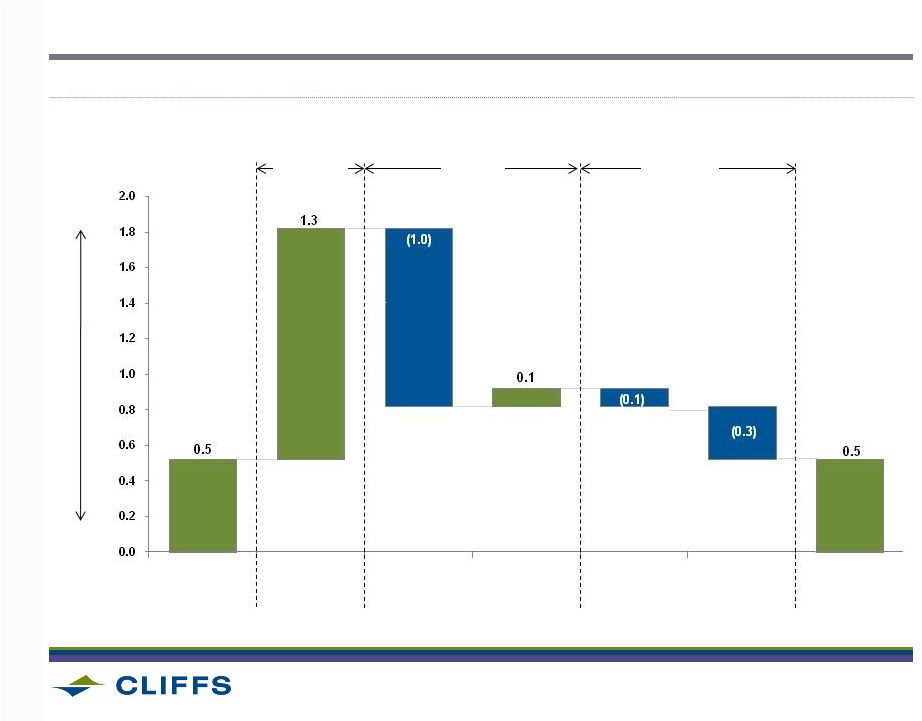
FREE CASH FLOW
22
SOURCES AND USES OF CASH IN 2012 ($B)
Dividends
Debt Issuance/
(Repayment) &
Other Financing
CAPEX
Operations
Cash on Hand
12/31/11
Expected Cash on
Hand 12/31/12
Operating
Financing
Cash
generated
Cash
consumed
1.Operating cash flow includes effect of non-cash operating activities,
including but not limited to, those related to deferred taxes, hedge contracts and equity investments.
Investing
Sonoma Sale |
 2012 Analyst & Investor Day
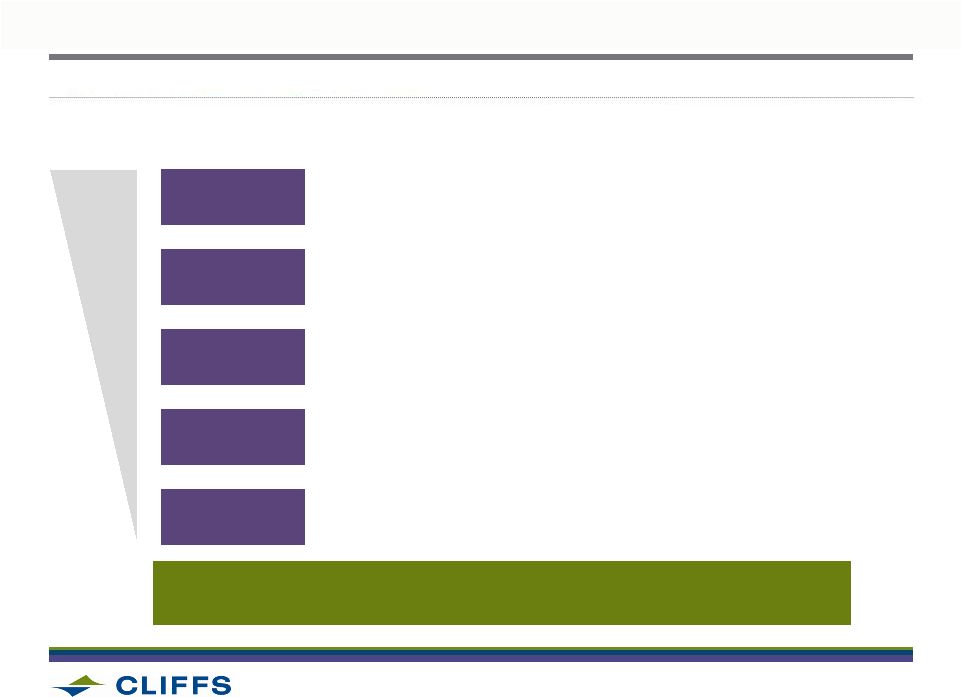
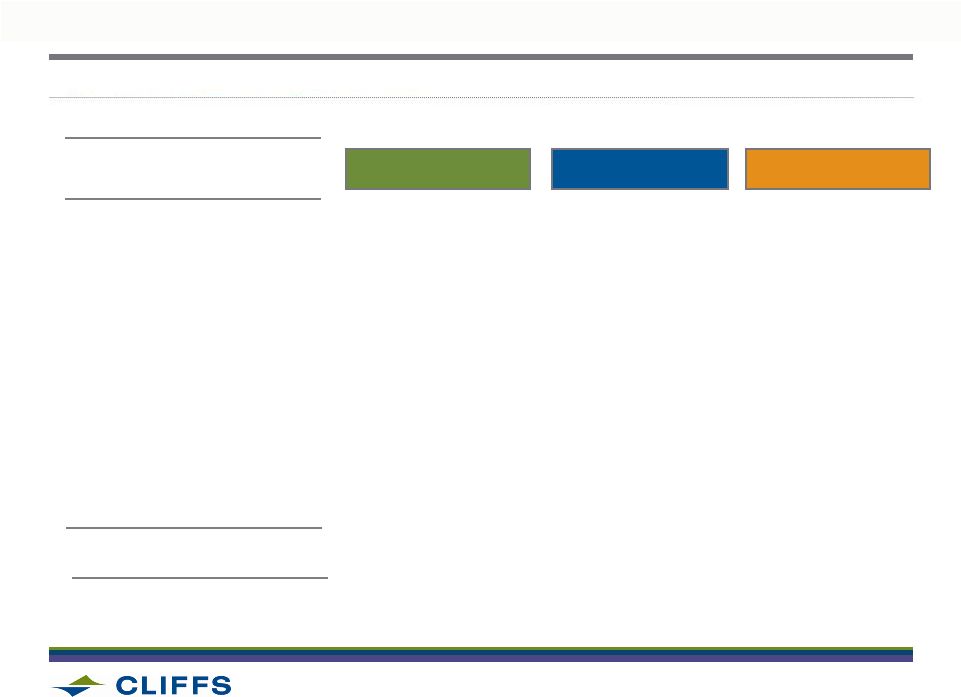
CAPITAL ALLOCATION STRATEGY PRIORITIZES ORGANIC GROWTH AND DIVIDENDS
PRIORITY
MOVING FORWARD, CAPITAL ALLOCATION TO BE DETERMINED
BY CONTRIBUTION TO TOTAL SHAREHOLDER RETURNS
ORGANIC
GROWTH
DIVIDENDS
DEBT
REDUCTION
M&A
BUYBACKS
•
Support
and
reinforce
Cliffs’
profitable
organic
growth
potential
•
Ability to fund organic growth and still have significant cash available
•
Continue significant debt reductions
•
Maintain investment-grade rating
•
Reward investors and reinforce capital allocation discipline
•
Commit to pay dividend regularly, grow it based on future performance
•
Focus on execution and organic growth pipeline
•
Select TSR-accretive M&A as conditions warrant
•
Secondary to dividends as means of returning cash to shareholders
•
Selective buybacks at attractive valuations
23 |
 2012 Analyst & Investor Day
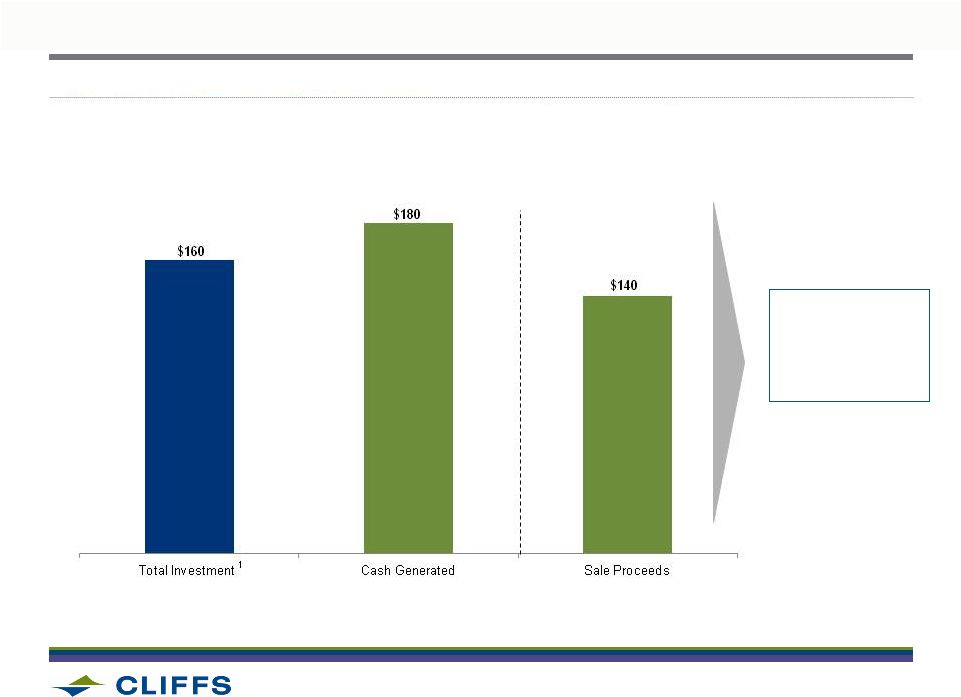
DRIVING SHAREHOLDER VALUE WITH SALE OF SONOMA
24
DRIVING SHAREHOLDER VALUE WITH SALE OF SONOMA
24
Total
Investment
IRR of 26%
SONOMA INVESTMENT (US$M)
2007 -
2012
1
Total investment includes initial investment and capital expenses
|
 2012 Analyst & Investor Day
EASTERN CANADA POSITIONED TO BECOME OUR LARGEST BUSINESS SEGMENT
PHASE
II
–
GROWTH
TO
14.5
MTPA
FUTURE GROWTH BEYOND 22 MTPA
A
B
•
Phase
I
“process
learnings”
and
incorporated
into Phase II startup
•
Overland conveyor investment
•
Mine development and tailings basin
expansion by 2012/2013
•
First-half 2013 start-up
•
Resource within current mining location
•
Currently in CIS-approved scoping phase,
prefeasibility by 2012
•
Anticipated lower spending by leveraging
existing Phase I & II infrastructure
•
Targeting 2016 production
Metric tons (m)
By 2016,
Bloom Lake will
produce more than
entire U.S. Iron Ore
with 1/3 workforce
25
3.3
5.6
6.0
14.5
22.0
20.0
0.0
5.0
10.0
15.0
20.0
25.0
2010
2011
2012F
end of 2013
Next Phase
USIO 2016
A
B |
 2012 Analyst &
Investor Day PREVIOUS MARKETING AND SALES STRATEGY FOR BLOOM LAKE CONCENTRATE
•
Wisco (steelmaker)
•
WorldLink (trader)
•
SK Group (trader)
•
Junior miner had
limited market reach
•
Lacked seaborne
end-consumer network
•
Acquired 25% of Bloom Lake, 20%
stake in Consolidated Thompson
•
Agreed to 50% off-take
agreement for Phase I
•
Annual option for up to 60%
of all future production
3
26
PRIOR TO CLIFFS’
CONTROL, MARKET STRATEGY
DRIVEN BY FINANCIAL NECESSITY
Wisco introduced
to help meet
capital needs
1
2
Initial marketing
approach to use
commodity traders
Three customers
acquired with
CT acquisition |
 2012 Analyst & Investor Day
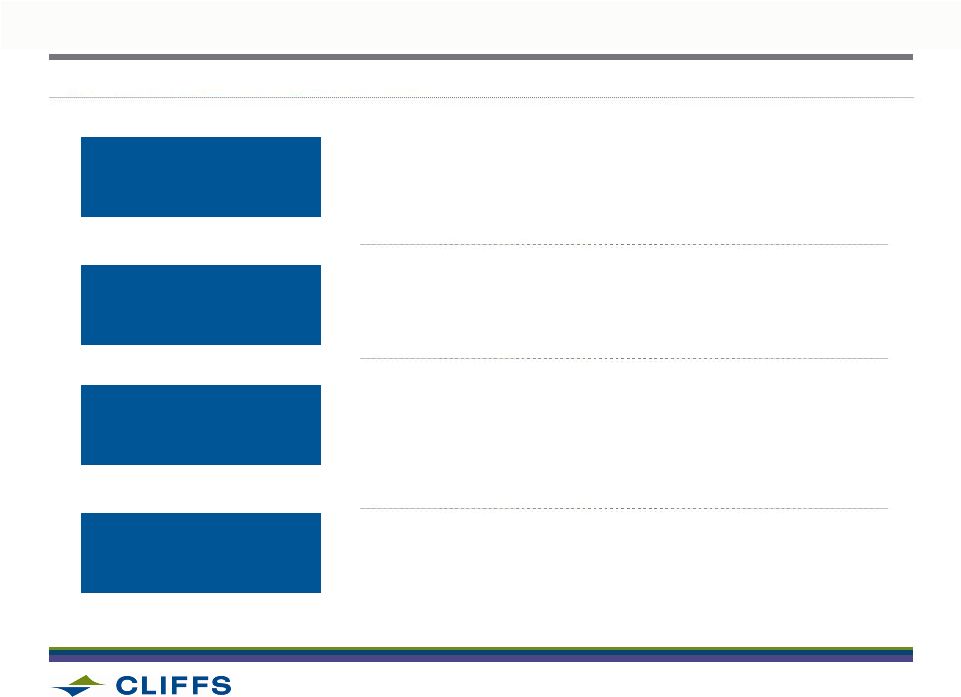
CLIFFS STRATEGY: ACHIEVE CUSTOMER AND GEOGRAPHICAL DIVERSITY
Identify ‘priority’
customers
beyond Wisco base tons
Technical evaluation of
Bloom Lake concentrates
Industrial plant trials
with priority customers
Alternative markets and
other opportunities
•
Promoting high Fe content and low impurities
•
Exploiting opportunities due to declining competitor ore grades
•
Conduct technical sinter test work
•
Collaborating with Wisco on use of Bloom Lake in sinter plants
•
Trial cargoes arranged this year, with plant data results
expected in late 2012 / early 2013
•
Customers include Nippon Steel, Posco, China Steel
and mills in Europe
•
Explore other products for Bloom Lake concentrate
•
Micro-pelletizing, cold briquetting
27 |
 2012 Analyst & Investor Day
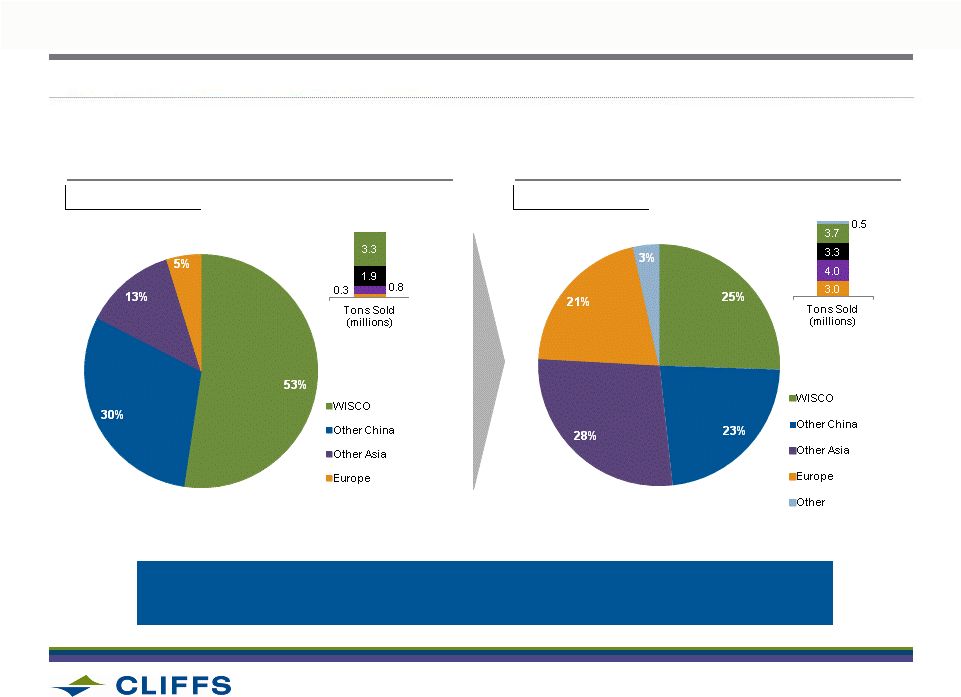
FUTURE SALES DIVERSIFICATION TARGETS
2012 CURRENT ESTIMATE
(PHASE I)
TARGETED ANNUAL SALES
(PHASE I & II)
Sales Tons by Region
Sales Tons by Region
6.3
14.5
BOTH CUSTOMER AND GEOGRAPHIC DIVERSIFICATION
ACHIEVABLE FOR BLOOM LAKE CONCENTRATE PRODUCT
28 |
 2012 Analyst & Investor Day
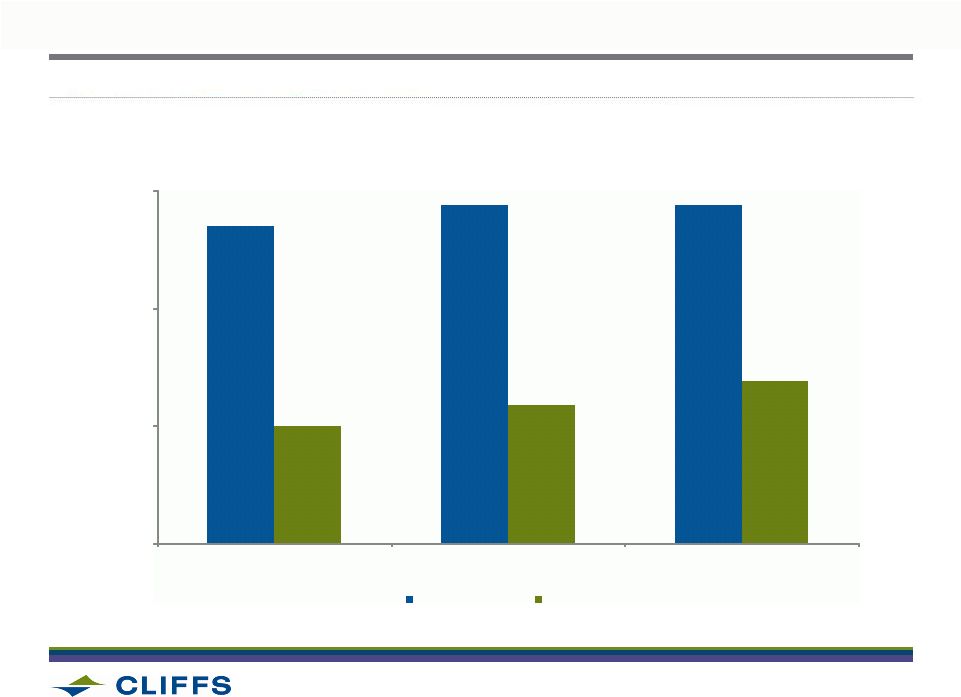
DIVERSIFICATION WILL RESULT IN HIGHER FOB PRICES AND CASH MARGINS
$ / t
Note: For FOB China sales assumes $135/ton for 66% Fe and 5.5% SiO2 with $60 cash
costs. For FOB Other Asia and FOB Europe assumes $9/ton Pricing Premium to $144/ton for
66% Fe and 4.5% SiO2 with $65 cash costs. Freight assumptions are $25/ton
into China, $20/ton into Other Asia and $10/ton into Europe. 29
$135
$144
$144
$50
$59
$69
$0
$50
$100
$150
FOB China
FOB Other Asia
FOB Europe
Revenue Rate
Cash Margin |
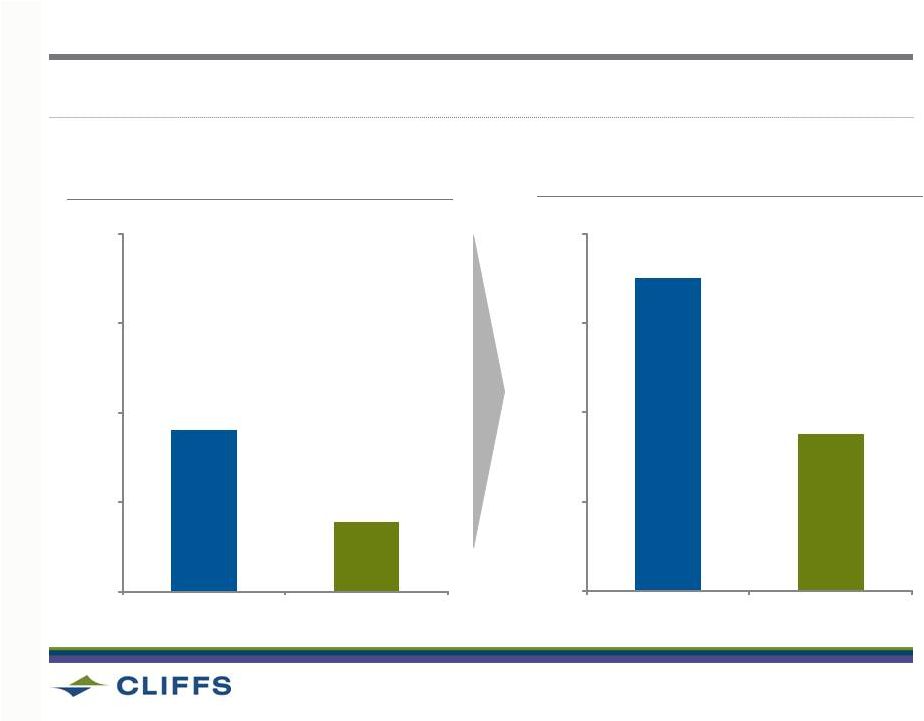 ANTICIPATED SALES MARGIN CONTRIBUTION FROM BLOOM LAKE WITH
EXECUTED MARKETING AND OPERATIONAL PLANS
(millions)
Revenue
EBITDA
PHASE
I –
7.2
MILLION
TONS
@ 4.5% SILICA
(millions)
Revenue
EBITDA
PHASE
I
&
II
–
14.5
MILLION
TONS
@ 4.5% SILICA
30
$900
$400
$0
$500
$1,000
$1,500
$2,000
$1,800
$900
$0
$500
$1,000
$1,500
$2,000
2012 Analyst & Investor Day
Note: Assumes $135/ton CIF China index price, $25/ton freight to China, $20/ton for Other Asia and
$10/ton for Asia. Also assumes $9/ton Pricing Premium for non-China sales and $62.50/ton
cash costs. |
 2012 Analyst & Investor Day
Platts 62% Fe Price:
Weighted Average Freight:
Value in Use/Fe Premium for
66% Fe Bloom Concentrate:
Cash Costs:
BLOOM LAKE HAS SIGNIFICANT EBITDA GENERATION POTENTIAL
BULL CASE
BASE CASE
BEAR CASE
EBITDA
14.5 Mpta RUN RATE
$150/ton
$20/ton
$16
$60/ton
$135/ton
$20/ton
$10
$62.5/ton
$110/ton
$20/ton
$7
$65/ton
$1.2B
$900M
$460M
31 |
 2012 Analyst & Investor Day
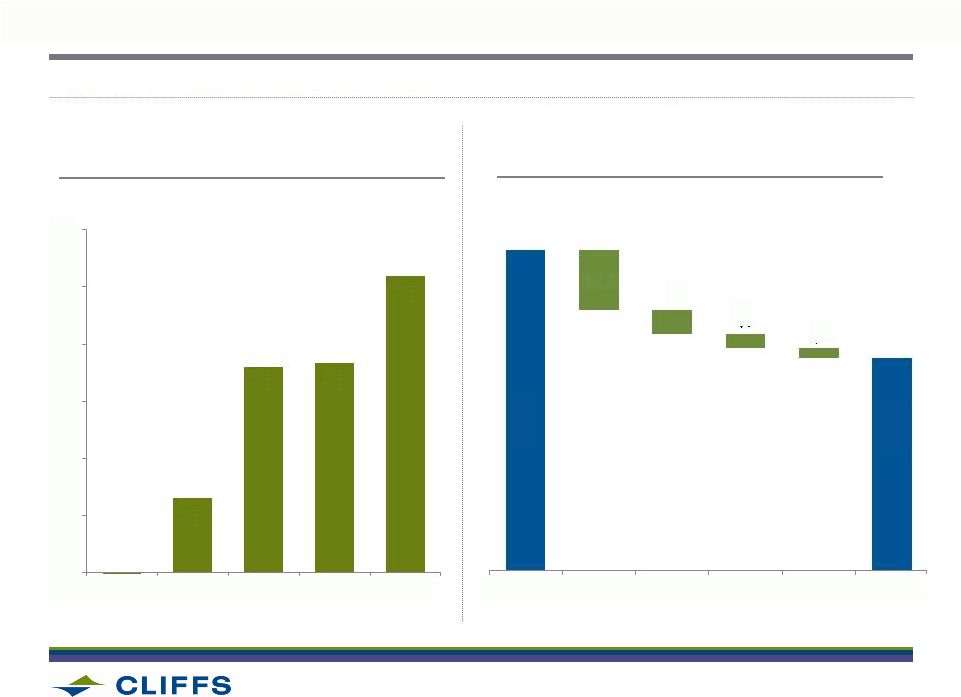
OPPORTUNITY LIES IN DELIVERING BLOOM LAKE MINE’S CASH COSTS
PRODUCTION ESCALATION TO 7.2 MT
RUN RATE BY DECEMBER, 2012
32
CASH COST PROGRESSION
3.3
5.6
5.7
7.2
2.0
3.0
4.0
5.0
6.0
7.0
8.0
2009
2010
2011
2012F
Dec
2012
$95
$63
$18
$7
$4
$3
Current Cash
Costs
Volume
Contractor
Spend
Tailings
Management
Transhipping
Estimated
Cash Cost |
 2012 Analyst & Investor Day
OPPORTUNITY LIES IN DELIVERING BLOOM LAKE MINE’S CASH COSTS (CONT.)
CURRENT
STATE -
$95/TON
LONG-TERM
ESTIMATE
-
$63/TON
33
Supplies &
Materials
14%
Labor
17%
Energy
8%
Mining
24%
Logistics
37%
Supplies &
Materials
13%
Labor
15%
Energy
7%
Mining
32%
Logistics
33% |
 2012 Analyst & Investor Day
CRITICAL NEXT STEPS
•
Transition from contract to
permanent labor force
•
Fly-in, Fly-out roster
•
Housing Management
•
Ore Characterization
•
Tailings
•
Logistics
•
Capitalize on lessons learned
•
Construction of
Phase II Concentrator
•
Continued to enhance
logistics network
34
Achieve targeted
production volumes
and scale
Human
Resources
Phase II preparations |
 CLIFFS NATURAL RESOURCES
DAVE BLAKE |
 2012 Analyst & Investor Day
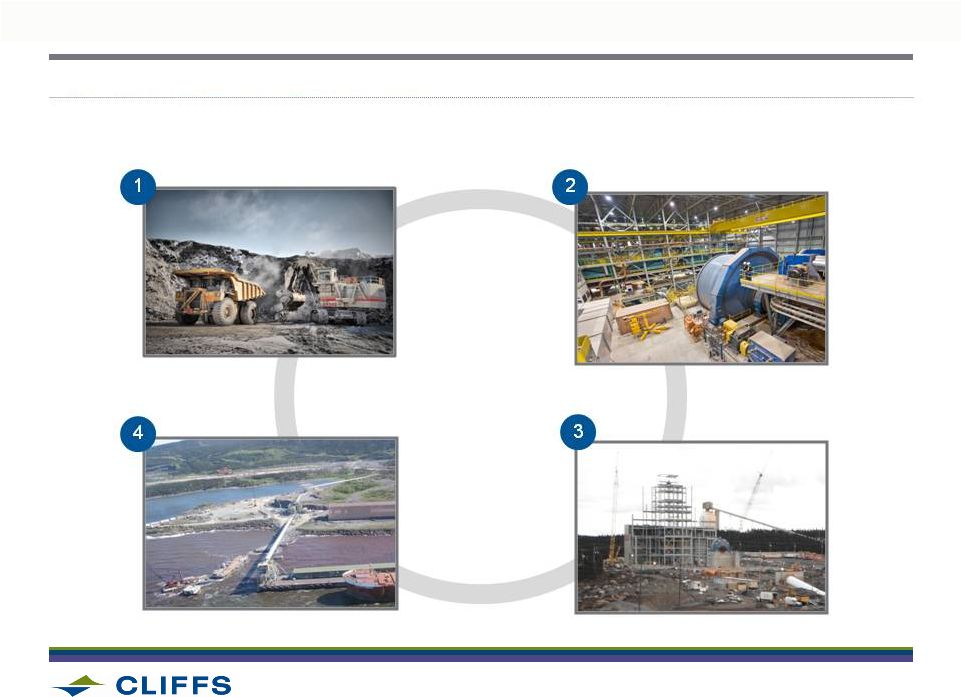
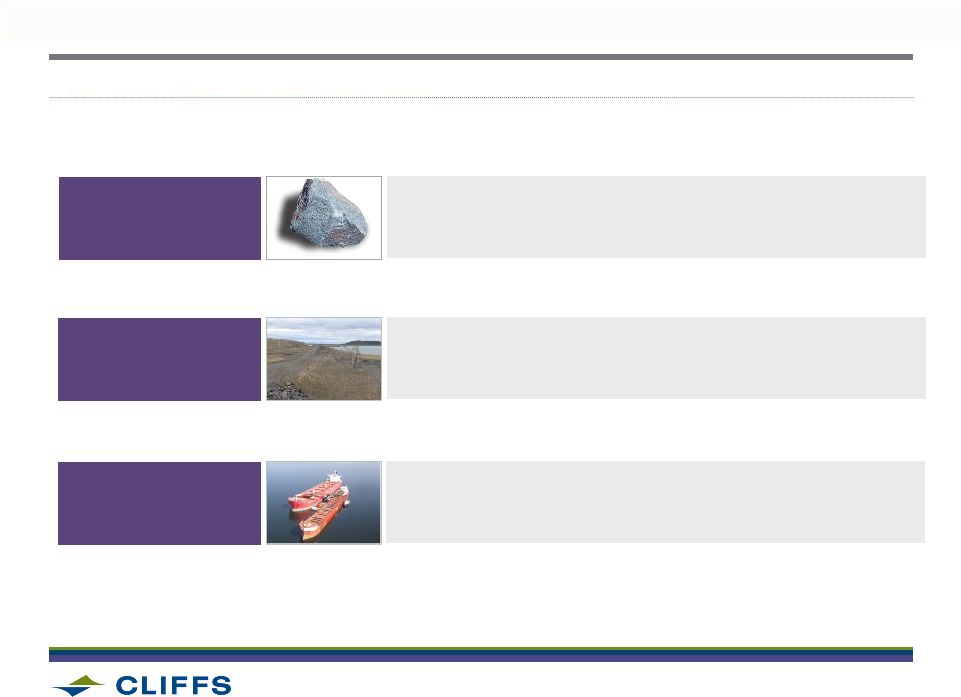
SIGNIFICANT LONG-TERM VALUE CREATION POTENTIAL FOR BLOOM LAKE
36
One Billion tons of resources
Operating concentrator
Rail and port facilities
Phase II project to double
production by end of 2013 |
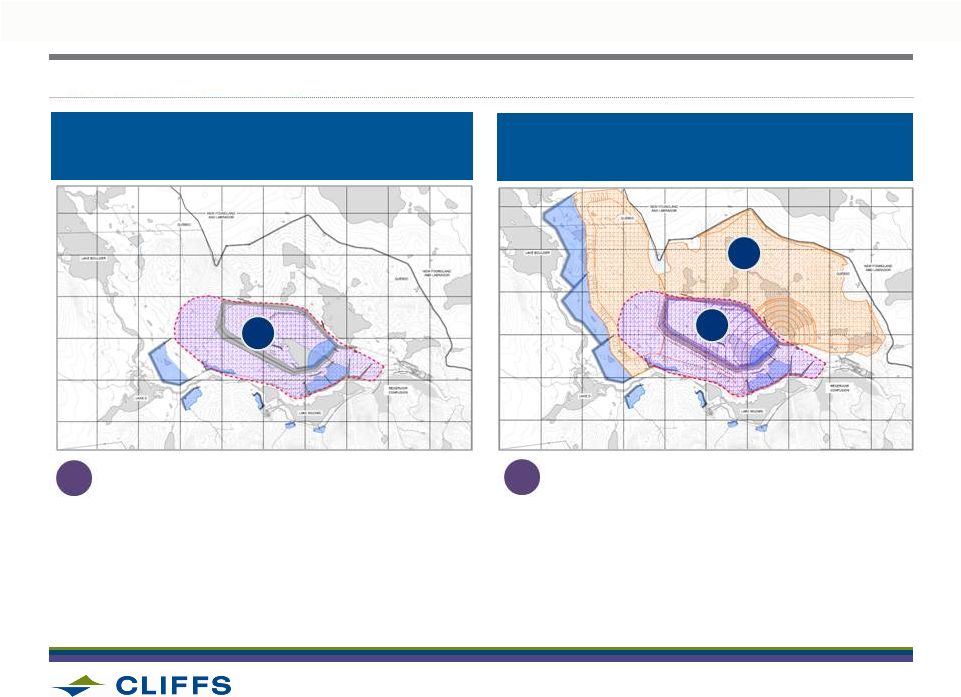
 2012 Analyst & Investor Day
INCREASE
IN
RESOURCE
BASE
POSITIONS
BLOOM
LAKE
FOR
FUTURE
EXPANSION
Future Expansions
•
Leverage Phase I & II infrastructure
•
No third crusher required ($50 million)
•
Mature mine development, tailings basin
and logistics base
37
580
1,051
0
300
600
900
1,200
Acquisition Model Resource
2011 Resource Estimate
2008 LOM Resource Limit
2011 LOM Resource Limit
Total Ore
(million metric tonnes) |
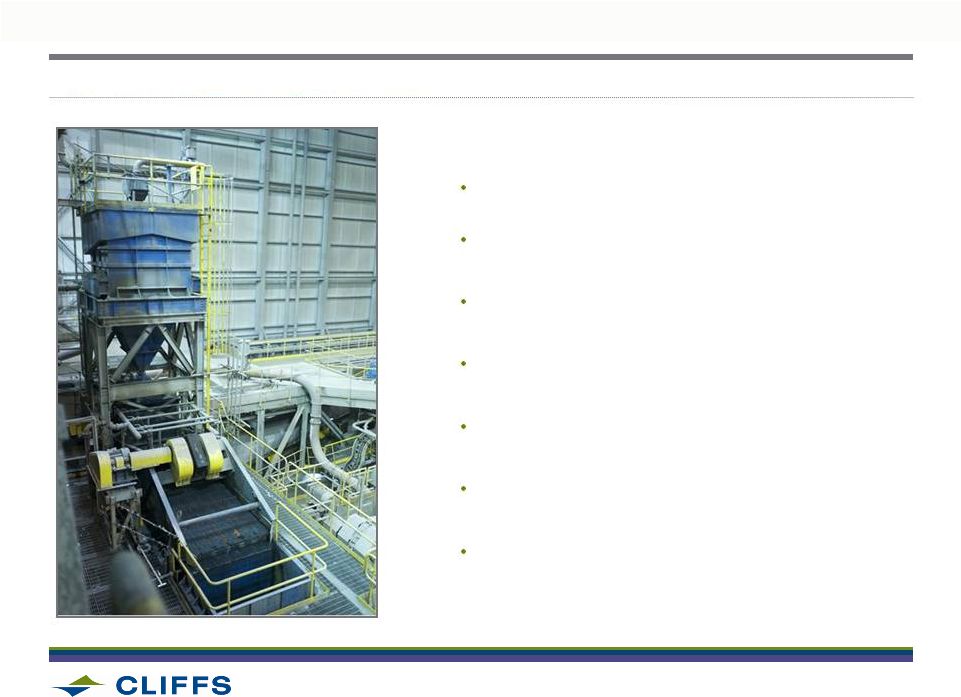
 2012 Analyst & Investor Day
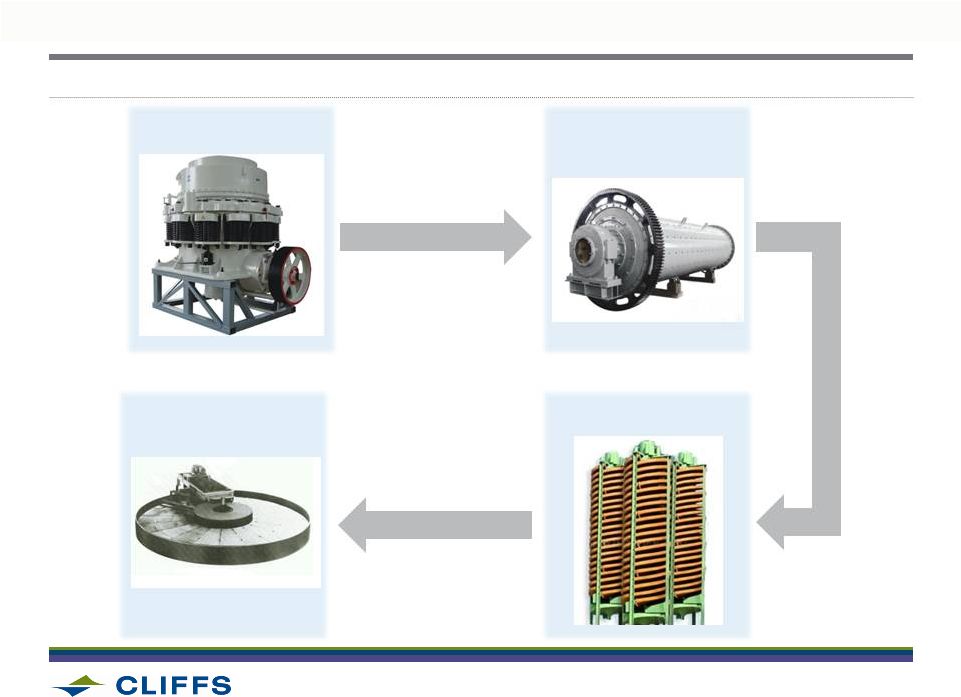
BLOOM LAKE CONCENTRATOR FLOW SHEET
38
CRUSHING
MILLING
FILTRATION
SPIRAL SEPARATION |
 2012 Analyst & Investor Day
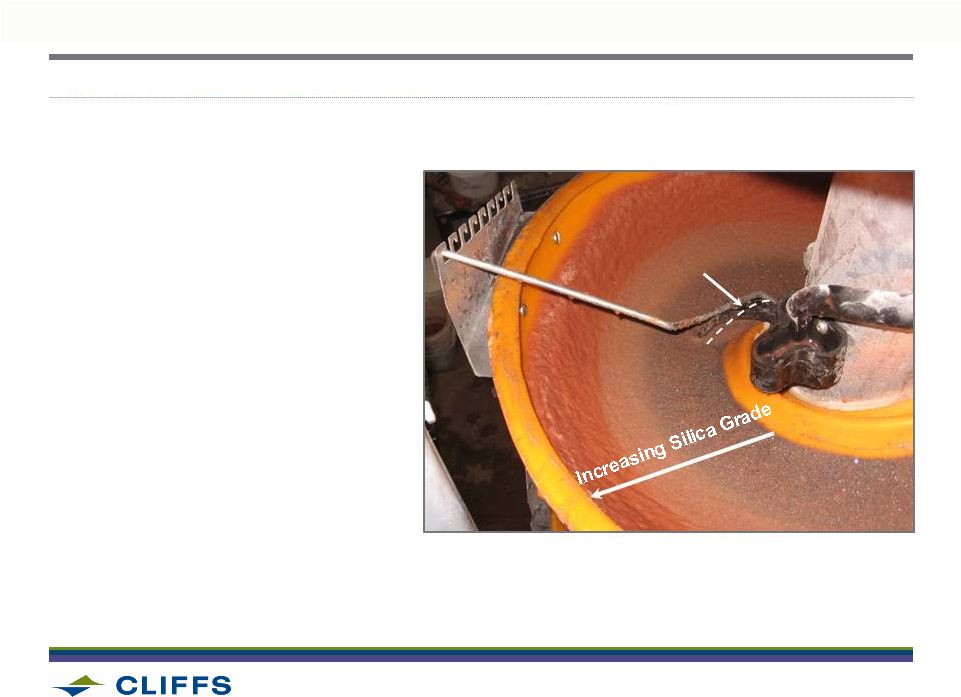
PRODUCING A LOWER SILICA PRODUCT AT BLOOM LAKE
39
Cutter Closing Decreases
Silica in Concentrate
•
Ore
Control
–
Mine
plan
is
sequenced to optimize plant
feed targets over time
•
Grind
Control
–
Circuit
optimized to increase
silica liberation
•
Spiral
Classifiers
–
Cutter
bar position, water addition
and SPC/Lab analysis
response plans
•
Grade increases toward
outer periphery of spiral |
 2012 Analyst & Investor Day
PHASE I KEY STABILIZATION STEPS
TAILINGS BASIN
ORE
CHARACTERIZATION
LOGISTICS
•
Develop and implement Mature Development Block process
•
Focus on consistent concentrator feed to improve quality
and lower costs
•
Expand tailings basin to support future growth
•
Lower operating costs through lower headcount/eliminating
manual tailings movement
•
Improve operations and maintenance practices
•
Deliver significant synergies
40 |
 2012 Analyst & Investor Day
UNDERSTANDING ORE CHARACTERIZATION
DEVELOP MATURE
OPERATIONAL BLOCK MODEL
DATA ANALYSIS &
INTERPRETATION
PREDICTABILITY AND
UNDERSTANDING
•
Test work on drill core
•
Chemical and
metallurgical testing
•
Real-time mine to mill
analysis of crude to
concentrate behaviors
•
Improve consistency of
concentrator feed
•
Provide process KPIs on:
•
Facilitates proper mine
planning
•
Provides sound input for
expected plant performance
41
•
Mill throughput rates
•
Iron recovery
•
Concentrate silica
•
Trace minerals |
 2012 Analyst & Investor Day
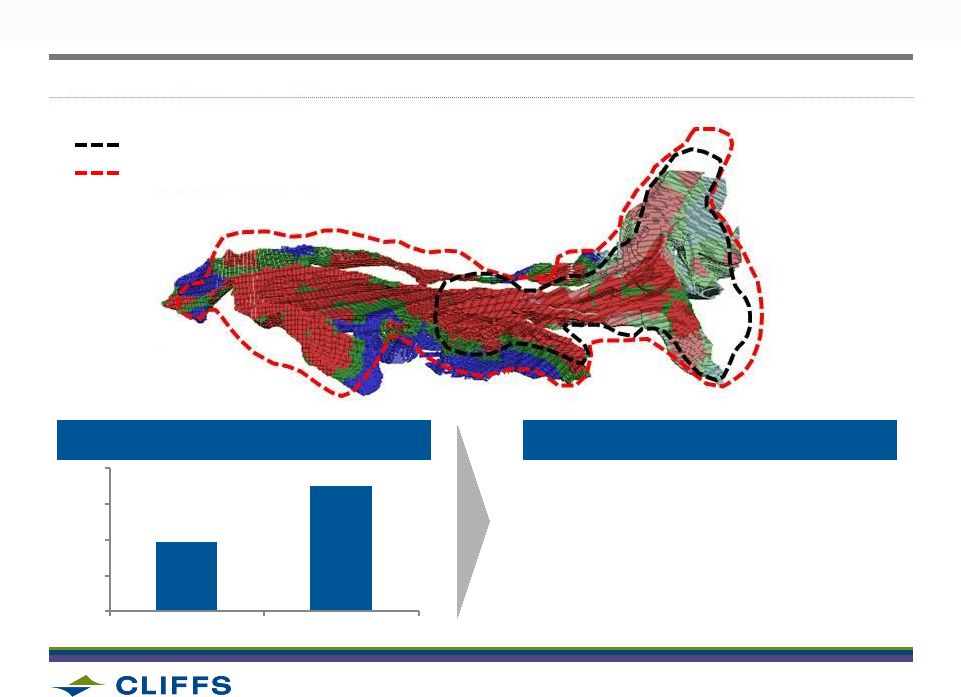
REDESIGN OF TAILINGS BASIN SUPPORTS 30-YEARS OF OPERATIONS
A
Original design (2011)
A
Re-designed
(2012
–
2014)
B
•
Undersized and insufficient storage for
future expansions
•
Footprint adequate only through mid 2013
ORIGINAL TAILINGS BASIN DESIGN
LIMITED LONG-TERM GROWTH
REDESIGNED TAILINGS BASIN WILL
SUPPORT GROWTH PLANS
A
B
•
Will allow sufficient storage for expansion
•
Meets permission to operate requirement
•
Reduce operating costs through elimination
of headcount and manual tailings management
42 |
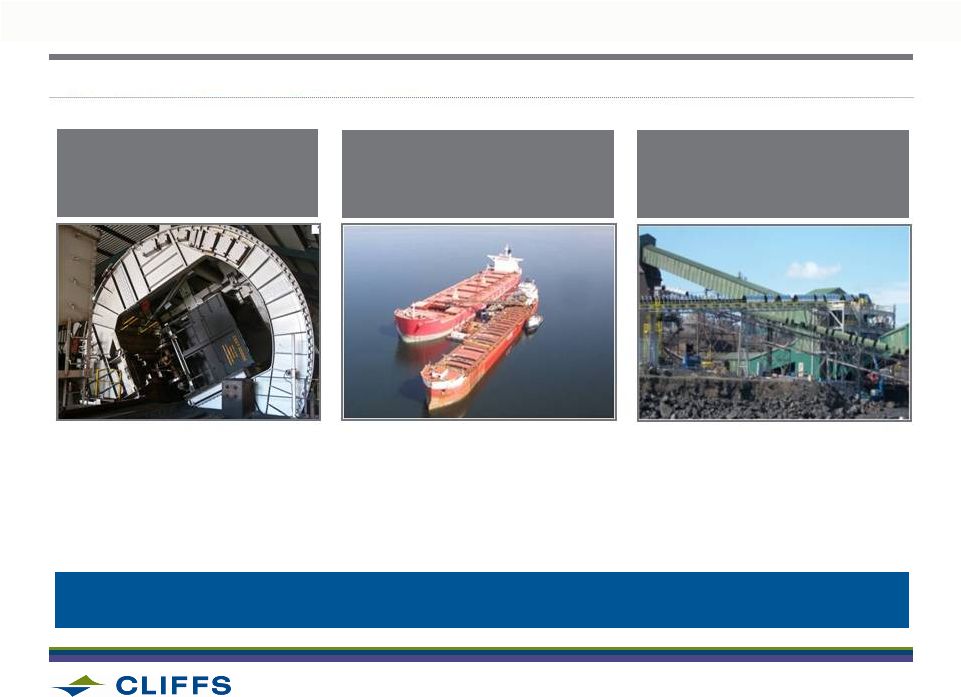 2012 Analyst & Investor Day
SYNERGIES BEING ACHIEVED FROM ORIGINAL BUSINESS PLAN
DOCK TO VESSEL
IMPROVEMENTS
IMPROVEMENTS TO
TRAIN UNLOADING
CROSS
CONVEYORS
•
Physically tie the two dock
operations together
•
Feed both docks with
product from either stockyard
•
Improvement of operations
and maintenance practices
•
Total unloading time has been
reduced by an average of
4 hours per train
•
Use of two transhippers to
load concentrate into larger
vessels at anchor in the bay
•
Dock reinforcement of 30
OVER LAST 6 WEEKS, VESSEL TURN TIME AVERAGE DOWN TO 4.5 VS. 9-10 DAYS WITH
ORIGINAL
LOGISTICS
–
POSITIONING
MINE
FOR
EXECUTION
OF
GROWTH
PLANS
43 |
 2012 Analyst & Investor Day
LEARNING FROM PHASE I DESIGNED INTO PHASE II
44
Improved Safety Design
Hydrosizer Startup and Test Work
Spiral Control and Optimization
Mill Liner Design
Mine Ore Control Plan
Crusher Design
Mill Cube Control |
 2012 Analyst & Investor Day
APPROXIMATELY $1,400 MILLION IN CAPITAL TO SPEND THROUGH 2013
45
•
Tailings management solution for future growth
•
Cross-conveyors upgrades at the port
•
Additions to mobile fleet, shovels and drills
CAPITAL SPEND TIMELINE
(IN
MILLIONS)
CAPITAL SPEND BREAKOUT
Concentrator
Equipment
Tailings
Mine Development
Infrastructure
Sustaining |
 2012 Analyst & Investor Day
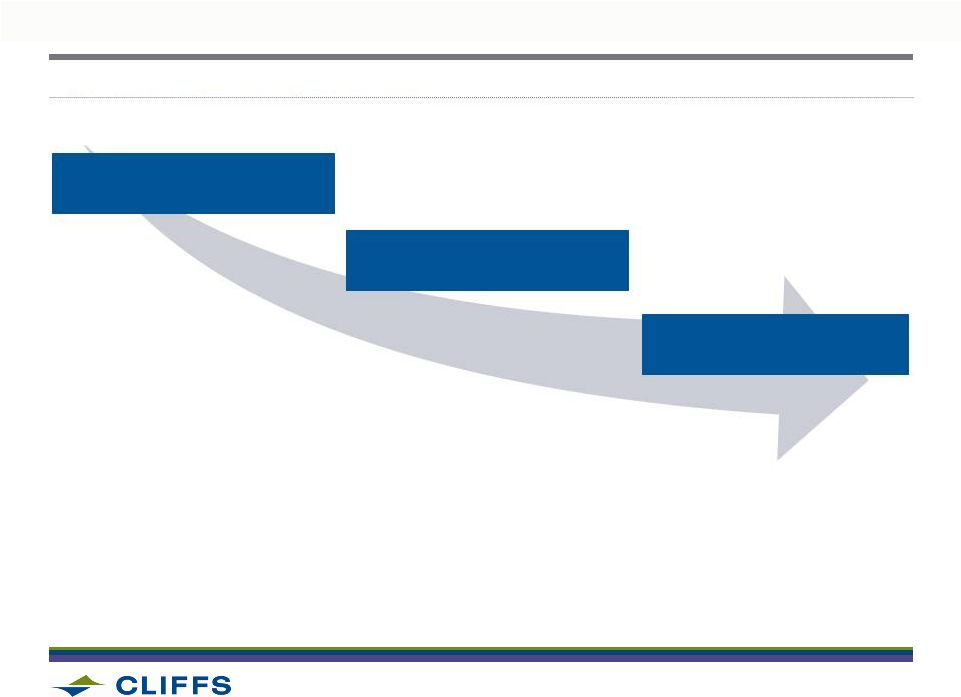
FOCUS ON FUNDAMENTALS, STABILIZE, OPTIMIZE AND DEVELOP KEY TO
REALIZING FULL POTENTIAL OF ASSETS
2012-2013
2013-2014
2015-2016
•
Permission to Operate
•
Mine Plan maturation
•
Maintenance Process
•
Phase II Startup &
Stabilization
•
Maximize Phase I
capabilities
•
Scoping study
underway for
expansion to 22 mpta
FOCUS ON FUNDAMENTALS
STABILIZE/OPTIMIZE
DEVELOP/OPTIMIZE
PHASE I
PHASE II
FUTURE EXPANSION
22 mtpa
14.5 mtpa
7.2 mtpa
46 |
 2012 Analyst & Investor Day
STRATEGIC FIT
Long-term Eastern Canada strategy and project value intact
STABILIZATION OF OPERATIONS
Focus on fundamentals for long-term sustainable operations
FUTURE GROWTH
Over 80% increase in reserve base from acquisition model
IN SUMMARY
47 |
 CLIFFS NATURAL RESOURCES
CLIFF SMITH |
 2012 Analyst & Investor Day
CLIFFS GLOBAL EXPLORATION GROUP
•
Select
group
of
geologists
and
exploration
professionals
located
in
Cliffs’
three primary geographies (North America, South America and Australia)
•
Current emphasis on near mine, Cliffs-owned properties in Eastern
Canada, Western Australia, and Decar nickel project
•
Focus on existing pipeline of strategic partnerships (project generators)
and Cliffs controlled projects
•
Focus
on
steelmaking
raw
materials,
stable
geopolitical
regions,
and
strategic fit
49 |
 2012 Analyst & Investor Day
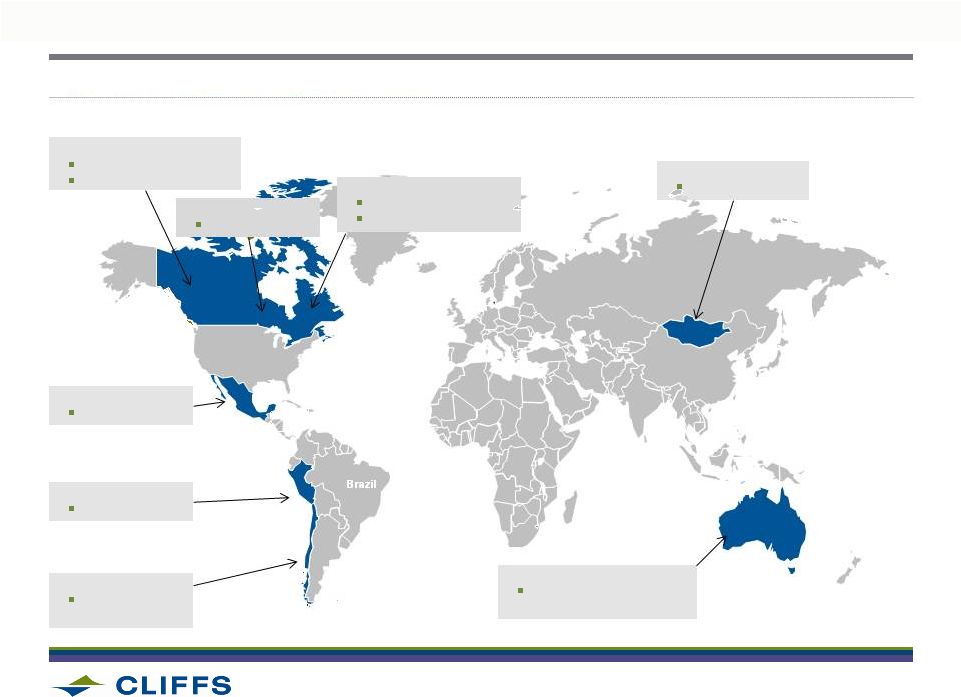
Brazil
Canada
Australia
Mongolia
DECAR PROJECT
15,000m drilling program
Progress to Scoping Study
LABRADOR TROUGH
Bloom Lake Drilling
Hobdab target initiated
PERU
Drilling campaign
CHILE
Airborne surveys,
drilling campaigns
AUSTRALIA
Drilling campaigns in WA
and near current operations
MONGOLIA
Magnetic surveys
MEXICO
Prospect reviews
GLOBAL EXPLORATION GROUP ACTIVITIES ARE MEASURED AND FOCUSED
50
RING OF FIRE
Data compilation |
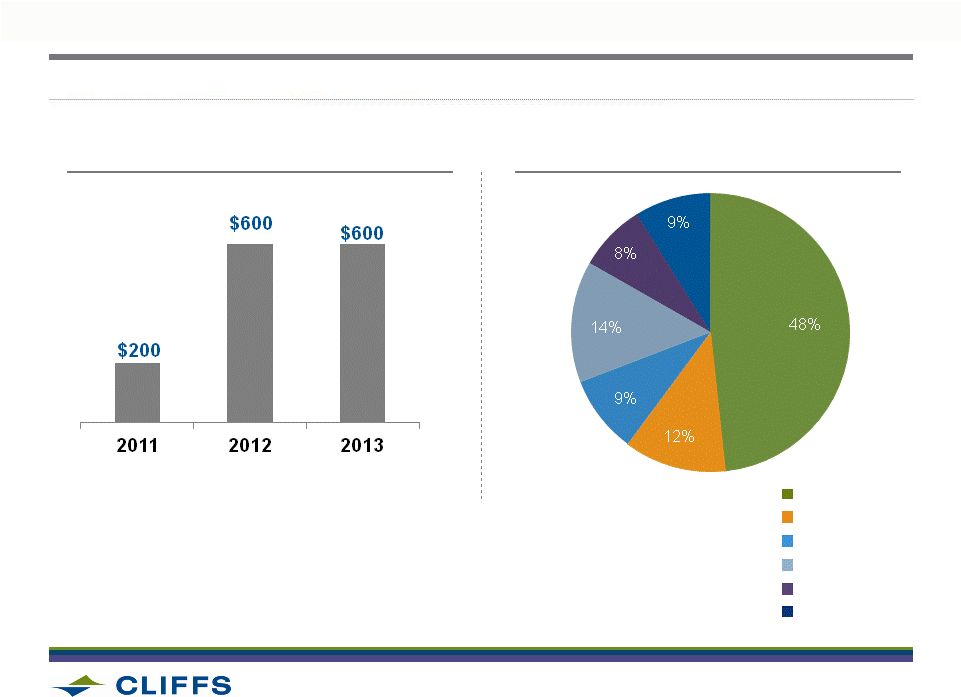
 2012 Analyst & Investor Day
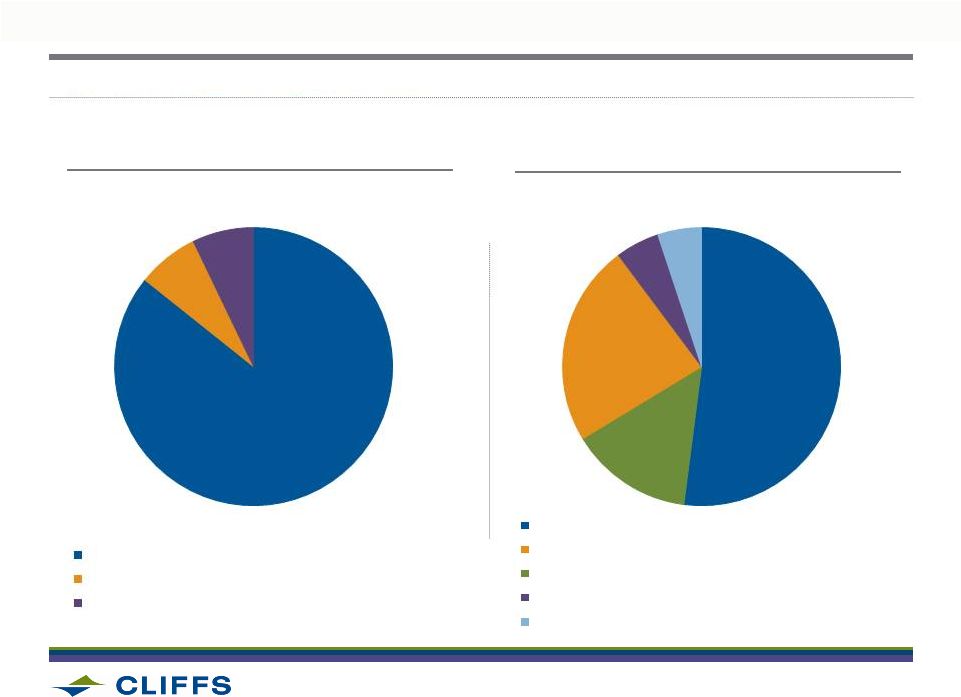
Met Coal (C)
WORLDWIDE EXPLORATION BUDGET IN 2012 IS $90 MILLION
51
Low Risk (Australia, Canada, Chile)
Moderate Risk (Peru, Mexico)
Moderate/Higher Risk (Mongolia)
Iron (Fe)
Nickel (Ni)
Copper/Gold (Cu-Au)
Manganese (Mn)
BUDGET ALLOCATION
BY COUNTRY RISK
BUDGET ALLOCATION
BY COMMODITY
7%
7%
84%
5%
5%
23%
14%
51% |
 2012 Analyst & Investor Day
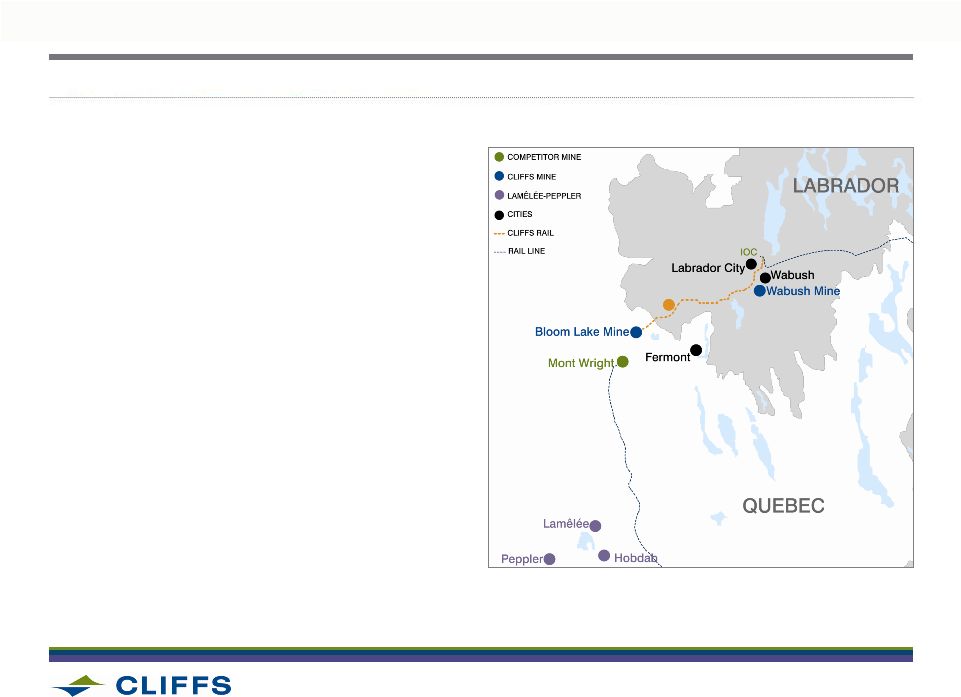
EXPLORATION WORK OUTSIDE OF BLOOM LAKE IN LABRADOR TROUGH
LAMELEE AND PEPPLAR LAKE
•
Located 45km south of Bloom Lake
•
Drilling program first began in 2006.
Total of 130 holes completed
•
Approximate 1 billion tonnes reported in
compliance to NI43-101 standards
•
Deposits dominated by magnetite with
lesser amounts of hematite; near surface
shallow dipping -
favorable for open pit
HOBDAB EXPLORATION TARGET
•
Exploration target located to east of
Pepplar Lake
52 |
 2012 Analyst & Investor Day
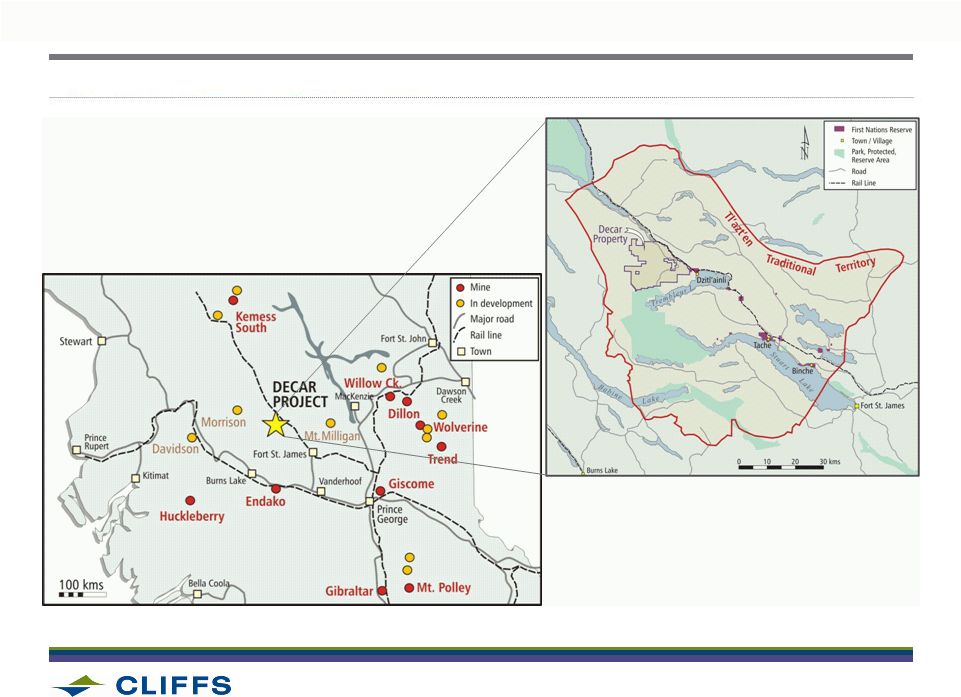
DECAR PROJECT -
POTENTIAL GAME CHANGING NICKEL DEPOSIT
•
Cliffs’
51% controlled interest in North Central British Columbia nickel-iron
alloy deposit -
not a nickel laterite or sulphide deposit
•
NI
43-101
estimate
complete
-
1.2
billion
ton
inferred
resource
at
0.113
Ni
•
Mineralization makes deposit amenable to open-pit mining methods
•
Located within 5km of Canadian National active branch and 110km of
British Columbia Hydro power grid
•
High-grade concentrates produced by simple magnetic and gravity
separation, with up to 15% Ni; balance iron, silica and some chromite
53 |
 2012 Analyst & Investor Day
DECAR
NICKEL
PROJECT
-
NORTH
CENTRAL
BRITISH
COLUMBIA
54 |
 •
Expected produced concentrates would contain no difficult impurities
•
Suitable and desirable feed into ferronickel plants with high
value-in-use properties
•
Geographic location provides access to ferronickel plants in Asia
•
Small-scale smelting tests in South Africa demonstrate performance in
conventional ferronickel smelting environment
•
Additional metallurgical testing planned for later in 2012
55
HIGH-QUALITY CONCENTRATE SUITABLE FOR MANY POTENTIAL BUYERS
2012 Analyst & Investor Day |
 2012 Analyst & Investor Day
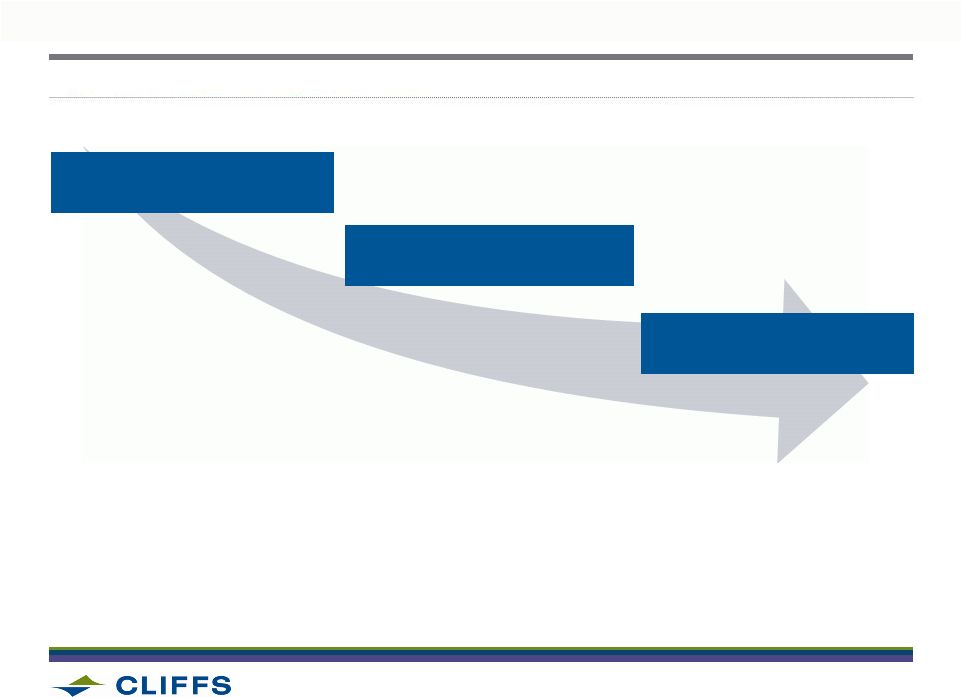
NEXT STEPS FOR DECAR NICKEL PROJECT
56
CONTINUE TO ESTABLISH
“LICENSE TO OPERATE”
SCOPING STUDY UNDERWAY
DECISION ON WHETHER TO
MOVE TO PREFEASIBILITY
•
Cliffs’
CIS process
•
Additional drilling to further
define high-grade area
•
Metallurgical testing
planned for Q3/Q4
•
Scoping completion
expected in 2013
•
MOU’s already signed with
Tl’azt’en Nation in May
•
Community Kick-Off Event
held
in
June
–
over
100
attendees |
 CLIFFS NATURAL RESOURCES
BILL BOOR |
 2012 Analyst & Investor Day
Source: Heinz Pariser; Cliffs Analysis
CHROME ORE END MARKETS
58
CHROME ORE
6%
METALLURGICAL (FeCr)
CHARGE/HIGH CARBON (HC)
FERROCHROME
LOW CARBON (LC)
FERROCHROME
Stainless Steel (Cr Input)
Alloy Steel
Others
END USE MARKETS
Transport
Consumer
Durables
Industrial
Equipment
Refineries &
Tubing
Construction &
Decorative
Other
Nickel alloy foundries
& welding materials
Austentic
Ferritic
Other
Grades
Tool & high speed
steel
Low alloy steel
66%
13%
13%
8%
HIGH-GRADE
CHROME ORE
94%
Refractory, Foundry
Sands & Chemicals |
 2012 Analyst & Investor Day
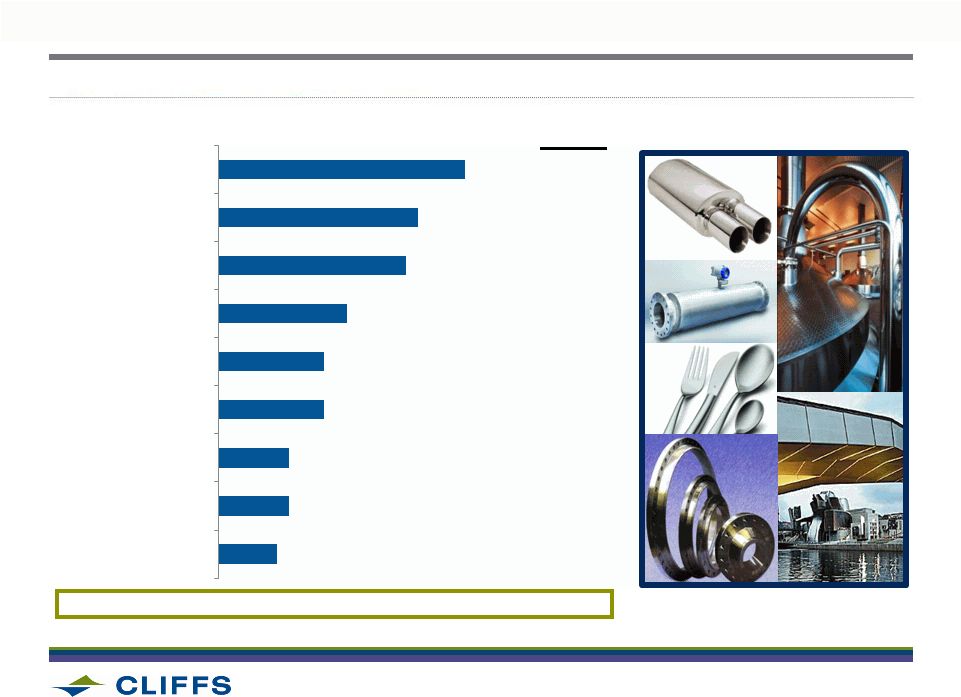
GLOBAL
STAINLESS
STEEL
CONSUMPTION
BY
END
USE
CATEGORY
-
2011
Source: CRU, Cliffs analysis
STAINLESS STEEL GROWTH
4.1%
5.0%
4.1%
5.3%
2.1%
1.6%
5.2%
5.7%
0.3%
4.1%
2011 -2016
CAGR
59
5%
6%
6%
9%
9%
11%
16%
17%
21%
Refineries & Tubing
Other
Transport
Motor Vehicles
Chemical Manufacturing
Other Equipment
Household Goods
Construction
Food & Beverage |
 2012 Analyst & Investor Day
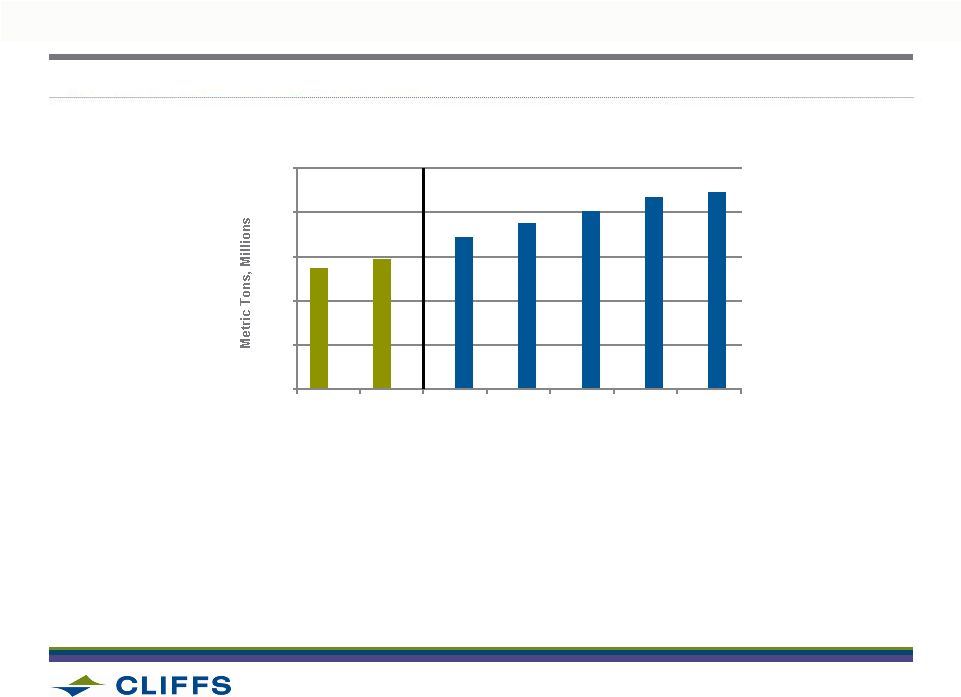
GLOBAL STAINLESS STEEL GROWTH
•
Total stainless steel production is expected to rise through 2016 to 42.2 million
tons from 33.6 million tons
•
Primarily driven by increasing income and economic growth in BRIC countries
Source: CRU, Cliffs analysis
60
20
25
30
35
40
45
2010
2011
2012 F
2013 F
2014 F
2015 F
2016 F
GLOBAL STAINLESS STEEL PRODUCTION
HISTORICAL
FORECAST |
 2012 Analyst & Investor Day
Source: Cliffs analysis
AUSTENITIC
AUSTENITIC
•
Consists
of
Cr
(16-26%),
Ni
(5
-
22%)
and
iron
•
Recycled material provides about 40% of Cr content
•
Primary applications: food processing equipment, aeronautics, railway
equipment, industrial piping and vessels
Trend: Increasing use of scrap
AUSTENITIC AND FERRITIC STAINLESS STEEL
FERRITIC
FERRITIC
•
Primarily consists of Cr (10.5-27%) and iron; essentially nickel free
•
No recycled materials are used
Trend: Taking share from Austenitic
61
Primary
applications:
automotive,
coal
mining,
hot
water
tanks,
domestic
appliance, dishware, tubes, and conveyor chains |
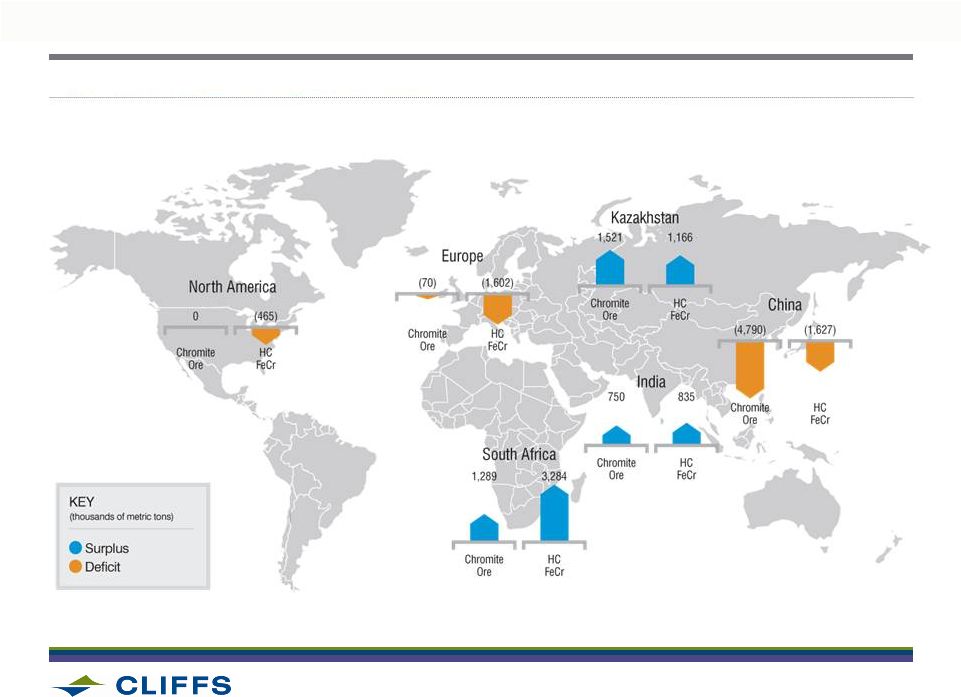 2012 Analyst & Investor Day
CHROMITE ORE AND FERROCHROME PRODUCTION AND CONSUMPTION
Note:
Map
above
excludes
production
and
consumption
from
Turkey,
Russia
and
ROW
62
Source: Metal Bulletin, Heinz Pariser
•
SIGNIFICANT
CHROMITE
ORE
AND
FERROCHROME
SUPPY
DEFICITS
EXIST
IN
NORTH
AMERICA,
EUROPE, AND CHINA |
 2012 Analyst & Investor Day
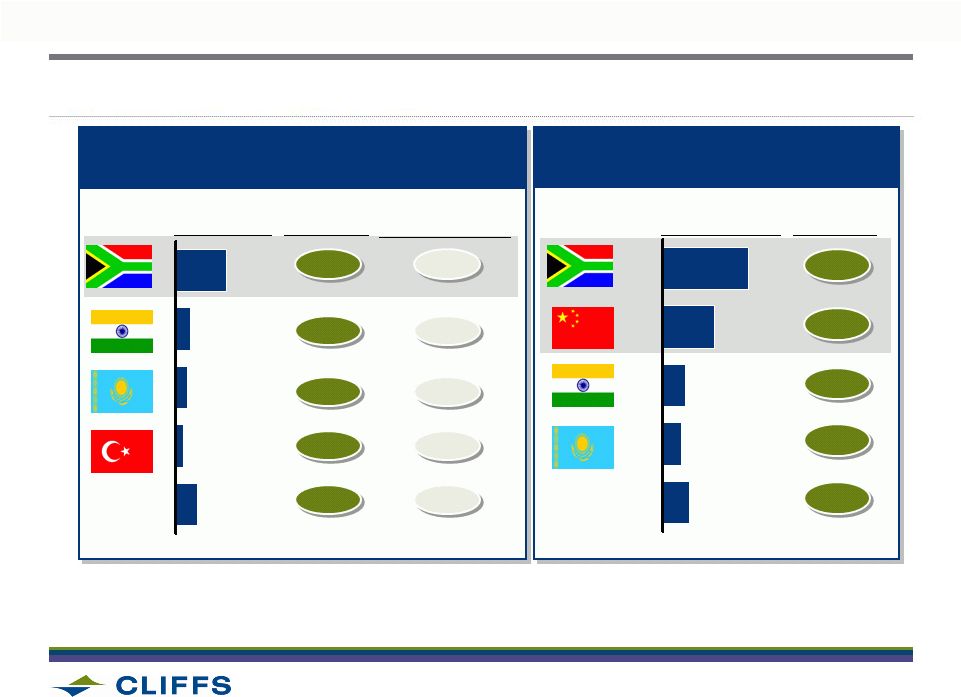
SOUTH AFRICA DOMINANT GLOBAL PLAYER ACROSS VALUE CHAIN, WHILE CHINA
FERROCHROME SMELTING CAPACITY IS GROWING
1 Incl. HC/LC/MC
2 Includes UG2 ore output
3 Includes Zimbabwe which represent ~15 % of total world reserves
SOURCE: MBR; ICDA; CRU
FECR PRODUCTION
2010
MILLION
METRIC
TONNES
13%
11%
7%
21%
42%
25%
11%
9%
13%
Volume
% of total
world reserves
% of total
1%
5%
1%
21%
% of total
Volume
48%
72%
2.1
3.2
13.8
3.8
2
6.1
Other
3.70
Other
1.16
0.82
1.00
2.23
South Africa
South Africa
India
Kazakhstan
Turkey
India
China
Kazakhstan
63
CHROMITE ORE OUTPUT
2010 MILLION METRIC TONNES
1
3
3 |
 2012 Analyst & Investor Day
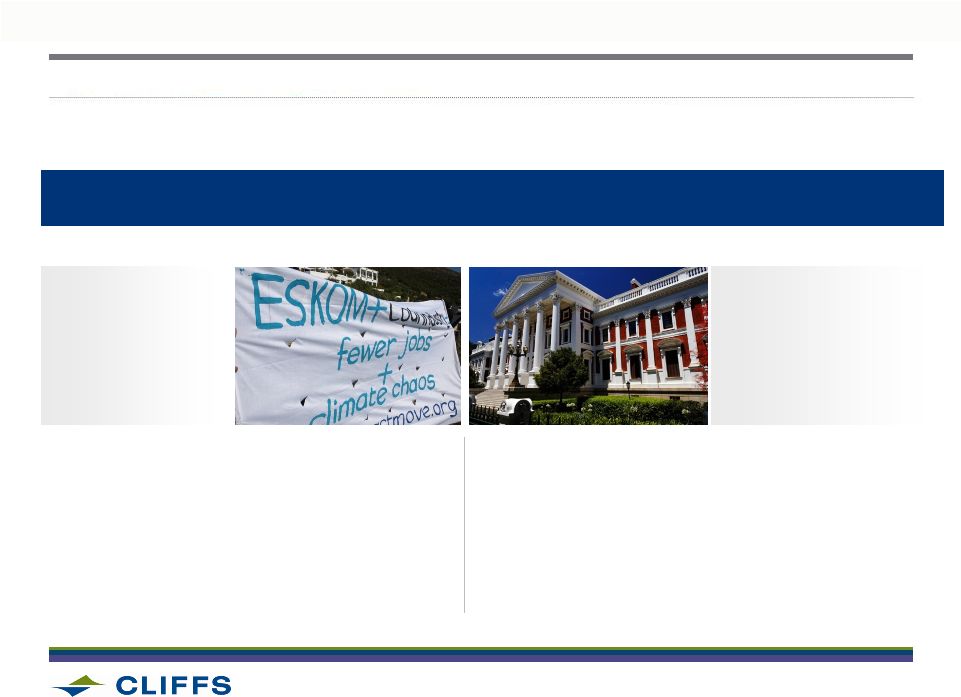
SOUTH AFRICA COST PRESSURES ARE RESHAPING THE INDUSTRY
Local Factor
Cost
Evolution
Escalation of input costs
Electricity and labor costs eroding
competitiveness
STRUCTURAL FACTORS LIMITING SUPPLY
Regulatory
Environment
Potential government policy changes
Potential export levy on chrome could
reduce competitiveness
64 |
 2012 Analyst & Investor Day
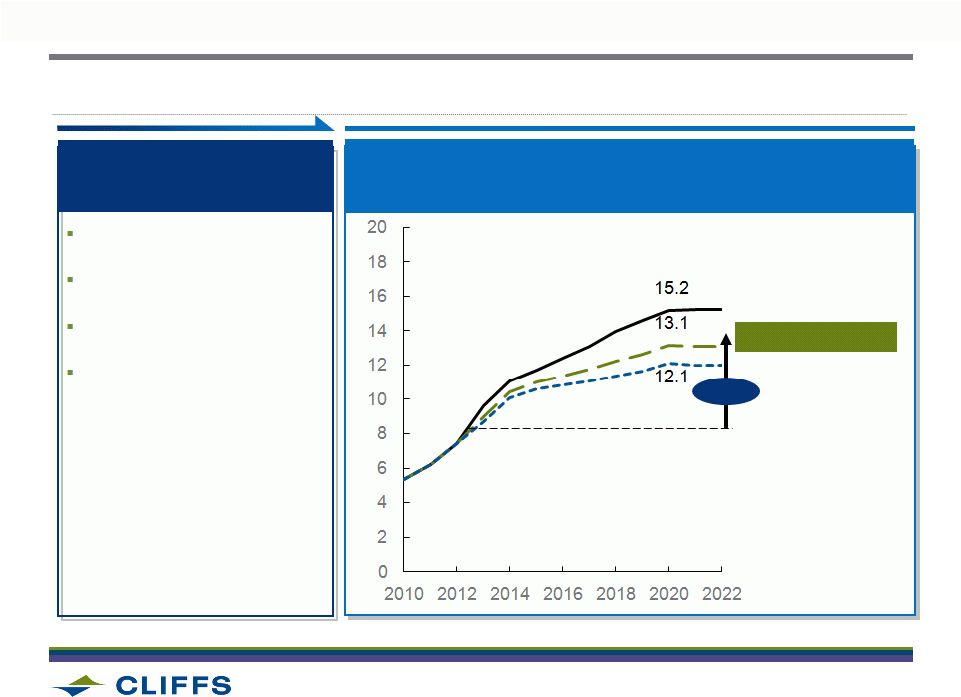
SOUTH AFRICAN INDUSTRIAL END USER TARIFF
(AVERAGE YEARLY TARIFF)
Real 2012 USDc per kWh
SOURCE: IRP (March 2011 version); EIU Inflation; Cliffs analysis
+76%
Low case scenario
Likely scenario
High case scenario
SOUTH
AFRICA
COST
ESCALATION
–
ELECTRICITY
PRICES
TO
INCREASE
BY
~75
%
OVER NEXT DECADE BEFORE STABILIZING IN 2020
KEY FACTORS AFFECTING
ELECTRICITY PRICES
Capacity gap in
electricity supply
Seasonal variations in
price tariffs
Variation in price tariffs
between customer segments
Potential introduction of
carbon taxes
Note: 1 USD = 7.8 ZAR
65 |
 2012 Analyst & Investor Day
2012
2.50
2.00
1.00
0.50
0
16
14
12
1.50
10
8
6
4
2
2017
2022
2.50
2.00
1.50
1.00
0.50
0
16
14
12
10
8
6
4
2
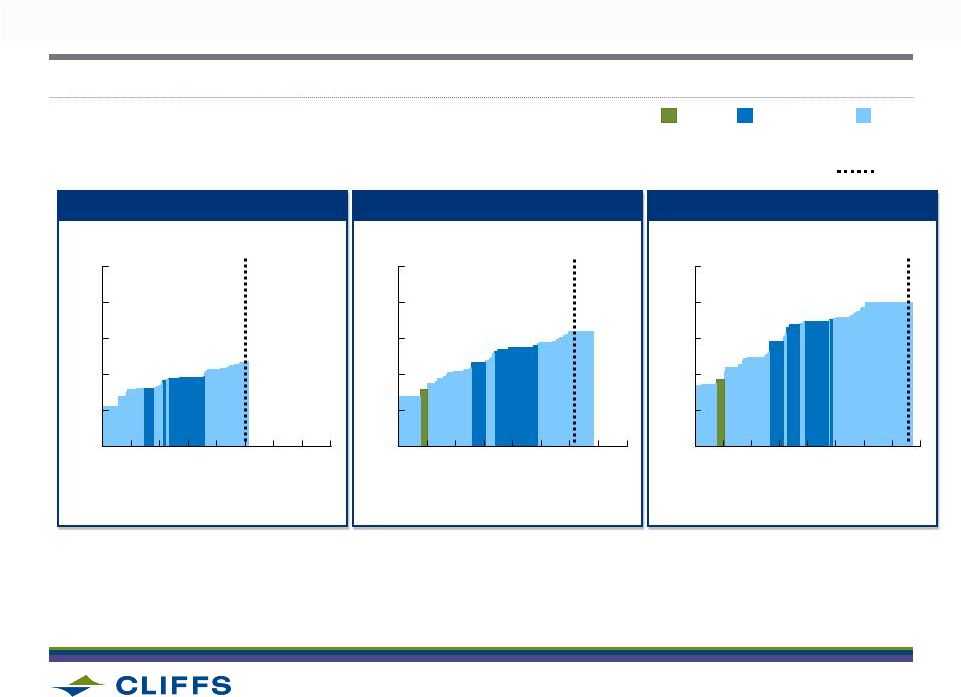
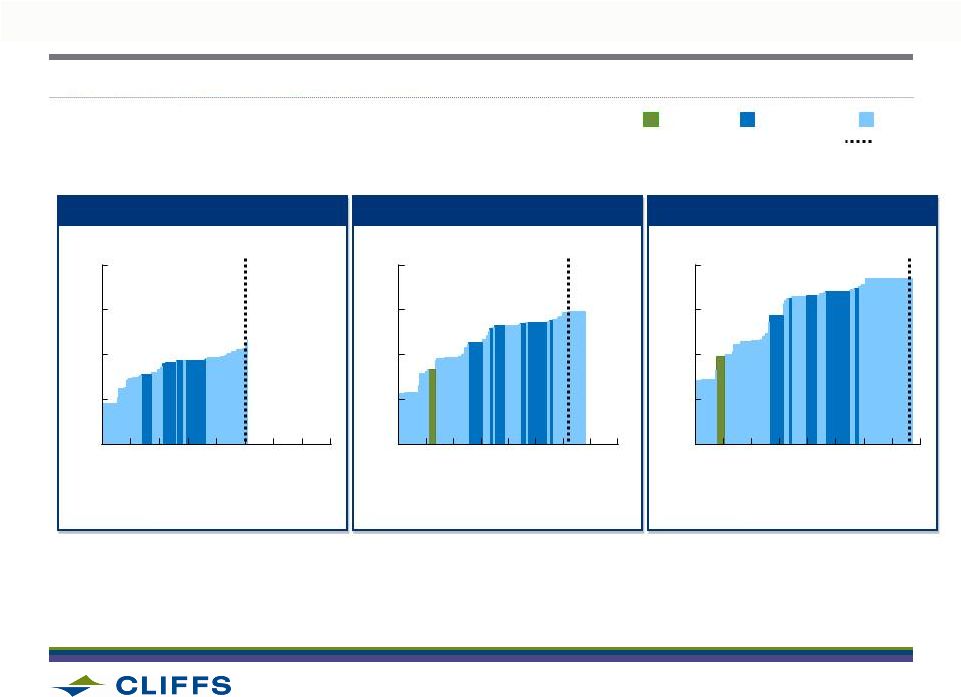
CLIFFS FERROCHROME PRODUCT COMPETITIVE IN THE US MARKET…
SOURCE: McKinsey chromite ore cost model, Cliffs analysis
10.0 Mt
12.3 Mt
Operating capacity
2
Million metric tonnes
Operating capacity
2
Million metric tonnes
Operating capacity
2
Million metric tonnes
2
2.50
2.00
1.50
1.00
0.50
0
16
14
12
10
8
6
4
0
15.2 Mt
Demand
Other
South Africa
Cliffs
CIF US cost
1
Nominal USD/lb Cr contained
1 Cr ore at cost
2
Operating capacity calculated as 90% of nameplate capacity
3 SA high cost players at 70% utilization and non-winter tariff
Note: Raw material (chromite ore) costs assumed to be at cost for integrated
players and at market price for standalone ferrochrome players 66
|
 2012 Analyst & Investor Day
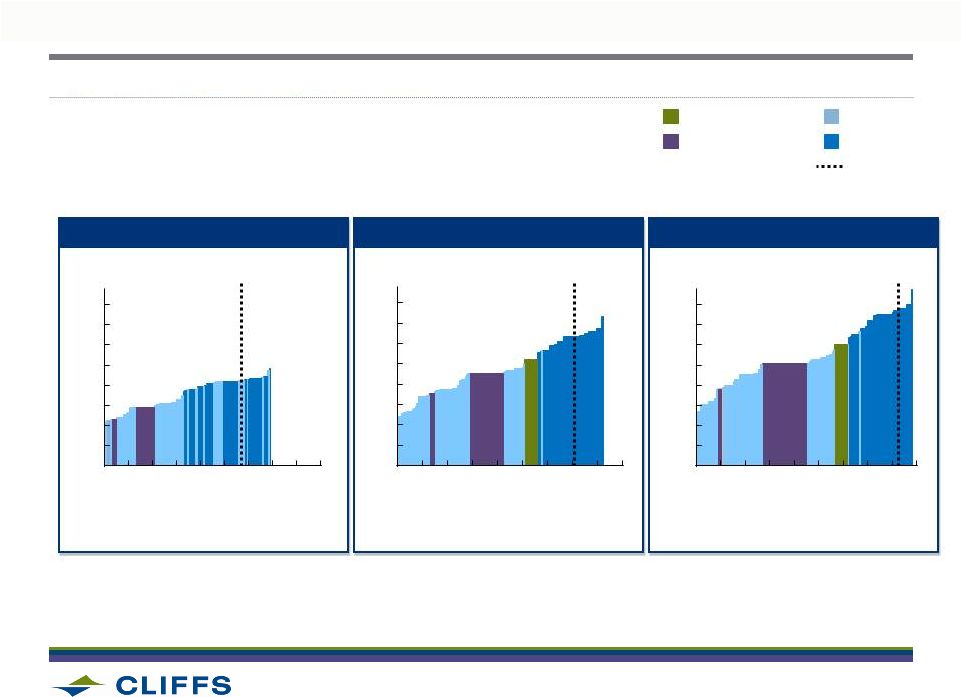
CIF
China
cost
1
Nominal USD/lb Cr contained
Operating
capacity
1
Million metric tonnes
Operating
capacity
1
Million metric tonnes
Operating
capacity
1
Million metric tonnes
2
6
4
14
8
12
10
16
0.50
0
1.00
2.00
1.50
... AND COMPETITIVE IN DISTANT MARKETS
SOURCE: McKinsey chromite ore cost model, Cliffs analysis
4
2
6
10
8
0
12
16
14
0.50
1.50
1.00
2.00
2.00
1.50
1.00
0.50
4
2
0
6
16
8
14
10
12
Other
Cliffs
South Africa
10.0 Mt
12.3 Mt
15.2 Mt
1 Chrome ore at cost
2
Operating capacity calculated as 90% of nameplate capacity
3 SA high cost players at 70% utilization and non-winter tariff
Note: Raw material (chromite ore) costs assumed to be at cost for integrated
players and at market price for standalone ferrochrome players Demand
67
2012
2017
2022 |
 2012 Analyst & Investor Day
2012
2017
2022
400
350
300
250
200
150
100
50
0
45
40
35
30
25
20
15
10
5
400
350
300
250
200
150
100
50
0
45
40
35
30
25
20
15
10
5
400
350
300
250
200
150
100
50
0
45
40
35
30
25
20
15
10
5
28.6 Mt
35.0 Mt
Operating capacity¹
Million metric tonnes
Operating capacity¹
Million metric tonnes
Operating capacity¹
Million metric tonnes
CLIFFS CONCENTRATE WILL BE COST COMPETITIVE
42.8 Mt
South Africa
Other
UG2 (Pt byproduct)
Cliffs
Demand
SOURCE: McKinsey chromite ore cost model
CIF China cost for 42% standard grade
chromite ore
Nominal USD per metric tonne
Note: Scenario assumes that SA will impose export levy on chromite ore of ~50
USD/tonne 1 Operating capacity calculated as 90% of nameplate capacity
68 |
 2012 Analyst & Investor Day
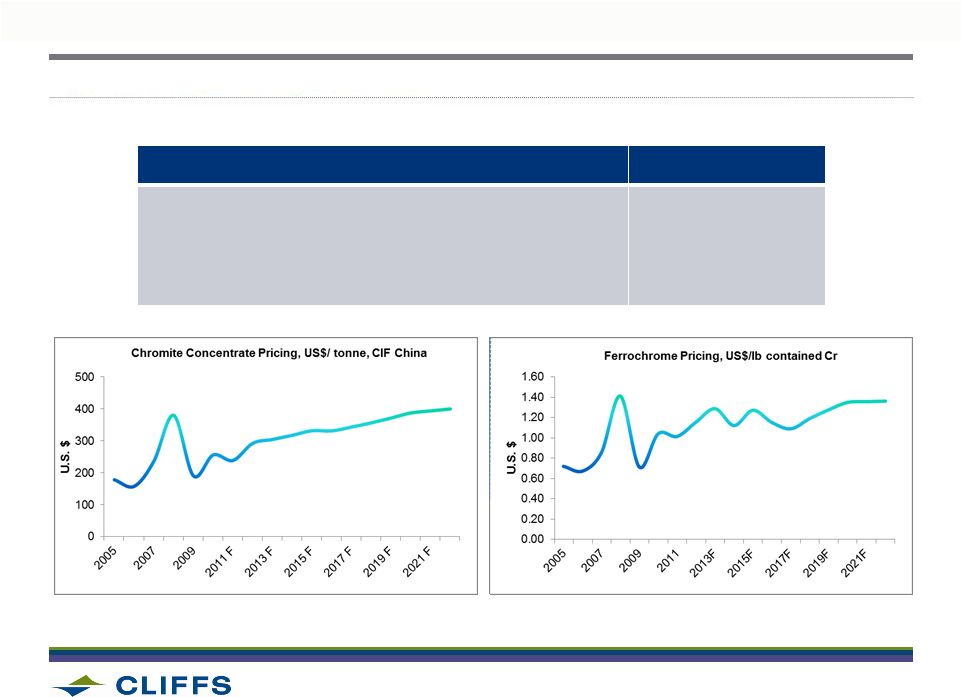
LIFE OF MINE
Concentrate ($/ tonne)
Concentrate grade
Ferrochrome ($/ lb cr content)
FeCr grade
$390
43%
$1.40
58%
COST CURVE TRENDS WILL DRIVE HIGHER INDUSTRY PRICING
REALIZED PRICING ASSUMPTIONS
Note: Price outlook excludes impact of proposed South Africa export duties
69
Source: Concentrate Pricing – McKinsey, FeCr Pricing – Heinz H. Pariser/Cliffs |
 2012 Analyst & Investor Day
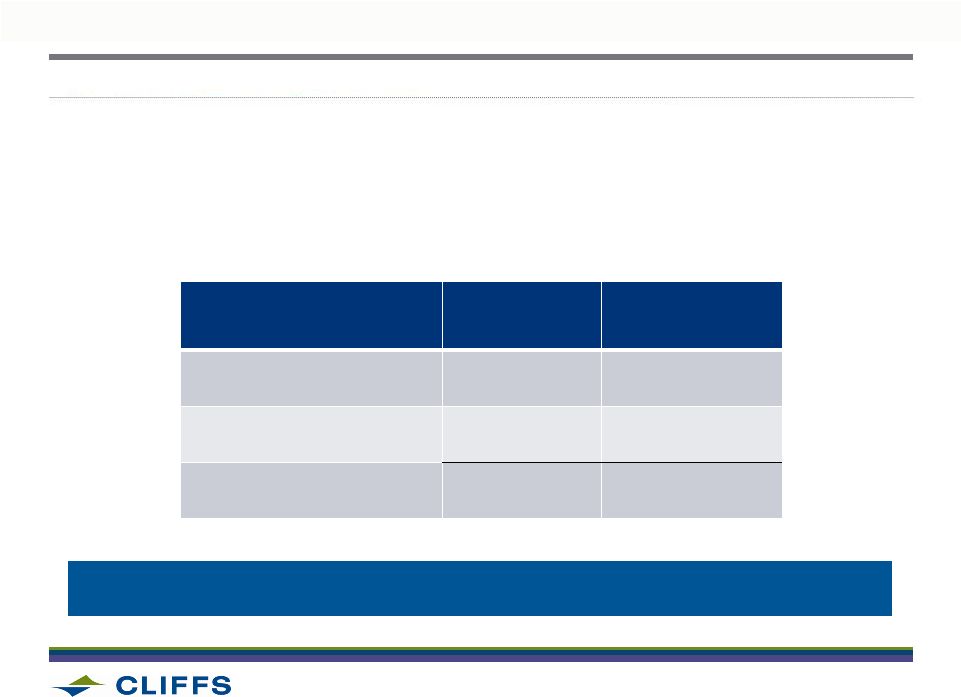
RESOURCE ESTIMATES HAVE EXCEEDED ACQUISITION BASIS BY 96%
CLIFFS PROJECT BASED ON THE BLACK THOR DEPOSIT
•
Measured and indicated resources now stand at 102 Mt
•
Remains open at depth
RESOURCE CATEGORY
(Tons in Millions)
ACQUISITION
Q1 / 10
CURRENT
Q1 / 12
MEASURED & INDICATED
102
INFERRED
69
33
TOTAL
69
135 [+96%]
70
OPPORTUNITY EXISTS TO FURTHER INCREASE RESOURCE FROM BLACK THOR AND
INCORPORATE POTENTIAL FROM BIG DADDY AND BLACK LABEL
|
 2012 Analyst & Investor Day
SUCCESSFUL TESTS IN SOUTH AFRICA AND ONTARIO HAVE REDUCED
TECHNICAL RISK
MINERAL PROCESSING
•
Metallurgical testing completed at Mintek (South
Africa) confirmed the process flowsheet and
material balance
FERROCHROME PRODUCTION
•
200 ton pilot furnace test at Mintek (South
Africa) and small scale test at XPS Sudbury
confirmed the following:
•
Metal recoveries were very high (> 90%)
•
DC furnace technology utilizing Cliffs’
concentrate
can
produce
alloy
with
57%
-
60%
chrome within customer chemistry requirements
71 |
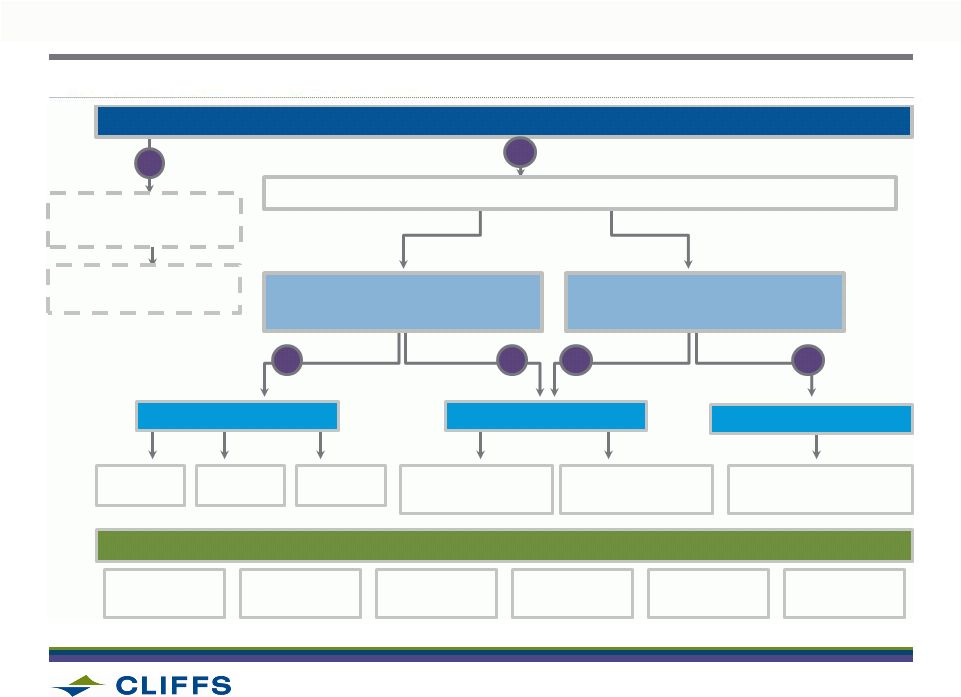
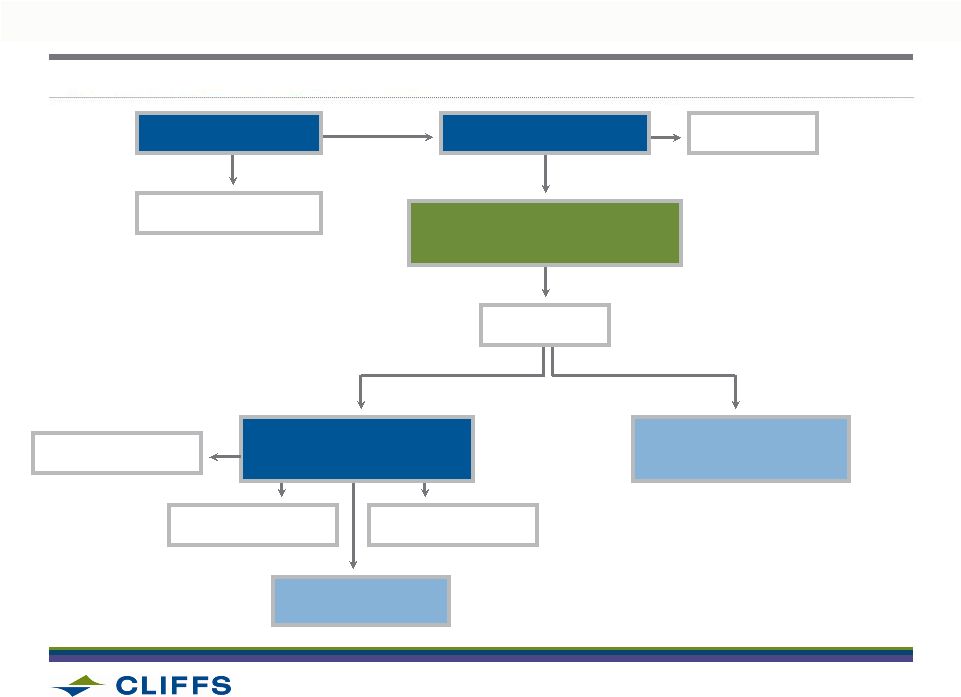 2012 Analyst & Investor Day
MINE
8:1 Strip Ratio
WASTE ROCK
33,200 KTPA
CONCENTRATOR
TAILINGS
TRANSPORATION
~100 70 ton trucks per day
334 km road
EXISTING
RAIL
CHINA ORE
MARKET
1,100 KTPA
FeCr PROCESSING FACILITY
4 DC Furnaces
60 MW each
560 KTPA
FeCR
SLAG
770KTPA
FLUX
220 KTPA
REDUCTANT
350 KTPA
1,100 KTPA
1,220 KTPA
4,150 KTPA
2,320 KTPA
PROJECT SCOPE LOCKED IN FOR FEASIBILITY
72 |
 2012 Analyst & Investor Day
Concentrate
FeCr
Natural market for chromite concentrates, as majority of
future demand growth resides in China
China
Competitively low delivered cost of FeCr
Proximity and strong existing relationships
U.S.
Stable, established markets
South Africa dominates, but Cliffs will be highly
competitive on a delivered cost basis
Europe, Japan,
Korea and Taiwan
PRODUCT
MARKET FOCUS
RATIONALE
MARKETING STRATEGY BASED ON THE GEOGRAPHIES OFFERING BEST
OPPORTUNITY FOR CLIFFS
NEARLY 50% OF FECR PRODUCTION ALREADY COMMITTED THROUGH
INDICATIONS OF INTEREST
73 |
 2012 Analyst & Investor Day
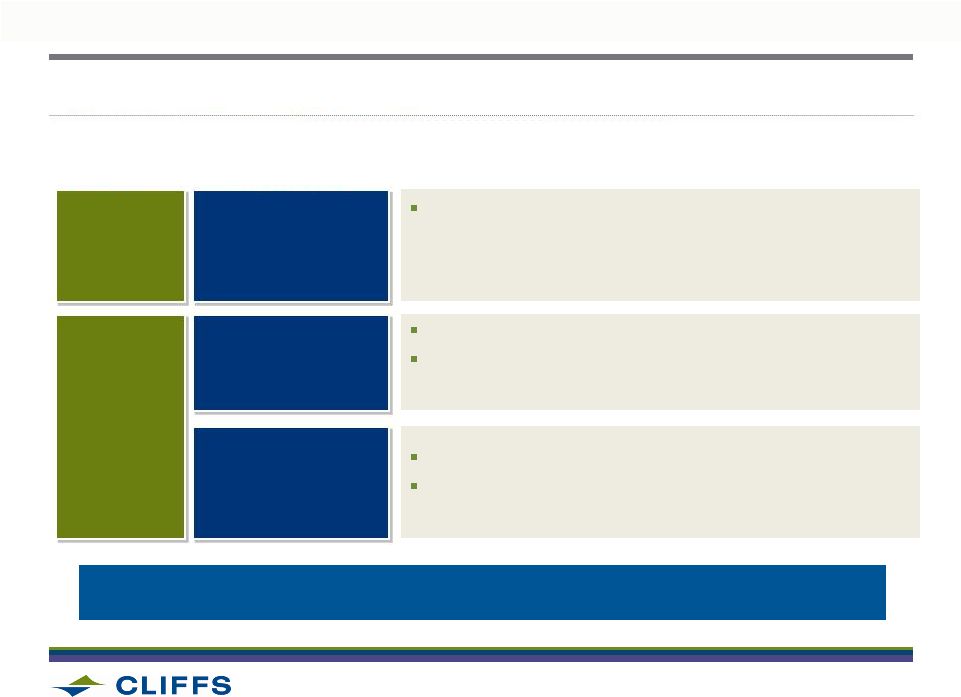
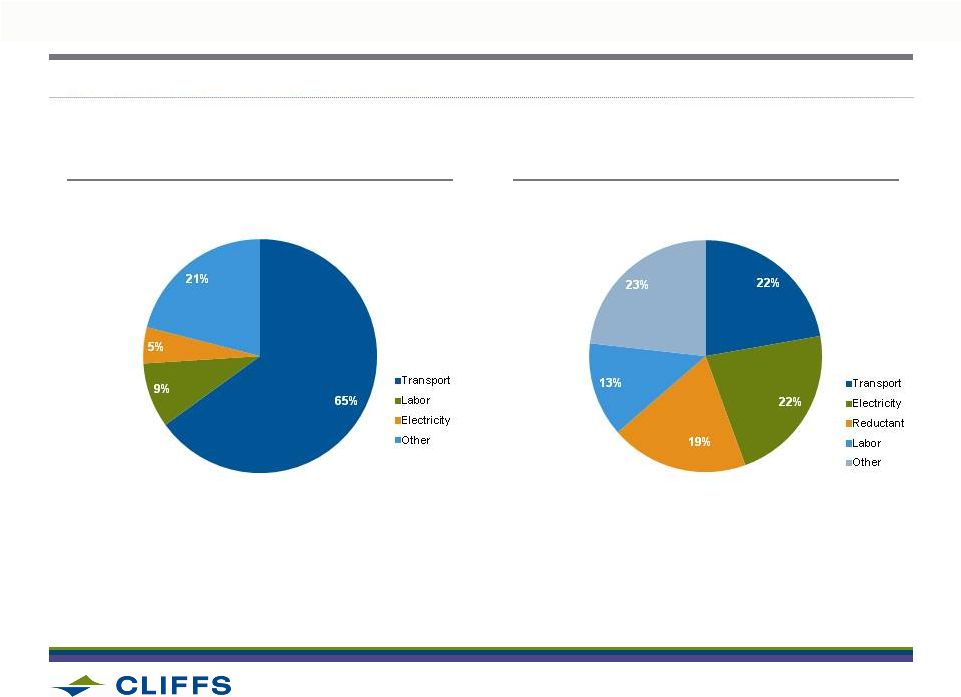
CLIFFS CASH COSTS IN CHROME ORE AND FERROCHROME WILL BE COMPETITIVE
TOTAL DELIVERED COST PER LB = $0.70
TOTAL DELIVERED COST PER TON = $200
OPEX BY ELEMENT
CONCENTRATE
OPEX BY ELEMENT
FECR
74 |
 2012 Analyst & Investor Day
24.4mt
CONSTRUCTION
Permit
Q3 2014
2012
2015
2016
THE OVERALL TIMELINE IS DRIVEN BY PERMITTING
$2.1 –
3.0 B
FEASIBILITY
PHASE
$200 M
$400 M
EARLY
WORKS
2013
2014
•
$90M OF FEASIBILITY STUDY COSTS WILL BE EXPENSED
75
CAPITAL SPEND EXPECTATION |
 2012 Analyst & Investor Day
WORLD-CLASS DEPOSIT POSITIONS THE PROJECT FOR ADVANCEMENT AND
SIGNIFICANT RETURNS
KEY ASSUMPTIONS
•
Capital Expenditures between
$2.7 -
$3.6 billion
•
Ferrochrome:
•
Volumes:
560 ktpy
•
Price**:
$1.40/lb contained Cr
•
Cost:
$0.70/lb
•
Concentrate:
•
Volumes:
1,100 ktpy
•
Price**:
$390/tonne
•
Cost:
$200/tonne
* IRR from Pre-feasibility Study
** Life-of-mine realized price
UPSIDE TO CLIFFS’
RETURNS
•
Potential JV partner
•
Pursue project financing
EXPECTED RETURNS
14% -
17%*
76 |
 2012 Analyst & Investor Day
CLOSING
•
Megatrends
continue
to
underpin
Cliffs’
strategic
decisions
•
Impressive pipeline of growth and expansion projects
•
Technical competencies and experienced operators position the Company for
successful execution of large-scale projects
•
Cliffs is transitioning to a more sophisticated and methodical economic
value- based management approach including a rigorous capital
investment system •
Cliffs’
portfolio of assets, growth track record, sound financial position, and
impressive cash dividend makes the Company an attractive investment
for shareholders |
 2012 Analyst & Investor Day
Q & A |