CLIFFS NATURAL RESOURCES INC.
CLF ROCKS NYC
TUESDAY        JUNE
28         2011
THE
NEW
YORK
STOCK
EXCHANGE
PROGRAM AGENDA
10:00 a.m.
WELCOME
Steve Baisden
Vice President, Investor Relations
and Communications
10:05 a.m.
Cliffs’
Overall
Strategy
Joseph Carrabba
Chairman, President and
Chief Executive Officer
10:35 a.m.
Global Marketing
Donald Gallagher
Executive Vice President,
President
Global
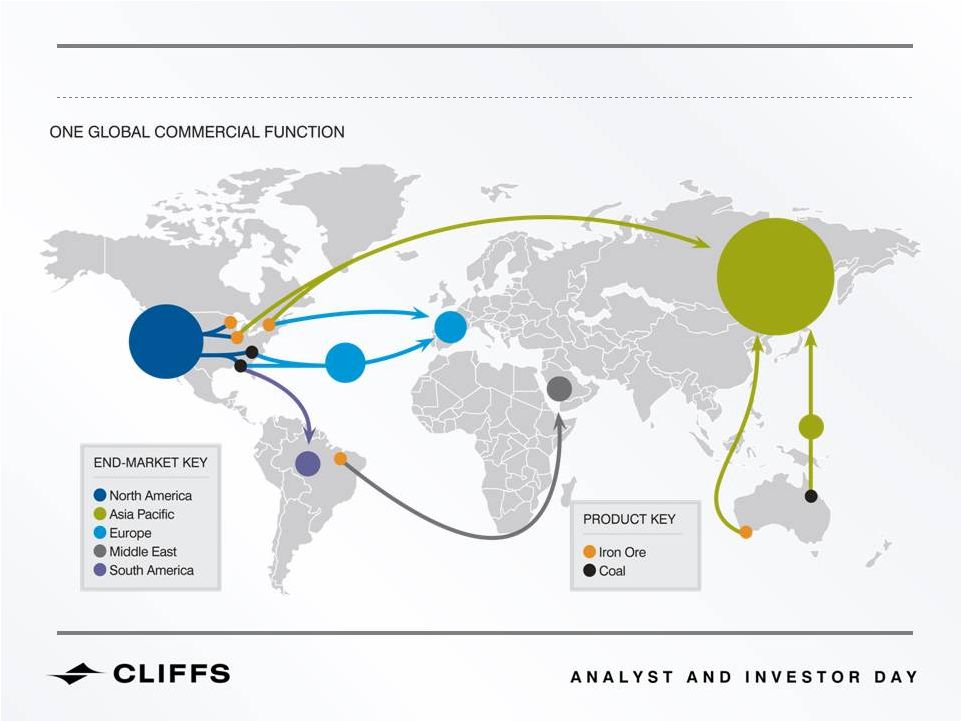
Commercial
Terrence Mee
Senior Vice President –
Global Iron Ore  & Metallic Sales
William Hart
Vice
President
Global
Marketing
11:10 a.m.
Eastern Canada
Integration & Expansion
David Blake
Senior Vice President, North
American
Iron
Ore
Operations
11:25 a.m.
Asia
Pacific
Iron
Ore
& North American Coal
Duncan Price
Executive Vice President,
President
Global
Operations
11:50 a.m.
Ferroalloys
William Boor
Senior Vice President –
Global Ferroalloys
12:15 p.m.
LUNCH
BREAK
1:25 p.m.
Global Exploration
Clifford
Smith
Senior Vice President –
Global
Business
Development
1:45 p.m.
Sustainability
P. Kelly Tompkins
Executive Vice President –
Legal, Government Affairs and
Sustainability & Chief Legal Officer
2:00 p.m.
Capital Structure
& Asset Allocation
Laurie Brlas
Executive Vice President –
Finance and Administration
& Chief Financial Officer
2:15 p.m.
Summary
Joseph Carrabba
Chairman, President and
Chief Executive Officer
2:20 p.m.
Q&A
Cliffs Executive
Leadership Team
3:00 p.m.
PROGRAM
CLOSE
Exhibit 99.1


PLEASE SUBMIT YOUR ELECTRONIC QUESTIONS TO: 
NYSE@CliffsNR.com
2


3
“Safe Harbor” Statement under the Private Securities Litigation Reform Act of 1995
This presentation and accompanying oral remarks contain statements that constitute “forward-looking statements” within the meaning of the Private Securities Litigation Reform Act of 1995. These
forward-looking statements may be identified by the use of predictive, future-tense or forward-looking terminology, such as “believes,” “anticipates,” “expects,” “estimates,” “intends,” “may,” “will” or
similar terms. These statements speak only as of the date of this presentation and we undertake no ongoing obligation, other than that imposed by law, to update these statements. These statements
appear in a number of places in this presentation and relate to our intent, belief or current expectations of our directors or our officers with respect to: our future financial condition, results of operations
or prospects; estimates of our economic iron ore and coal reserves; our business and growth strategies; and our financing plans and forecasts. You are cautioned that any such forward-looking
statements are not guarantees of future performance and involve significant risks and uncertainties, and that actual results may differ materially from those contained in or implied by the forward-
looking statements as a result of various factors, some of which are unknown, including, without limitation:
 
•   the ability to successfully integrate acquired companies into our operations, including without limitation, Consolidated Thompson Iron Mines Limited;
 
•   uncertainty or weaknesses in global and/or market economic conditions, including any related impact on prices;
 
•   trends affecting our financial condition, results of operations or future prospects;
 
•   the ability to reach agreement with our iron ore customers regarding modifications to sales contract pricing escalation provisions to reflect a shorter-term or spot-based 
      pricing mechanism;
 
•   the outcome of any contractual disputes with our customers or significant energy, material or service providers;
 
•   the outcome of any arbitration or litigation;
 
•   changes in sales volume or mix;
 
•   the impact of price-adjustment factors on our sales contracts;
 
•   the ability of our customers to meet their obligations to us on a timely basis or at all;
 
•   our actual economic ore reserves or reductions in current resource estimates;
 
•   the success of our business and growth strategies;
 
•   our ability to successfully identify and consummate any strategic investments;
 
•   our ability to achieve post-acquisition synergies;
 
•   events or circumstances that could impair or adversely impact the viability of a mine and the carrying value of associated assets;
 
•   the results of pre-feasibility and feasibility studies in relation to projects;
 
•   impacts of increasing governmental regulation including failure to receive or maintain required environmental permits, approvals, modifications or other authorization of, or from, any  
      governmental or regulatory entity;
 
•   adverse changes in currency values, currency exchange rates and interest rates;
 
•   the success of our cost-savings efforts;
 
•   our ability to maintain adequate liquidity and successfully implement our financing plans;
 
•   our ability to maintain appropriate relations with unions and employees;
 
•   uncertainties associated with unanticipated geological conditions, natural disasters, weather conditions, supply and price of energy, equipment failures and other unexpected events;
 
•   risks related to international operations;
 
•   the potential existence of significant deficiencies or material weakness in our internal control over financial reporting; and
 
•   the risk factors referred to or described in the “Risk Factors” section of our documents filed with the Securities and Exchange Commission.
Reference is made to the detailed explanation of the many factors and risks that may cause such predictive statements to turn out differently, set forth in the Company's Annual Report and Reports on
Form 10-K, Form 10-Q and previous documents filed with the Securities and Exchange Commission, which are publicly available on Cliffs Natural Resources Inc.’s website. The information contained
in this document speaks as of today and may be superseded by subsequent events.
We caution you that the foregoing list of important factors is not exclusive. In addition, in light of these risks and uncertainties, the matters referred to in our forward-looking statements may not occur.
We undertake no obligation to publicly update or revise any forward-looking statement as a result of new information, future events or otherwise, except as may be required by law. We also strongly
urge you to not rely on any single financial measure to evaluate our business.


Joe Carrabba
CLIFFS NATURAL RESOURCES INC.
CLIFFS’
OVERALL STRATEGY
4


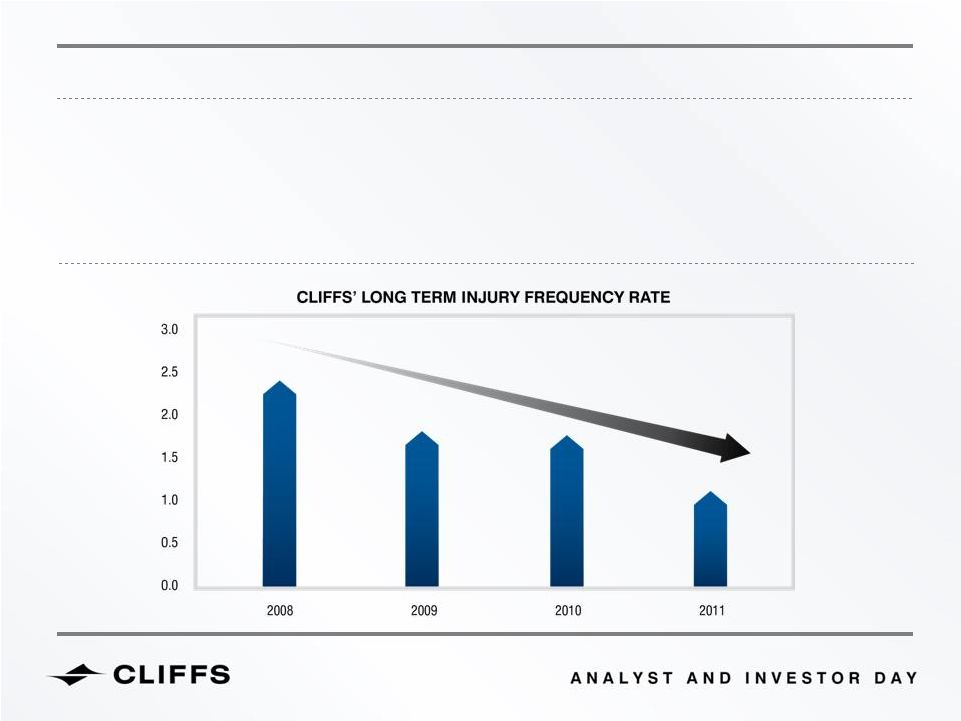
SAFETY IS A TOP PRIORITY
Safety
has
been
and
will
always
be
at
the
core
of
Cliffs’
strategy
Continuing focus of investment
Safety approach and lower trending LTIFR position Cliffs as an employer of choice
5


THE CLIFFS JOURNEY HAS JUST BEGUN...
6
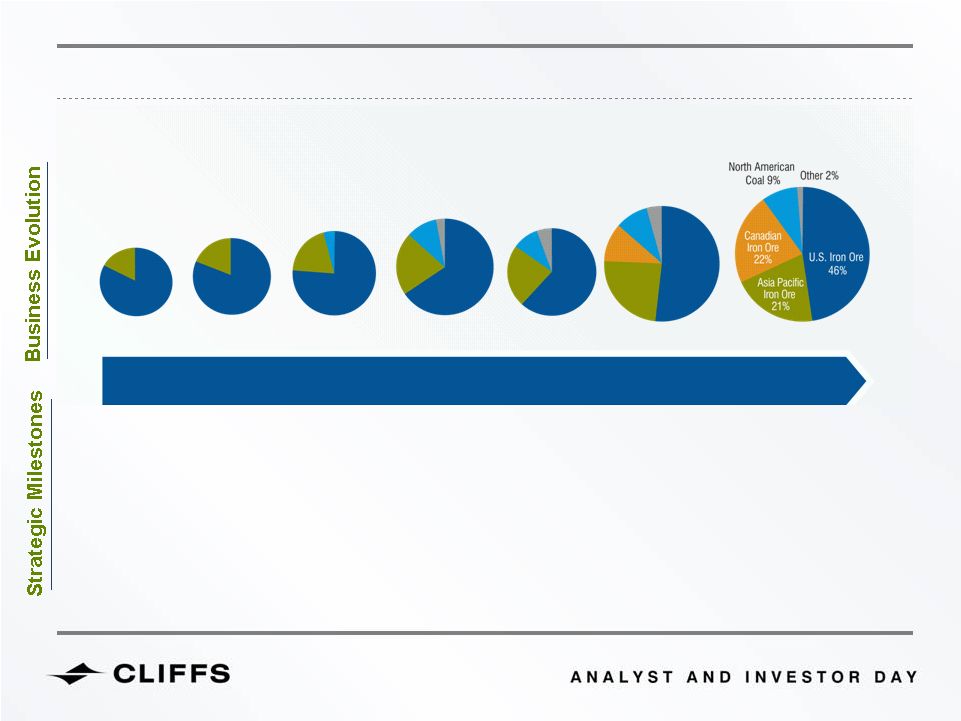
Since 2004 Cliffs has transitioned from a geographically concentrated mine
operator to a diversified mine owner
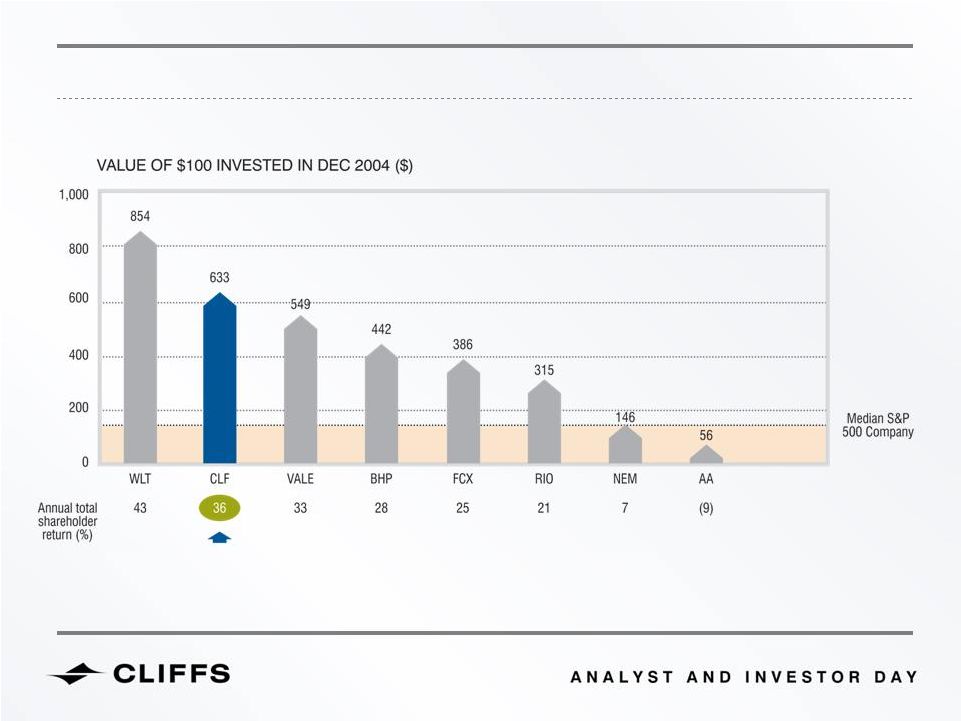
In the process we have created tremendous value for our shareholders by
providing
36%
returns
annually
an
achievement
that
puts
us
near
the
top
of our peer group
Moving forward our aspirations are ambitious –
continue to deliver
outstanding shareholder value and gain scale through diversification
To accomplish this, it's critical we deliver on our organic growth through
execution and operational excellence


NEAR-
& LONG-TERM TACTICS
Increase Seaborne Exposure
Enhance Project Pipeline
Customer & Mineral Diversification
Apply Technical Competencies
CLIFFS WILL CONTINUE EXECUTING ITS SOUND STRATEGY SUPPORTED BY
FUNDAMENTAL BELIEFS
CLIFFS’
LONG-LASTING STRATEGY
Build Scale in Steelmaking Raw Materials
INCREASING GLOBAL
DEMAND FOR STEEL
Urbanization of BRIC Economies
GDP Growth
DEGRADING ORE
QUALITY & GRADE
Increased Stripping Ratios
New Projects are Lower-
Grade Magnetite Ore
NEW SUPPLY CHALLENGES
Complex Logistics
Capital Intensity
Environmental Permitting
7


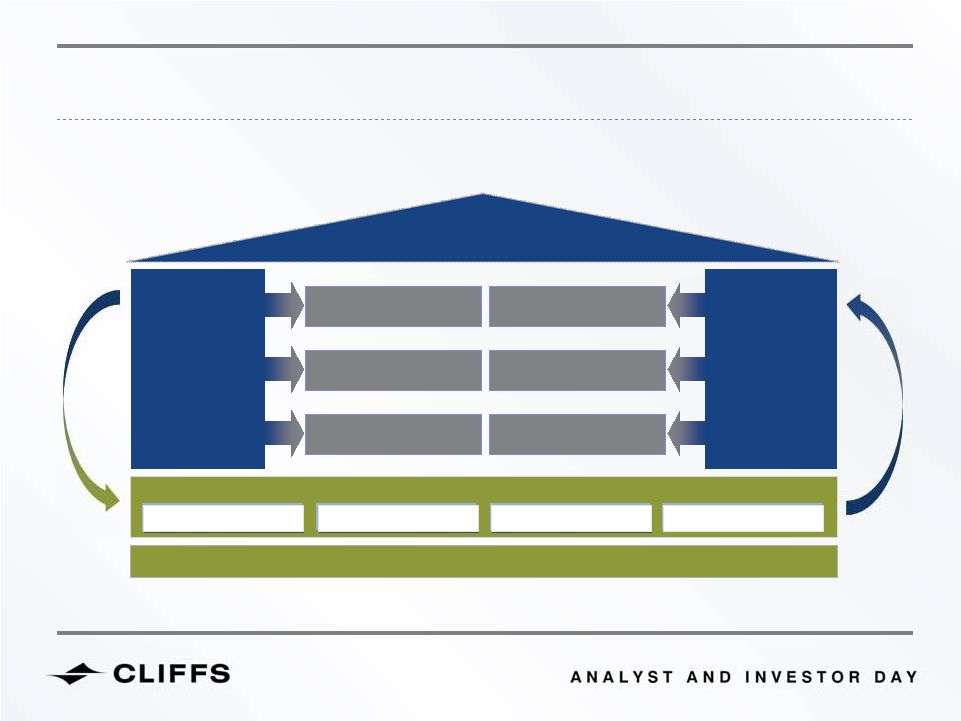
Building scale through diversification
Multiple Revenue Streams
Product Diversification
Geographic Presence
Operational excellence
Safety
Technical Competencies
Operating Efficiencies
Global execution
Competencies of the Firm
Outlook of Personnel
Global Scalability
Shareholder returns
Shareholder Value
Risk Management
“Earning the Right to Grow”
OUR STRATEGIC IMPERATIVES REMAIN THE SAME
8


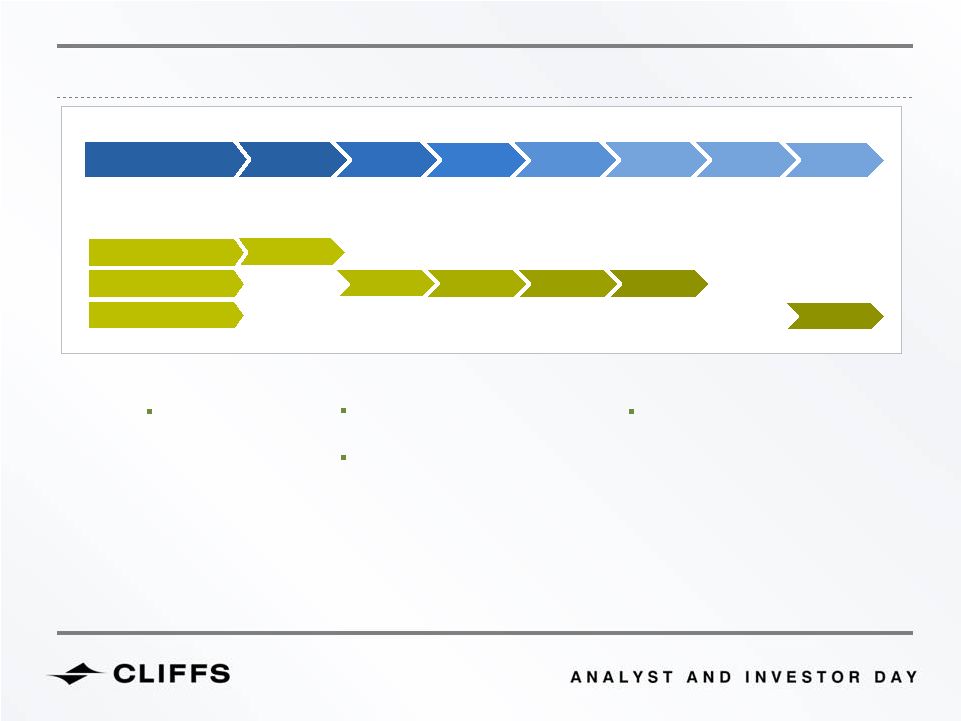
Portman I
1
2011 sales based on Cliffs’
Amapa
Sonoma
PinnOak
Portman II
United Taconite
Wabush
Freewest
& Spider
INR Energy’s
Coal Operations
Consolidated
Thompson
STRATEGY HAS RESULTED IN SIGNIFICANT GROWTH
2011E
2010
2009
2008
2007
2006
2005
Revenue:
$1.7 B
Revenue:
$1.9 B
Revenue:
$2.3 B
Revenue:
$3.6 B
Revenue:
$2.3 B
Revenue:
$4.7 B
Revenue:
$7.3 B
1
9
(in millions)
2011 outlook


Note: TSRs are from Dec 31, 2004 through Dec 31, 2010
SINCE 2004 CLIFFS HAS DELIVERED SIGNIFICANT SHAREHOLDER VALUE
10


CLIFFS’
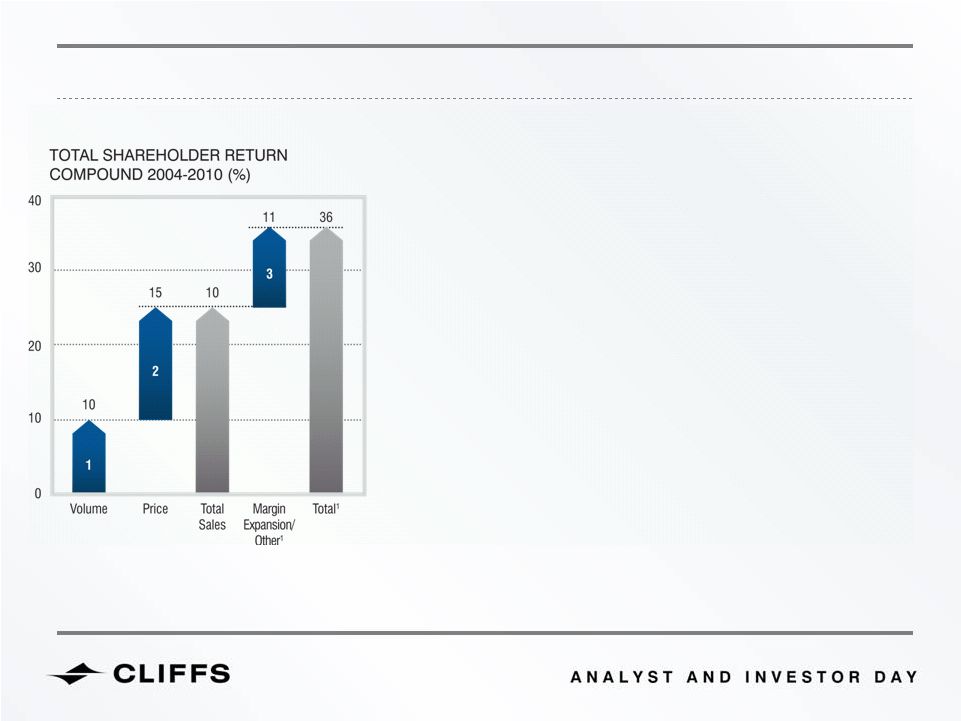
36% TSR WAS ACHIEVED THROUGH
STRONG EXECUTION OF STRATEGY
1. Volume
Volumes grew substantially, supported by strategic
diversifying acquisitions
2. Price
Proactively managing our price realization ensured we
could capitalize on strong industry demand
3. Margin Expansion
Aggressively managed costs
Net impact from other drivers reflects significant
investments to support growth, including debt and
share issuance
THREE KEY DRIVERS OF CLIFFS’
HISTORIC VALUE CREATION
11
   "Other" includes change in valuation multiple and cash contribution, including impact from net change in debt, dividends, and shares outstanding
Note: TSRs are from Dec 31, 2004 through Dec 31, 2010; all cross-product impact from volume and price attributed to price; totals may not sum due to rounding
 
1


Cliffs bought 80% of 
Portman in 2005, and
remaining 20% in 2008...
...Improved core
infrastructure throughout
our ownership...
Cliffs invested in infrastructure
to enable growth
Rail
Mobile Fleet
Resources
...And delivered
significant results
6
mtpa
9
mtpa
$4 Billion
PORTMAN ACQUISITION & EXPANSION
STRONG EXECUTION ESSENTIAL TO SUCCESS
1
Management’s estimate
12
1


A NUMBER OF HIGH-PRIORITY LEVERS THAT SUPPORT ORGANIC GROWTH
HAVE BEEN IDENTIFIED
Operational Excellence
Safety
Shareholder Returns
Cost Management
Talent Management
Business Improvement
Megatrends
Ferroalloys
Koolyanobbing
Expansion
Moving Toward
World Prices
North American Coal
Eastern Canada
Expansion
Exploration
Global
Execution
Building Scale
through
Diversification
Increasing Market Capitalization
13


GROWTH STRATEGY (MINERALS AND GEOGRAPHIES)
Integrate
Consolidated
Thompson’s
operations
2011 Focus
Execute
Delivery of various capital projects
Beyond 2011 gaining scale is important
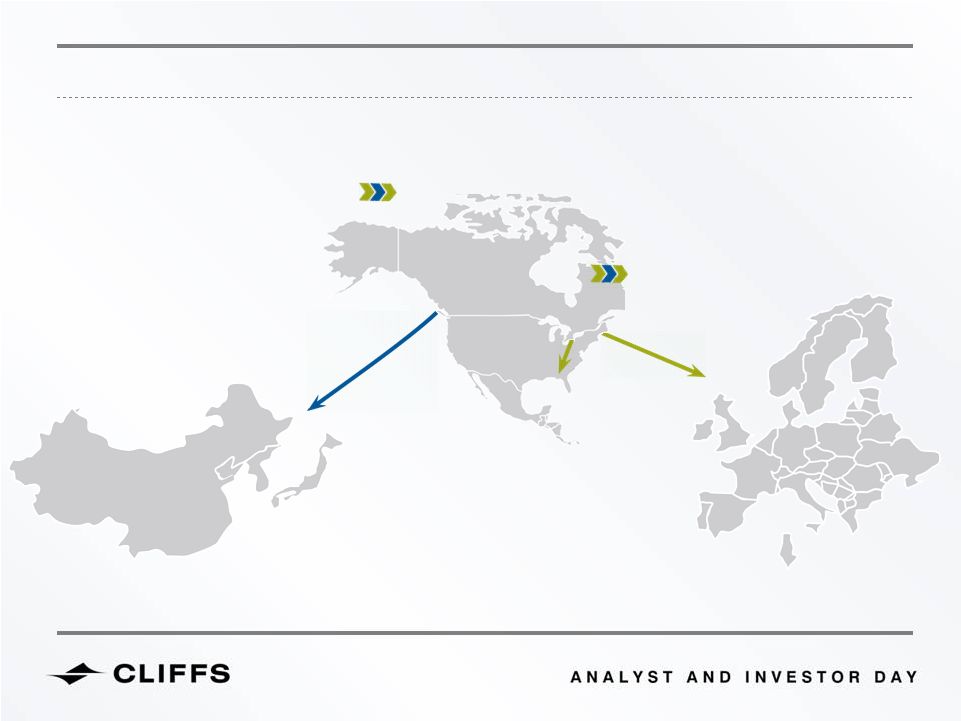
NORTH
AMERICA
ASIA PACIFIC
(AUSTRALIA)
SOUTH
AMERICA
(BRAZIL)
NORTH
AMERICAN
MET COAL
SEABORNE
IRON ORE
IRON ORE
SEABORNE
MET COAL
SEABORNE
FERROALLOYS
Cliffs’
Long-term
Acquisition
Strategy
Remains
Intact
Minerals
Geographies
14


LOOKING FORWARD, WE WILL CONTINUE PURSUING OUR HISTORIC STRATEGY
SUPPORTED BY FUNDAMENTAL BELIEFS
Our reasons for the chosen strategy have been consistent over the past
several years
Guided by our understanding of the external environment (Megatrends)
Informed by Cliffs’
competitive position and capabilities
Beliefs
With growing demand (BRIC economies) and increasing supply constraints
(regulatory, cost), the mining sector represents outstanding return potential
Significant scale is both achievable and necessary
15


Source: Cliffs Natural Resources; World Steel Organization; The World Bank; World Steel Association
Note: India comprises 4% of total steel consumption in 2010
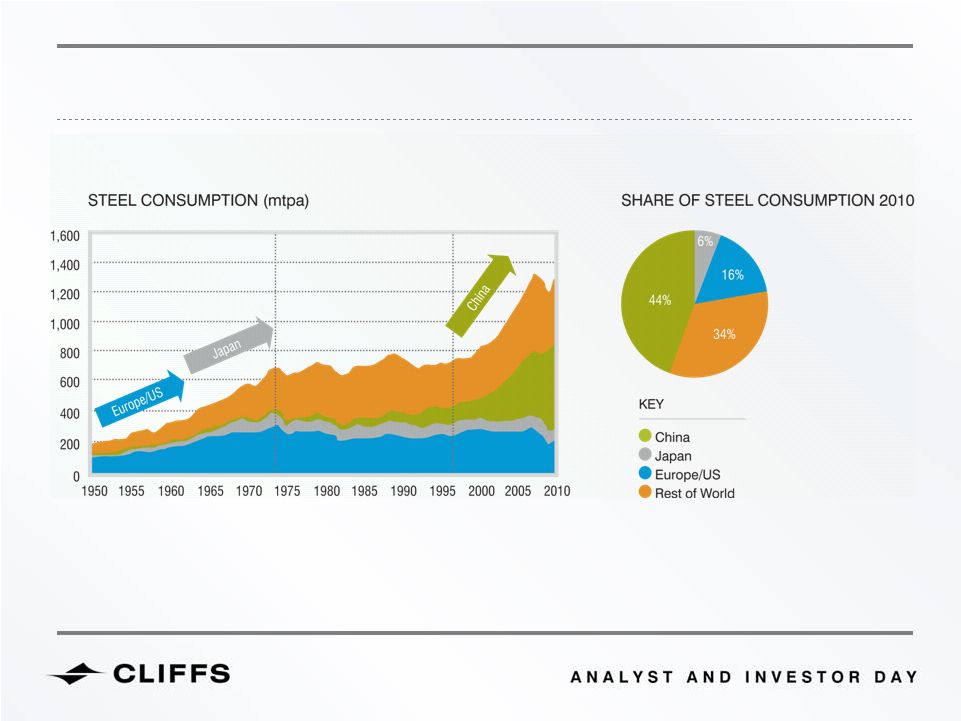
EMERGENCE OF JAPAN AND CHINA HAVE DRIVEN GLOBAL STEEL CONSUMPTION
GROWTH SINCE THE 1960s
16


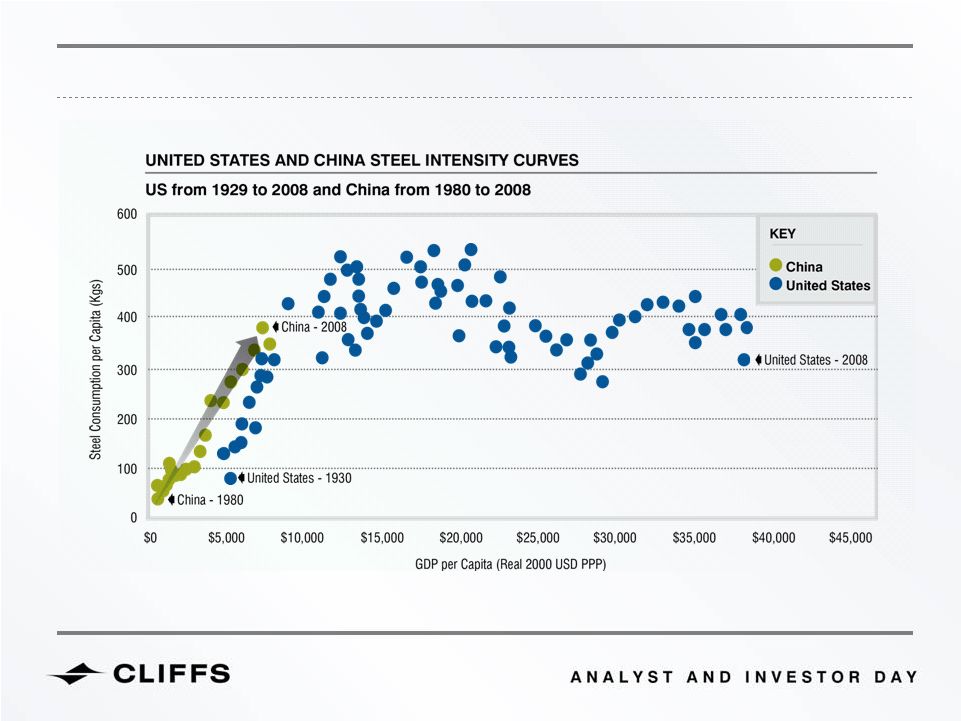
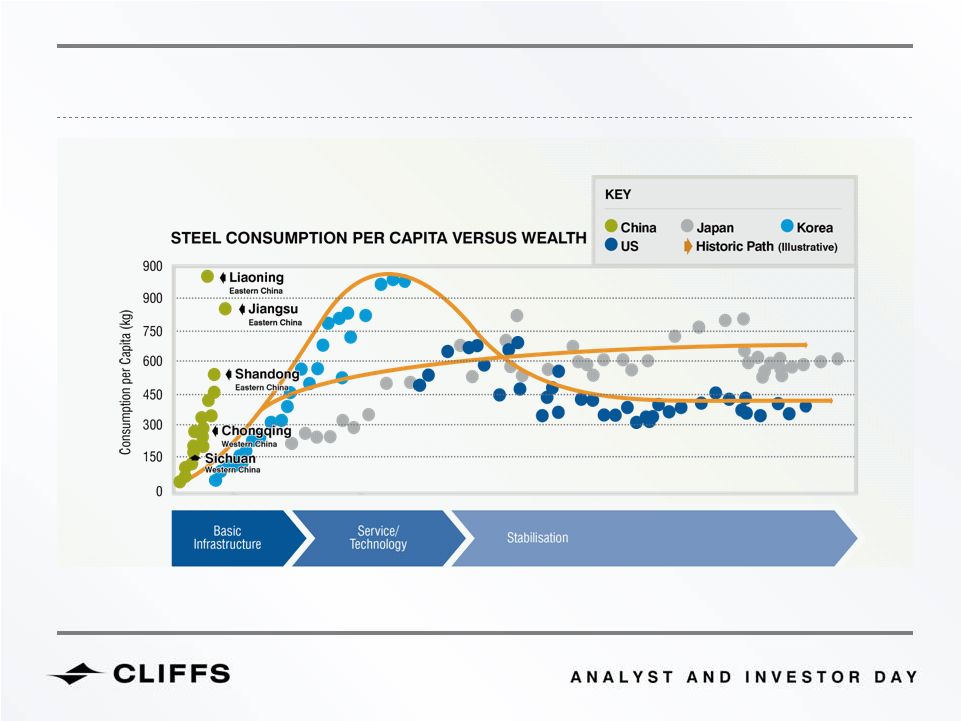
US AND CHINA: STEEL INTENSITY CURVES
Source: Bloomberg, Worldsteel, IMF, USGS
17
Although China has recently experienced strong growth in steel consumption, there is still potential for further growth.


STEEL INTENSITY IS CLOSELY RELATED TO STAGE OF ECONOMIC
DEVELOPMENT AND INCOME LEVELS
Source: VCI Analysis; International Iron & Steel Institute; McKinsey; Rio Tinto; World Bank; “China Steel Outlook”; Citigroup;
Deutsche Bank Research. Note: China regional consumption estimates are based on 2008 data
18


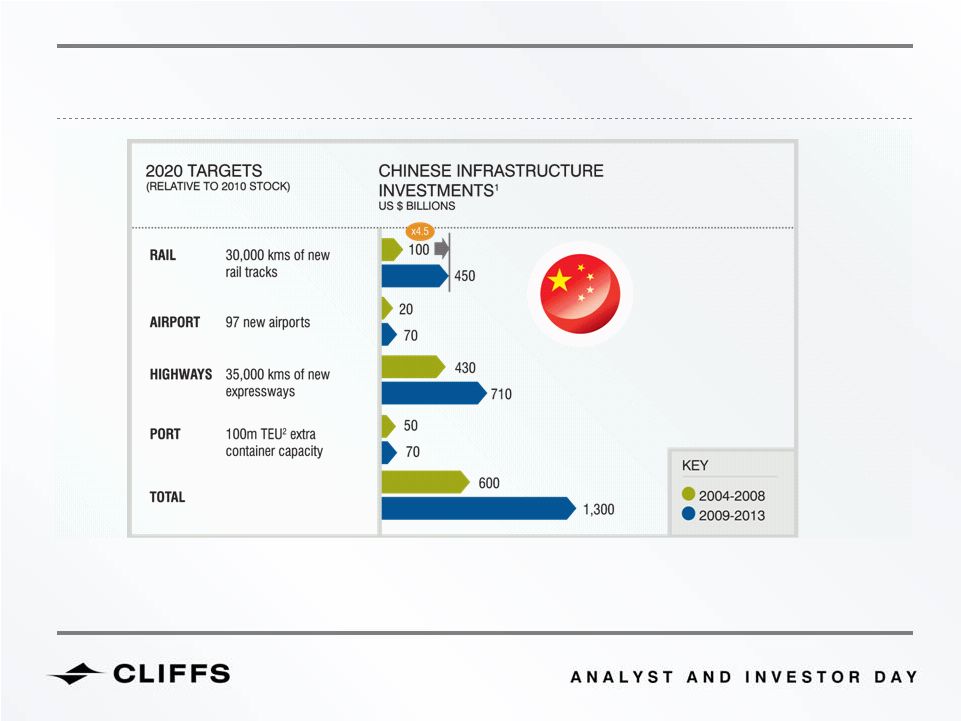
GROWING INFRASTRUCTURE CONGESTION: CHINA IS EXPECTED TO
DRAMATICALLY EXPAND ITS INFRASTRUCTURE
Source:  McKinsey & Company
1
Key assumptions for 2009-2013: 1) Rail and airport are estimated with central gov’t source as it is centrally planned; 2) Highway 2009-2010 is estimated with
provincial gov’t source and 2011-2013 central gov’t source (lack of provincial source); 3) Port is estimated from central source due to lack of provincial estimates
19
2
Twenty-foot-container equivalent unit


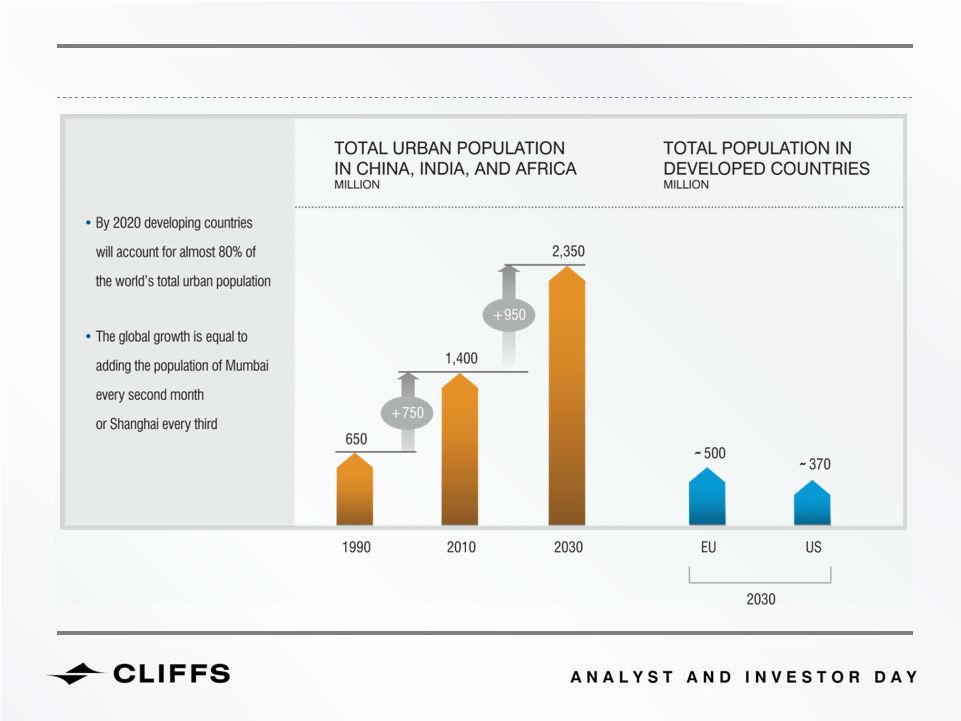
Source:  McKinsey & Company
20
THE URBANIZATION IN CHINA, INDIA AND AFRICA IS OF UNPRECEDENTED SCALE


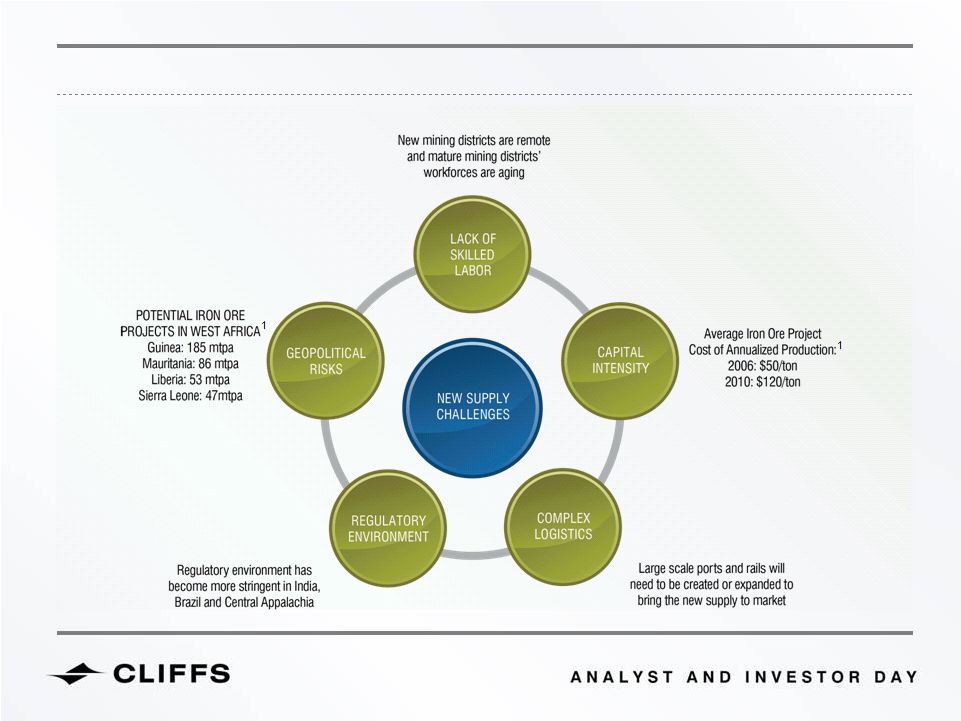
NEW SUPPLY CHALLENGES
The barriers to entry are becoming higher as new supply is more challenging to bring into production
1
Source: Macquarie
21


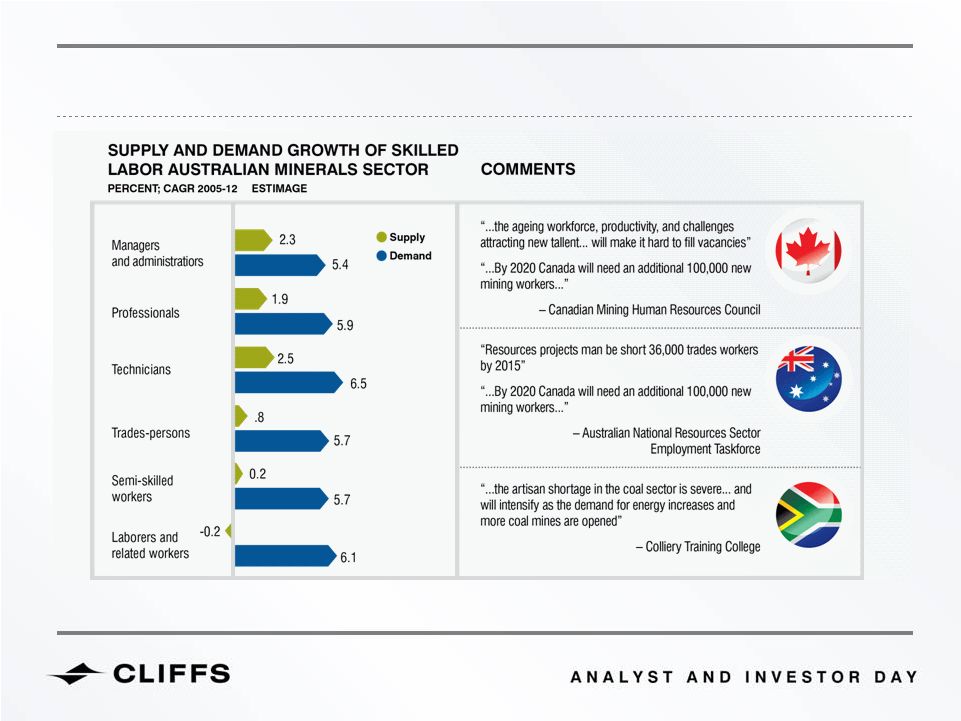
THERE IS A GROWING DEFICIT OF SKILLED LABOR IN THE MINING
INDUSTRY GLOBALLY
Source: Staffing the Supercycle: Labor Force Outlook in the Minerals Sector, 2005-2015 (Minerals Council of Australia); Canadian Mining Human Resources
Council; McKinsey analysis
22


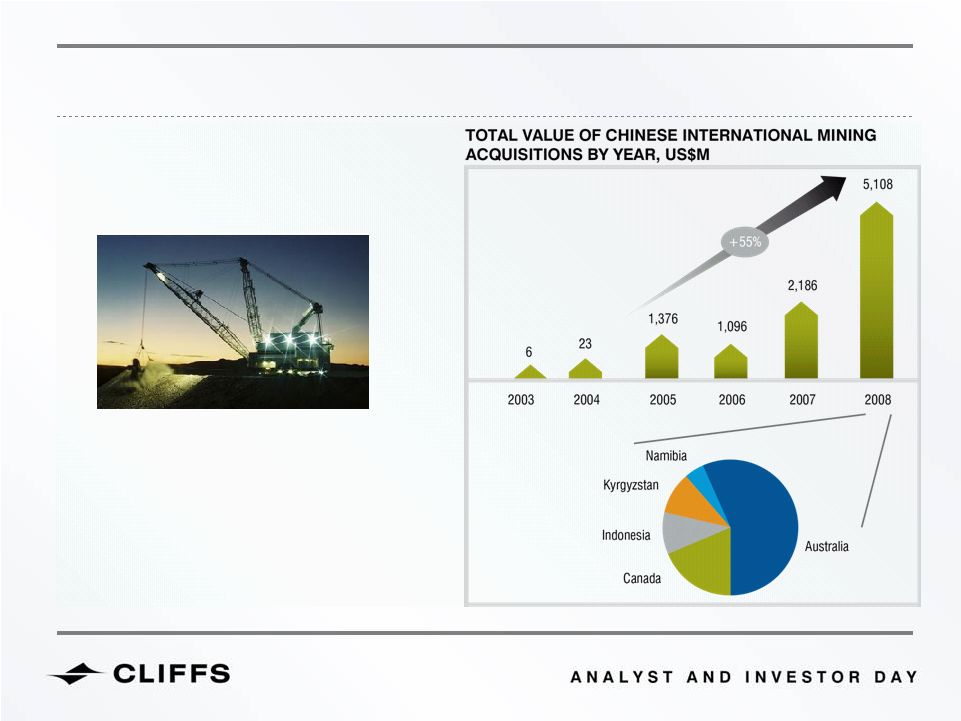
AS RESOURCES ARE BECOMING MORE SCARCE, GOVERNMENTS ARE PLAYING
A MORE ACTIVE ROLE
Governments are increasingly trying to
reap benefits from domestic assets
(Reuters) –
Australia’s government
angered its booming resources sector
on Sunday by unveiling a new tax on
mining projects from July 2012 under
a sweeping pre-election tax overhaul
which will also boost pension savings
for workers.
5
10
10
19
57
Australia unveils mining tax
By James Grubel
CANBERRA | Sun May 2, 2010 4:24am EDT
Source: Dealogic, RMG
23


DECLINING ORE GRADES AND THINNER SEAM THICKNESSES
We believe declining ore grades will be a new challenge for mining companies
looking ahead
With the consolidation of the Chinese steel industry on the horizon, it is likely
newer blast furnaces will be larger and more efficient, which will require a
higher quality of ore
Developed coal basins around the world are experiencing thinner seam
thicknesses,
making
mining
challenging
and
requiring
significant
capital
As
metallurgical
coal
prices
remain
high,
the
premium
for
higher
quality
of
iron
ore is more desired
24


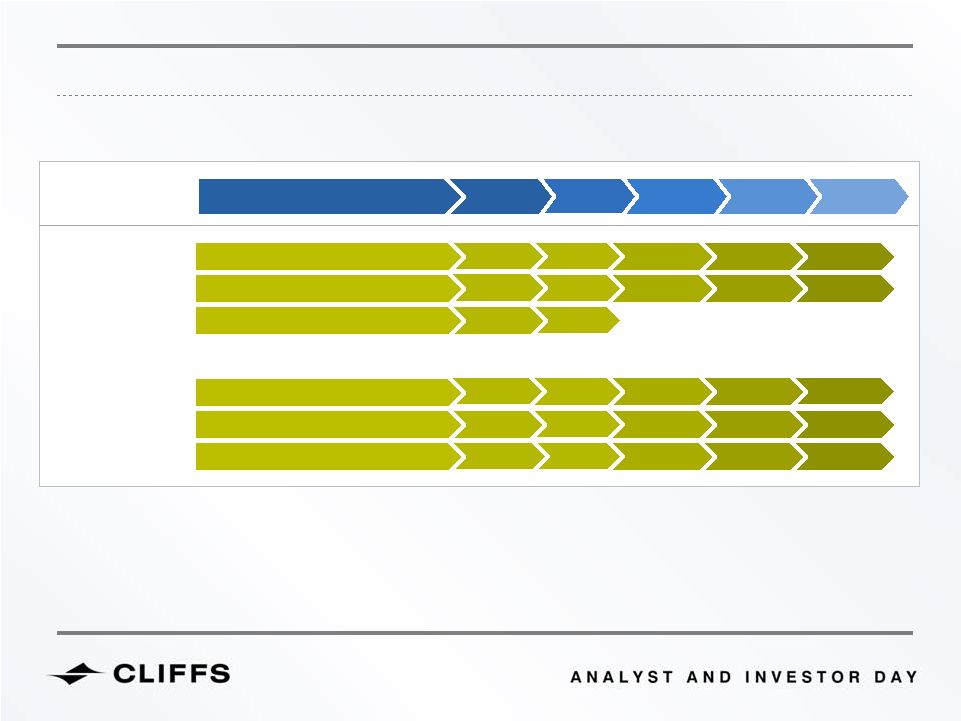
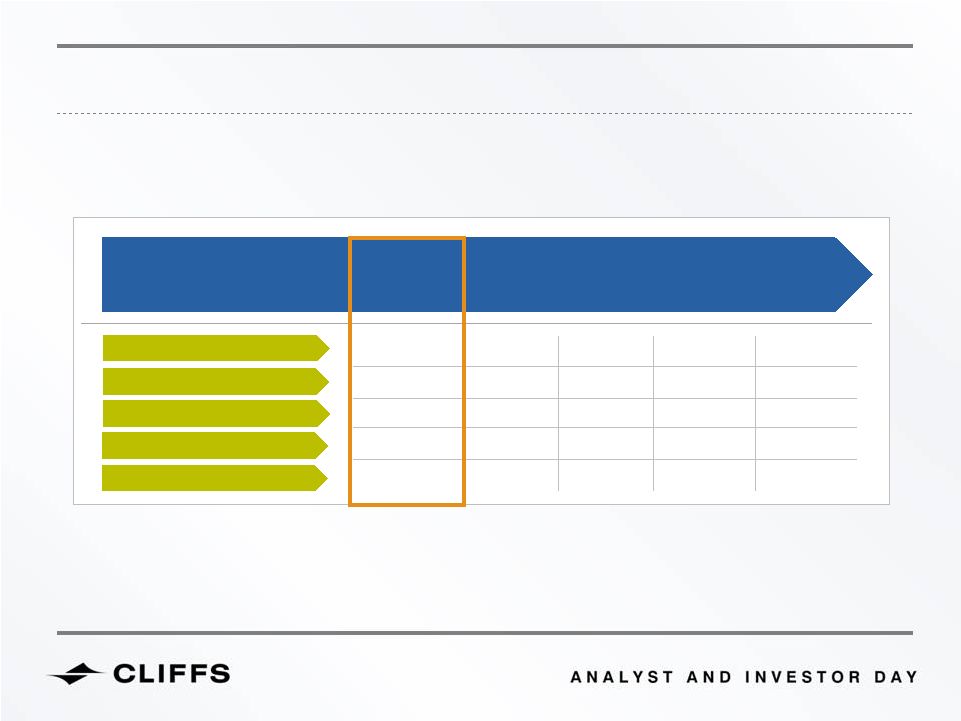
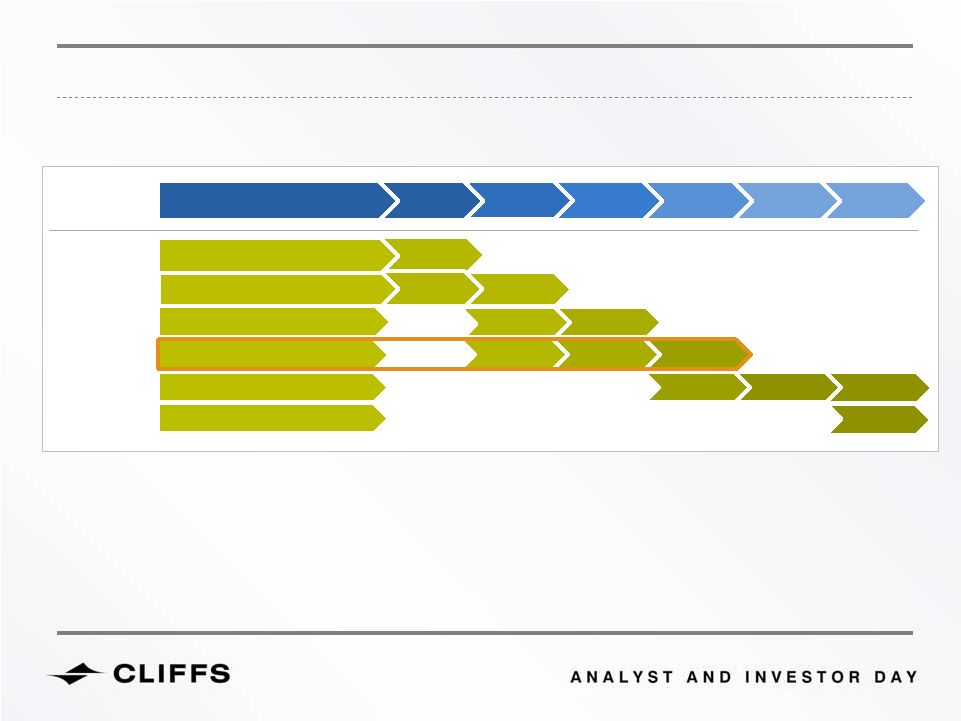
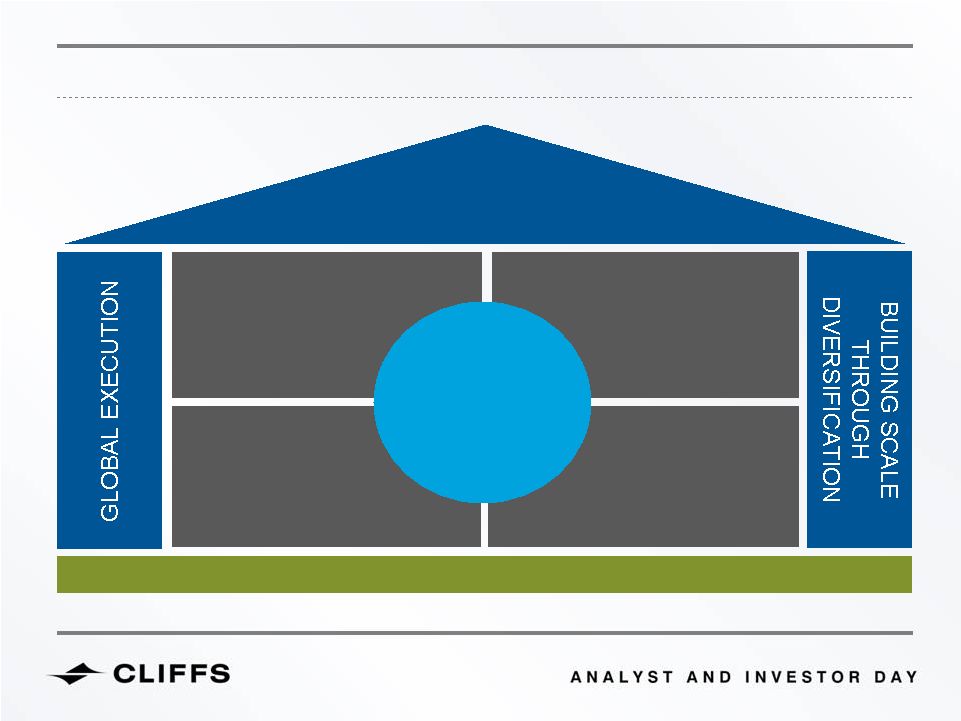
CLIFFS’
PIPELINE OF ORGANIC GROWTH
2011
2012
2013
2014
2015
GLOBAL
EXECUTION
BUILDING SCALE
THROUGH
DIVERSIFICATION
Moving Towards World Prices
Coal Expansion
APIO Expansion
Eastern Canada Expansion
Ferroalloys
Exploration
25


Don Gallagher
Bill Hart
Terry Mee
CLIFFS NATURAL RESOURCES INC.
GLOBAL MARKETING
26


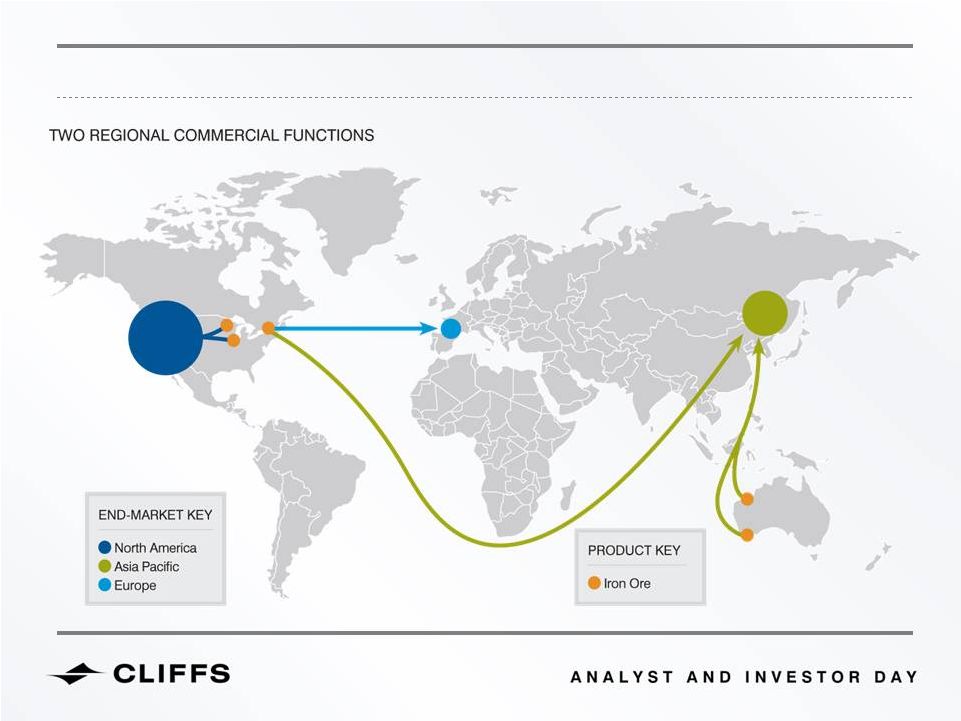
OUR GLOBAL COMMERCIAL FOCUS
Sustained demand growth
Chinese urbanization and government policy
Indian growth
Tight global supply
Dependent upon capital availability, pricing
perceptions, inflation risks, sovereign risks
High-quality iron ore production
Cliffs has a strong quality advantage
Strategic marketing capabilities
Deep customer insight and targeting
Maximizing value for shareholders
Leverage our competitive advantage
MAXIMIZING
VALUE FOR
SHAREHOLDERS
TIGHT
GLOBAL
SUPPLY
STRATEGIC
MARKETING
CAPABILITIES
HIGH
QUALITY
PRODUCTS
27
SUSTAINED
DEMAND
GROWTH


CLIFFS’
HISTORIC PRODUCT FLOW 2005
1mt
20mt
5.9mt
28


CLIFFS’
FORECASTED PRODUCT FLOW 2013
26mt
33mt
2mt
2mt
2mt
2mt
3mt
29


EXAMPLE
OF
CHINESE
URBANIZATION
-
SHANGHAI
Shanghai -
1990
Shanghai -
2010
30


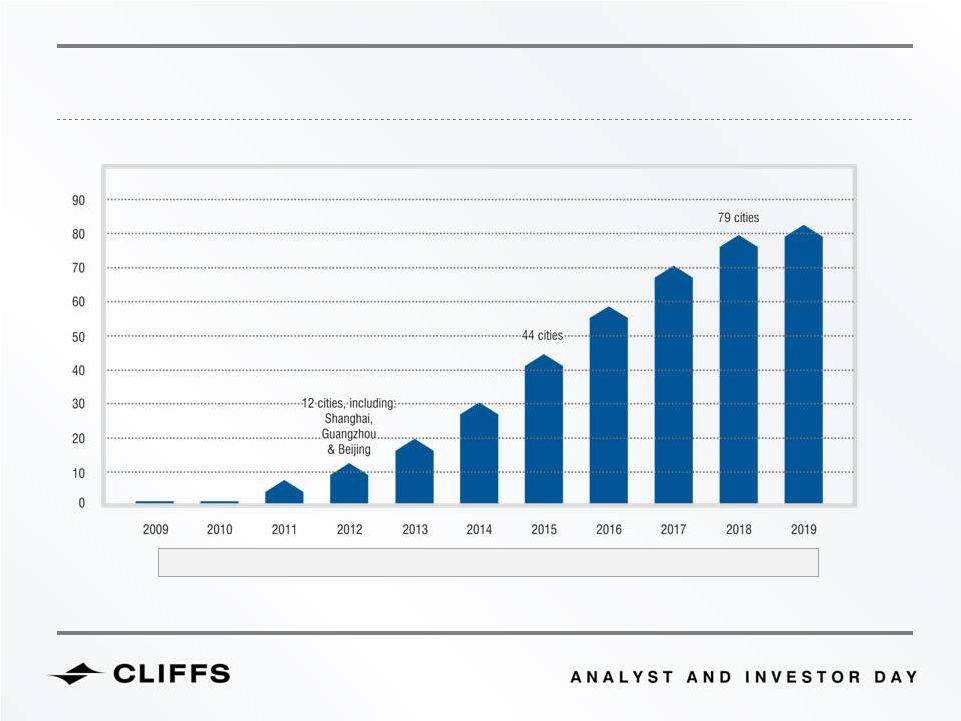
CHINESE URBANIZATION WILL CONTINUE TO DRIVE STEEL
CONSUMPTION GROWTH
Source:
EIU;
“Putting
BRIC
growth
in
perspective,
Worldpress
Note: US$4,600 equivalent to RMB30,000
140
cities
with
1m
or
more
people
currently.
Number
is
expected
to
grow
to
235
cities
by
2025.
NUMBER OF CITIES IN CHINA WITH AVERAGE DISPOSABLE INCOME OVER US$4,600
31


Source: “The Confessions and Concerns Of A China Bull, Urandaline Investments; Andy Stoeckel, former Head of the Australian
Bureau of Agricultural and Resource Economics; People’s Daily Online, February 2010
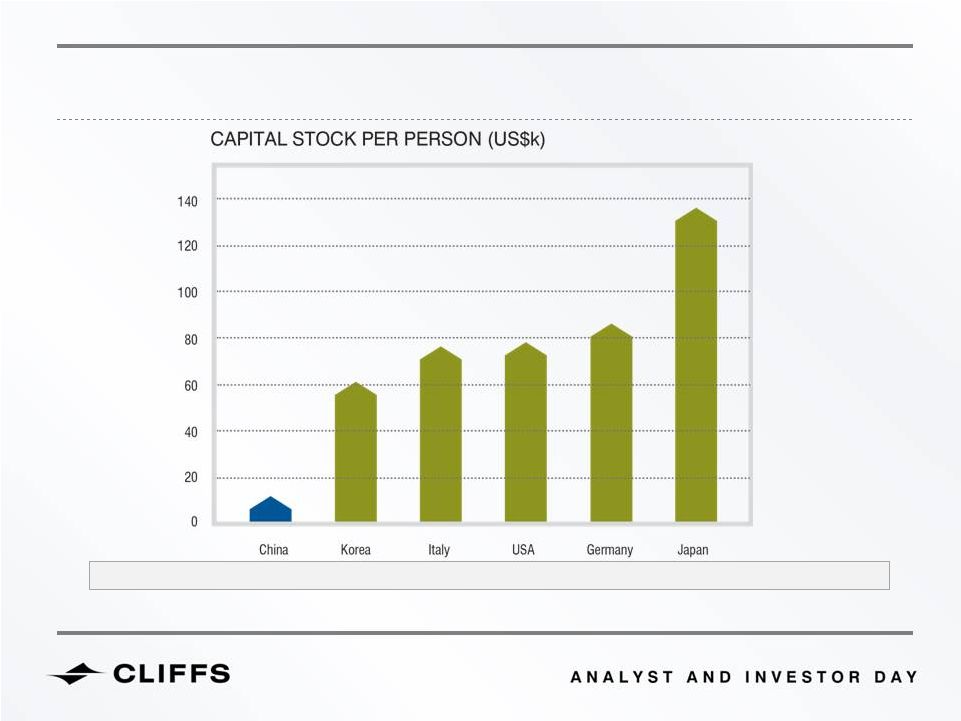
Reaching developed world capital stock levels would drive an immense increase in Chinese steel consumption.
CHINESE CAPITAL STOCK IS STILL VERY LOW BY GLOBAL STANDARDS,
PROVIDING SIGNIFICANT GROWTH UPSIDE
32


Source: The World Bank; UN World Population Prospects
Note:
T
0
=
1978
for
China,
1991
for
India
based
on
assumed
start
of
modern
“reformed”
period
(see
Morgan
Stanley
2010)
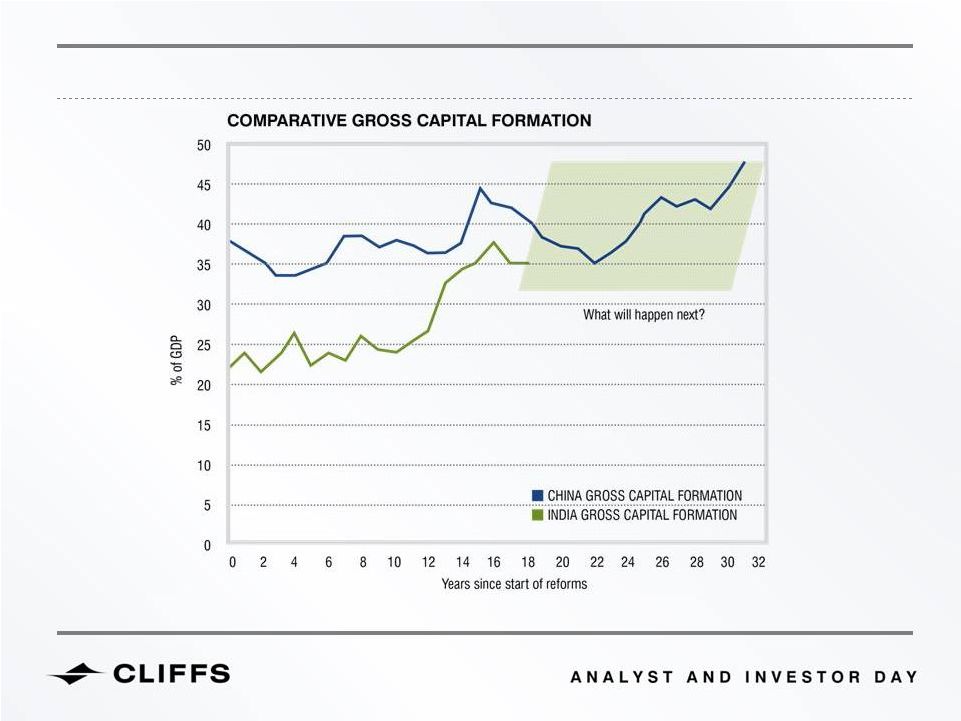
INDIA’S DEMAND GROWTH CORRELATES CLOSELY TO CHINESE GROWTH TO DATE
1978
1991
2009
2009
33


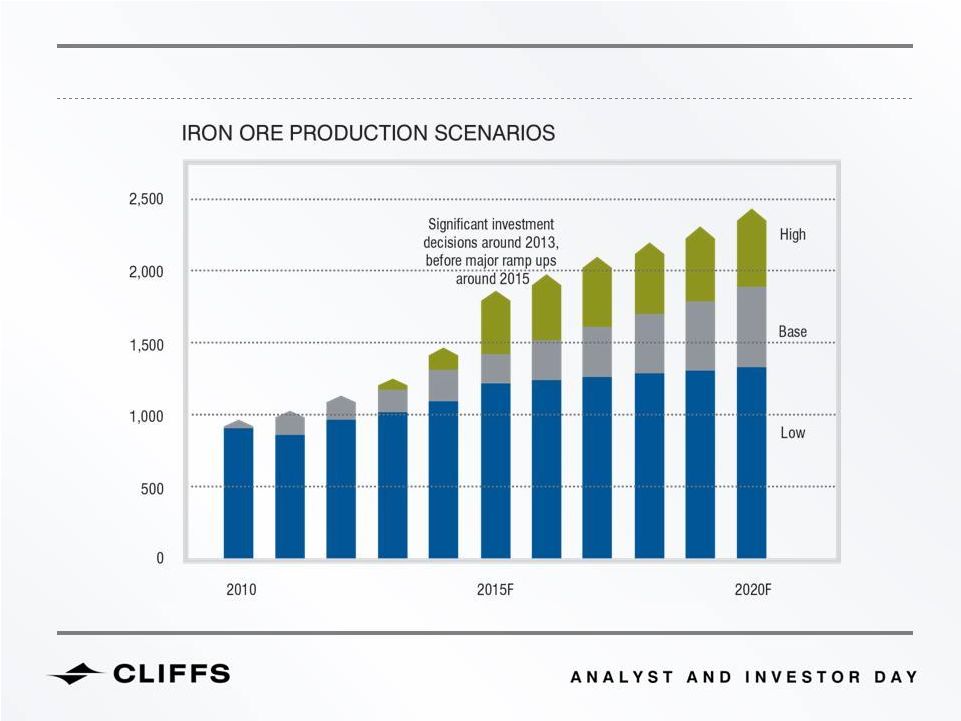
CAPACITY EXPANSIONS ARE UNLIKELY TO BE DELIVERED ON TIME OR ON BUDGET
34
Source: Cliffs Natural Resources; AME; Company announcements and data; “African Iron Ore Supply: Potential For New Projects”, RBC Capital Markets;
Engineering and Mining Journal.


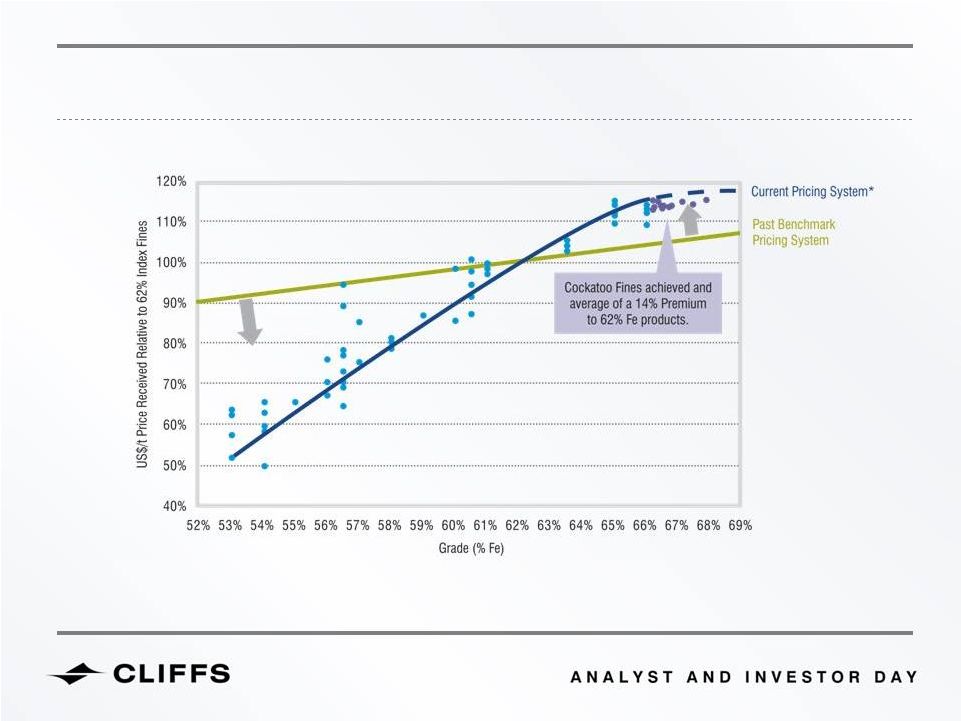
HIGHER-QUALITY IRON ORE IS ATTRACTING AN INCREASED PREMIUM OVER
LOWER QUALITY
35
Source: Cliffs Natural Resources; “Australian Iron and Steel Review”, Credit Suisse; 4 months of daily spot trade data (Platts)
Note: *Based on a trend line for actual spot


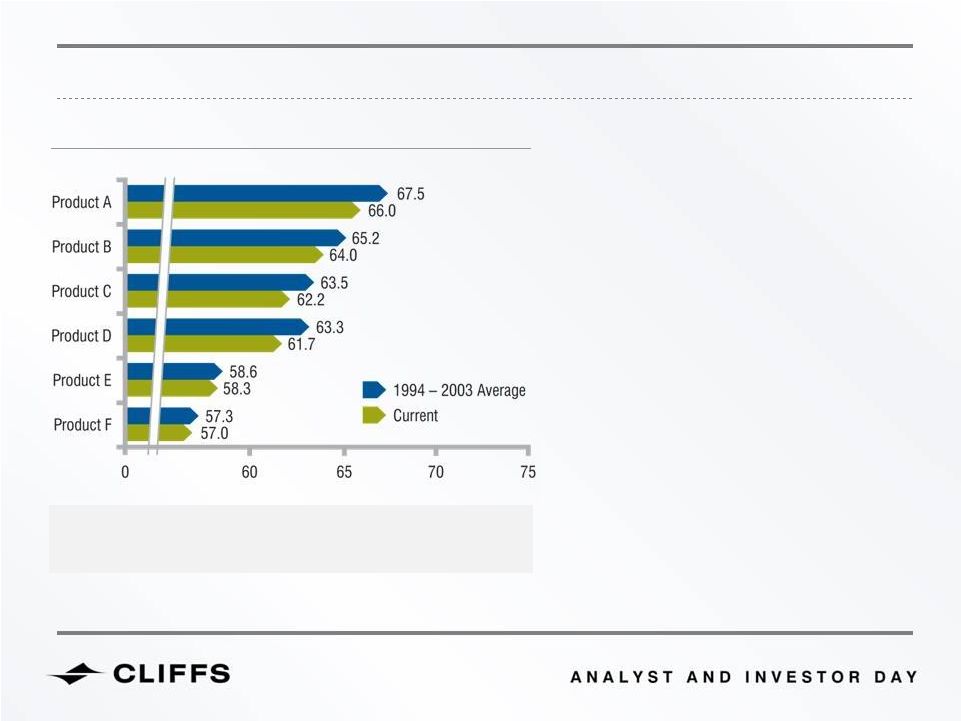
IRON ORE QUALITY TRADED BY MAJOR PRODUCERS IS TRENDING LOWER
Quality was exceptionally stable between 1994 and 2003. 
Recent declines are likely driven by no availability of quality and
“ship anything”
response.
CONTAINED IRON BY PRODUCT (%Fe)
Ongoing quality declines increase
production requirements and
worsen environmental footprint
Volume required to maintain Fe units
1% reduction in quality every 5 years
implies additional 200mt of seaborne ore
required between 2012 and 2020*
Higher volumes of met coal required to process
lower  grade material and CO
2
emissions per
steel ton increase
Appropriate quality lump likely to be increasingly
scarce. Coupled with broader quality pressures
puts upwards demand pressure on pellets
Falling average quality provides favorable
environment for high-quality pellet producers
36
Source: Cliffs Analysis for current quality; Tex reports for 1994-2003 (excludes 1999)
Note: * Based on “Base Case” cumulative seaborne demand of 15.3bt and 62% contained Fe starting point in 2010


HIGH-QUALITY IRON ORE PRODUCER IN A MARKET OF DECREASING QUALITY
Source: Cliffs Analysis
Note: Steelmaker inputs are pre-sinter
Relative Quality of Iron Ore Producers
64
63
62
61
60
59
58
57
56
55
54
53
52
Grade
(% Fe)
66
65
67
68
Robe
Yandi
FMG
PBF
Koolyanobbing
Mt N
Vale
IOC
Cockatoo
Wabush
Ore
Producers
Increasing demand for quality
CLF US
Mines
Steel
Mills
Bloom Lake
CLF US
Mines
Standard Pellet
Value-Added
Flux Pellet
Decreasing
quality of supply
37


Source: VCI Analysis
Note: Analysis is illustrative only
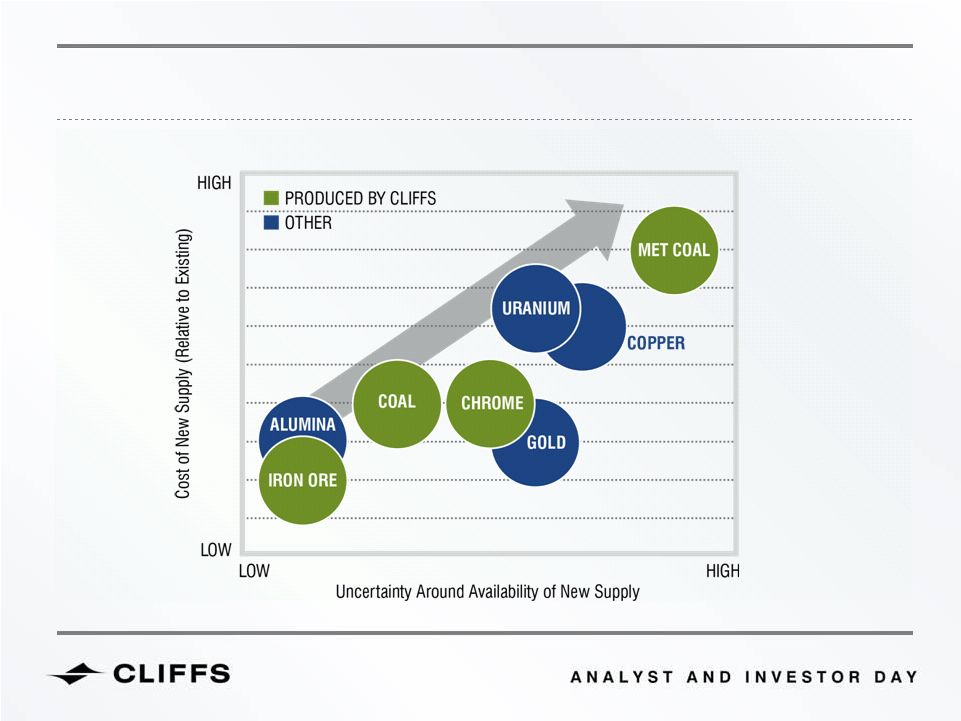
METALLURGICAL COAL PRICES CAN BE EXPECTED TO INCREASE FURTHER
GIVEN RELATIVE COST OF NEW SUPPLY
AVAILABILITY AND COST OF NEW COMMODITY SUPPLY
38


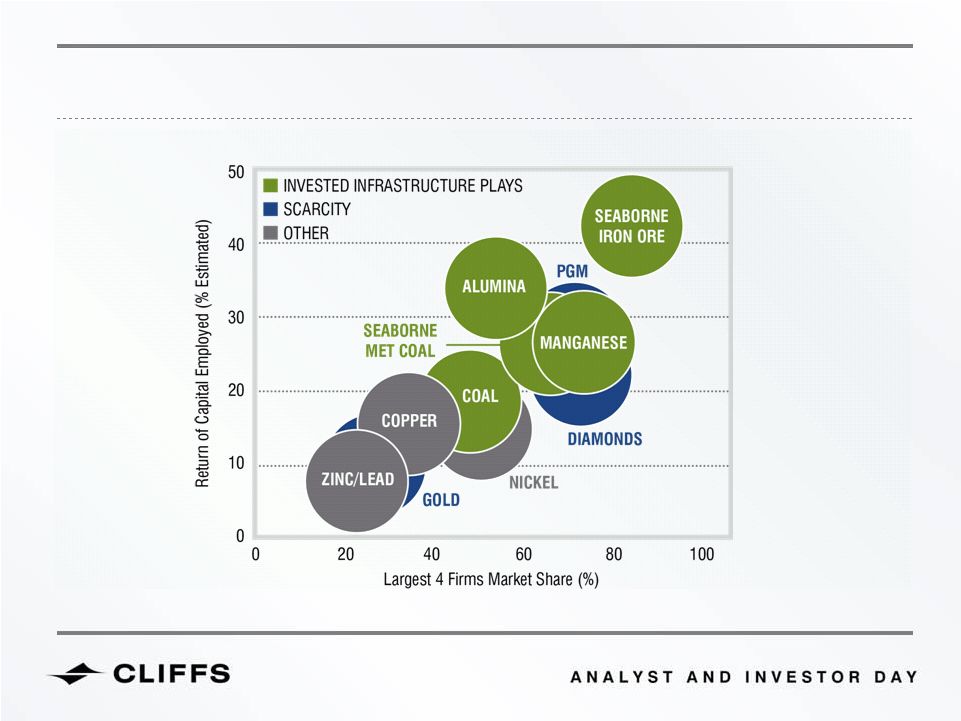
SEABORNE METALLURGICAL COAL HAS A FAVORABLE INDUSTRY
STRUCTURE WHICH HELPS DRIVE STRONG RETURNS
Source: VCI Analysis; Citigroup; BMA; BHP Billiton; McKinsey; Cliffs Natural Resources
Note: Estimated ROCE for 15 years to 2003 based on publicly available data, Manganese is based on a weighted average of sources ranging from 5 to 10 years
COMMODITY MARKET RETURNS AND CONSOLIDATION
39


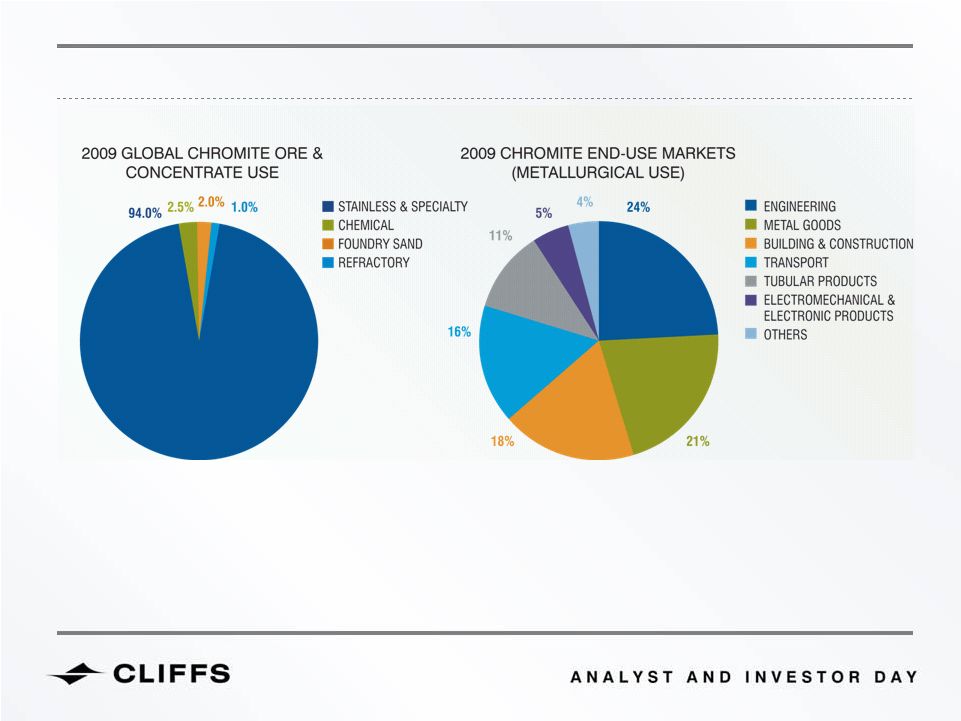
STAINLESS STEEL DRIVES CHROMITE AND FeCr MARKETS
Source: Heinz Pariser
40


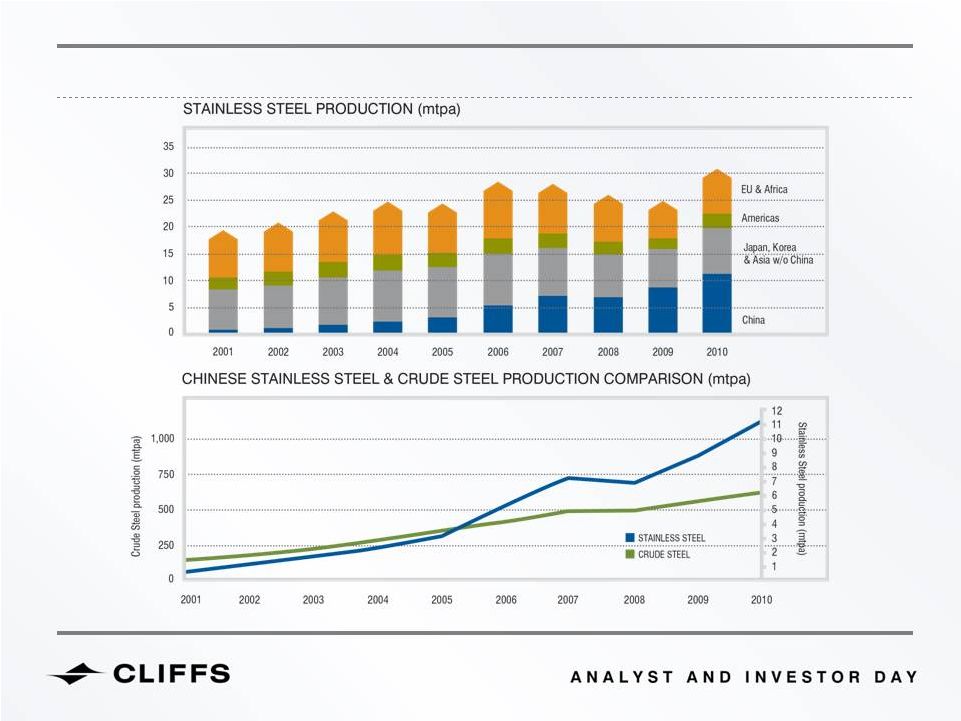
Source: Cliffs Analysis
STAINLESS EXCEEDING CARBON STEEL GROWTH AND CHINA IS THE DRIVER
41


42
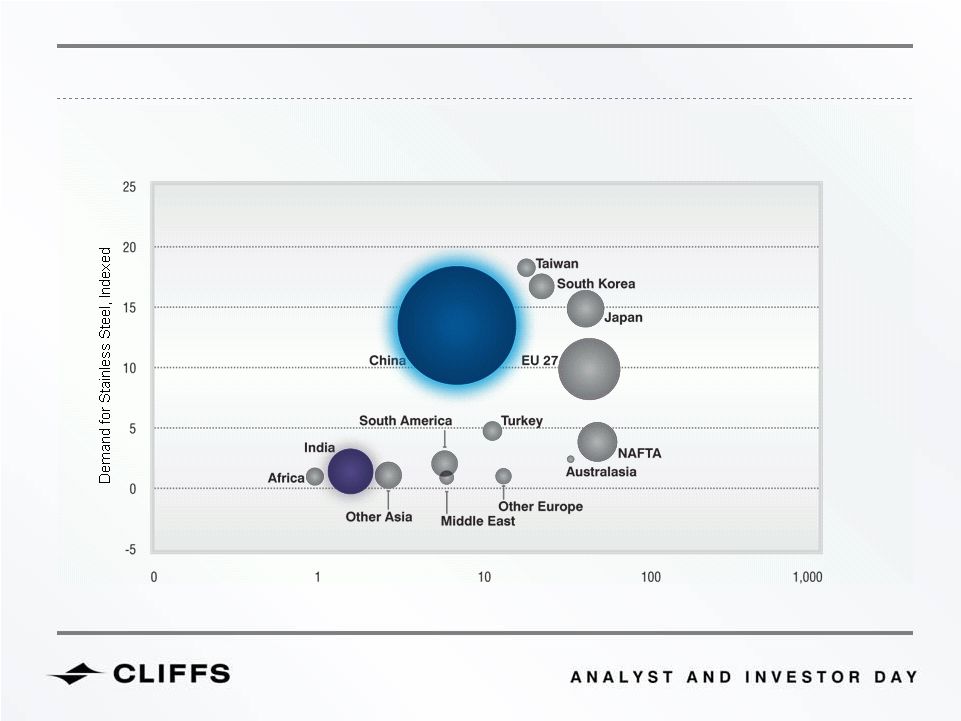
MARKET METRICS
GDP per Capita, Indexed
A MATURING CHINESE ECONOMY WILL CONTINUE TO DEMAND
INCREASING AMOUNTS OF CHROMITE
Source: Heinz Pariser
42
42


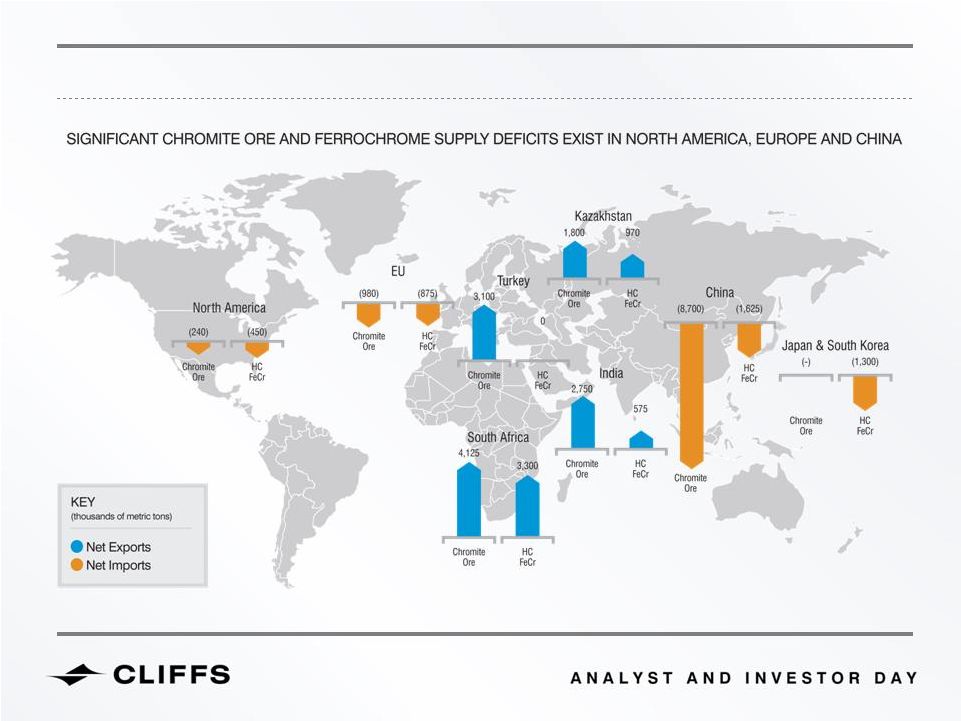
2010 CHROMITE ORE AND FERROCHROME PRODUCTION AND CONSUMPTION
Note: Map above excludes production and consumption from ROW
Source: Metal Bulletin, Heinz Pariser
43


TARGET LIST
TOP 20
GO, NO-GO
DECISIONS
DETAILED
ASSESSMENT
PURSUE
DEVELOP
TARGET LIST
1. PRIORITIZATION MODEL
2. INTERNAL ASSESSMENT
3. CUSTOMER VISITS
Top 100 mills in China
Key mills in Japan & Korea
Technical models
Commercial models
Strategic synergies
Site visits
Contract performance
Strategic location
CLIFFS IS TARGETING SALES USING A COMPREHENSIVE TECHNICAL,
COMMERCIAL AND STRATEGIC PROCESS
44


CLIFFS’
SALES & MARKETING PROCESS IS DELIVERING POSITIVE
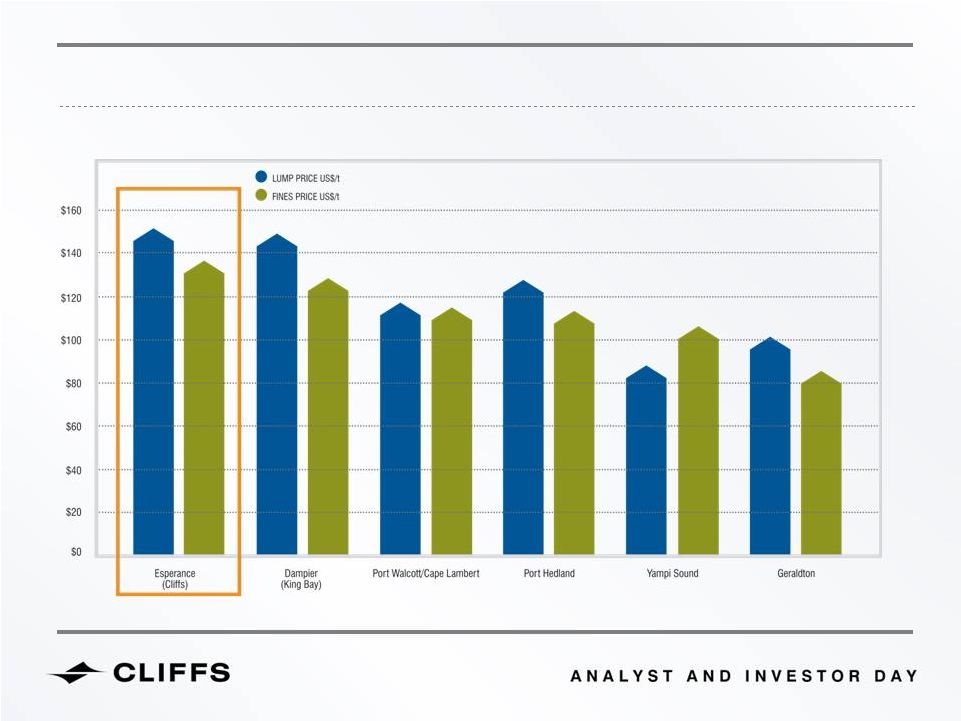
PRICING OUTCOMES
Source:  Cliffs analysis, ABS
2010 ASIA PACIFIC IRON ORE
45


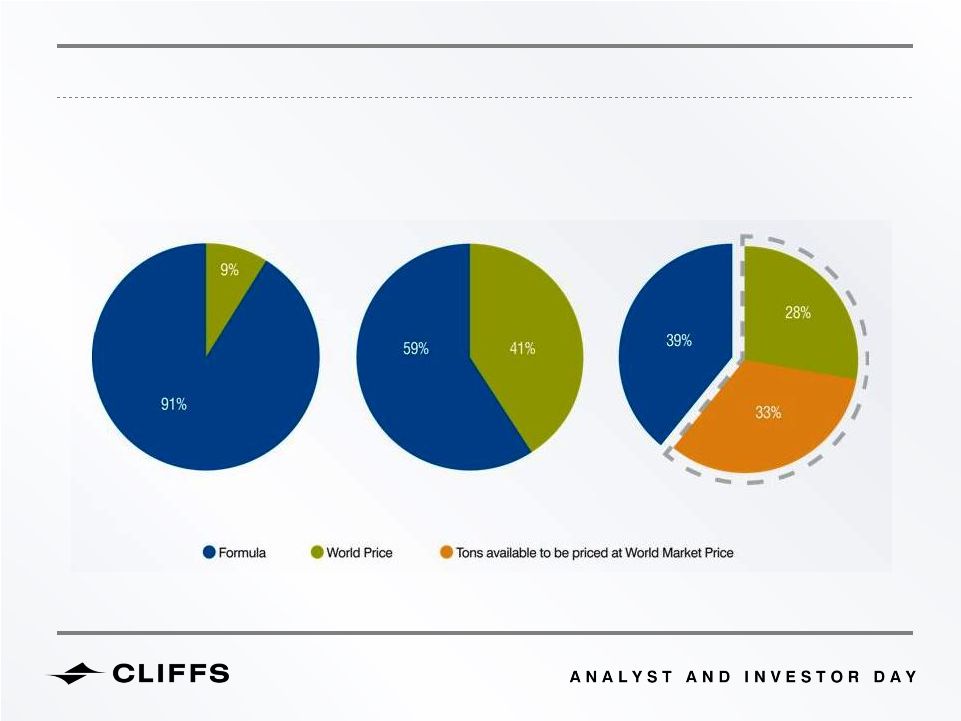
MOVING NORTH AMERICAN IRON ORE CONTRACTS TO WORLD MARKET PRICING
Analysis of North American Iron Ore legacy contracts shows opportunity to achieve World Market Pricing
23 million tons
29 million tons
29 million tons
2008
2011E
2014E
46
1
1
Assumes current production capacity of 29.5 million long tons and excludes Eastern Canada concentrate from Cliffs’ Bloom Lake Mine


Dave Blake
CLIFFS NATURAL RESOURCES INC.
EASTERN CANADA
INTEGRATION & EXPANSION
47


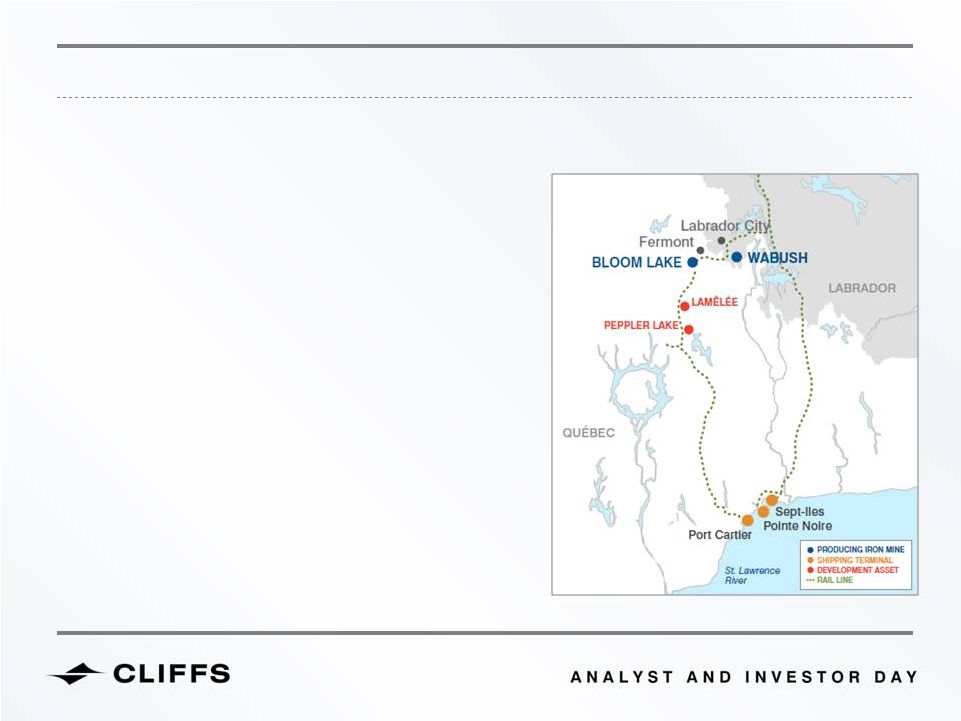
BLOOM LAKE OPERATIONS
Established access to Asian markets
Excellent infrastructure with power, rail and port
access capable of supporting growth profile
Attractive development opportunities at Lamêlée
and Peppler Lake
Low-cost production
A WORLD-CLASS MINING OPERATION
48


BLOOM LAKE OPERATIONS
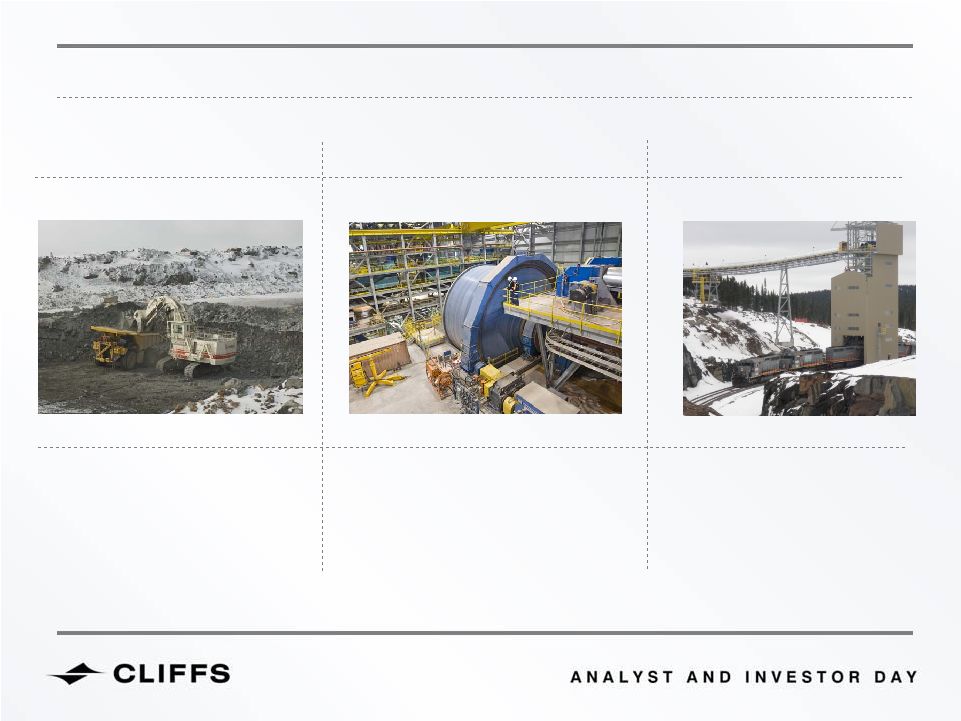
Mining
Processing
Logistics
Open pit
Drill and blast
Load and haul
Primary crushing
Grinding
Screening
Spiral classification
Filter de-watering
Eastern Canada location
Load-out facility
Additional rail capacity
Adjacent port at Sept-Îles
49


BLOOM LAKE INTEGRATION OVERVIEW
Secured key operations management responsible for ramp up and expansion
Back office (accounting, IT, HR and brand) integration well underway
Attraction
and
retention
of
skilled
employees
over
7,000
applications
currently
on file
Continue Bloom Lake’s best practices around employee engagement
Maintain competitive compensation and “pay for performance”
Continue active community, government and First Nations relations programs
50


APPLICATION OF THEORY OF CONSTRAINTS
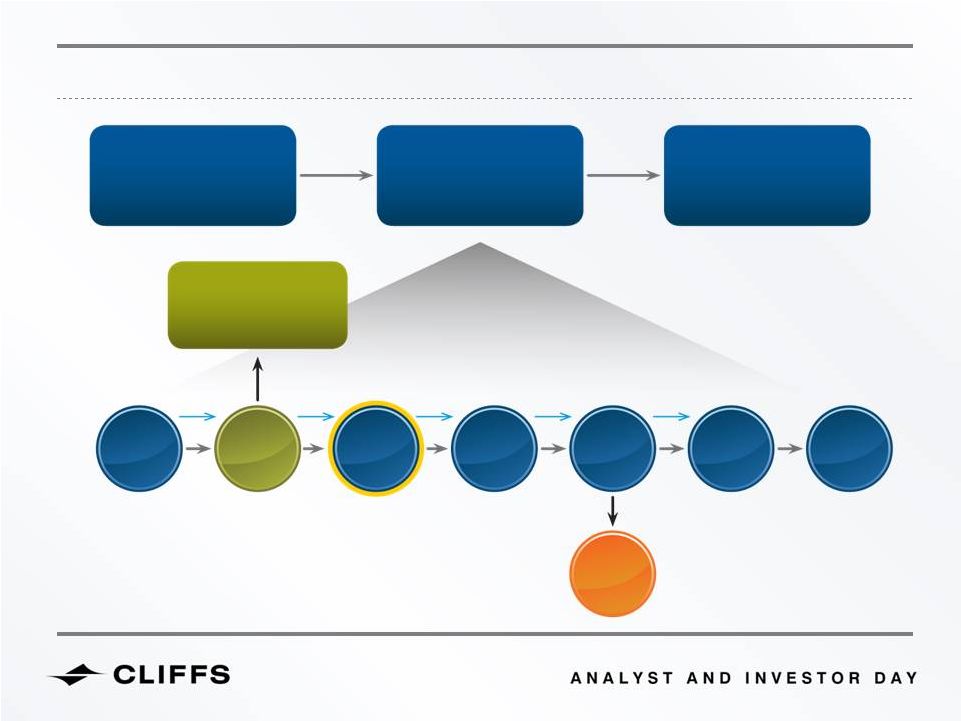
MINE
CONCENTRATOR
LOGISTICS
BUFFER
MANAGEMENT
CRUSHER
STOCKPILE
AG MILL
Subordinate
Subordinate
Exploit
SCREEN
SPIRALS
FILTERS
SILO
TAILINGS
51


RESULTS OF IMPROVED OPERATIONAL PARAMETERS
2011 MONTHLY CONCENTRATE PRODUCTION
(IN THOUSANDS OF METRIC TONS)
52


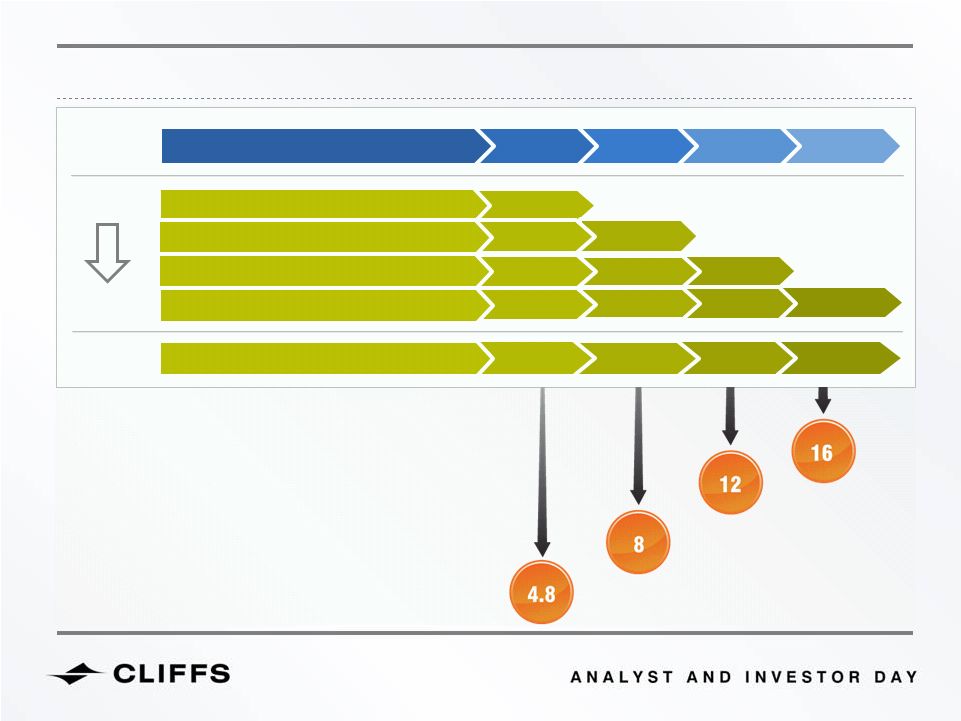
BLOOM LAKE PHASE II EXPANSION -
16 MTPA
53
2011
2012
2013
2014
CAPITAL SPEND  -
100% BASIS
8mtpa
16mtpa
Bloom Lake’s expansion to
16mtpa is a mirror image of
the current operation
$300 M
$350 M
PHASE I –
RAMP UP
Anticipated annual production
rate in millions of tons
PHASE I –
STABILIZED, PHASE II BUILD
PHASE II -
COMMISSIONING
PHASE II -
STABILIZED


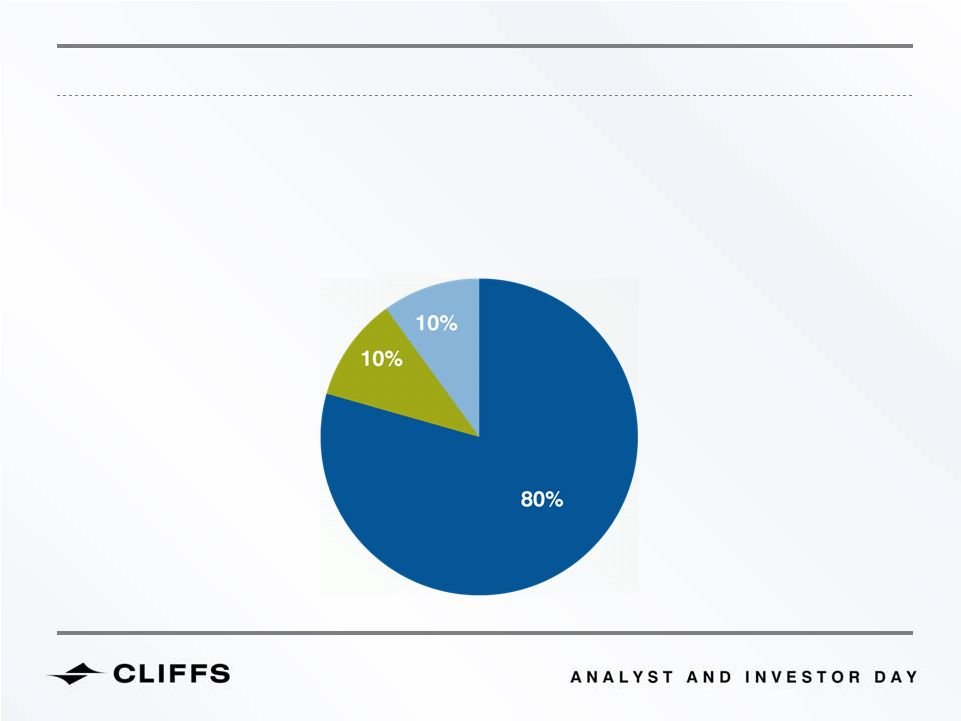
ACHIEVABLE SYNERGIES
Cliffs anticipates achieving approximately $75 million in annual synergies
Transportation –
80%
Shared rail track at
Arnaud Junction
Modify existing ship loader
operations to load at overall
faster rates
Cliffs’
Pointe Noire will
accommodate larger vessels to
transport Bloom Lake concentrate
Product Mix –
10%
Potential to use Bloom Lake
concentrate to produce pellets at
Pointe Noire
Bloom Lake to produce 10-20%
magnetite concentrate lowers
energy rates at pelletizing operation
Potential to blend Bloom Lake ore
with Scully ore to maximize
concentrator throughputs
Other –
10%
Purchasing power
Global marketing
Global recruiting efforts
Technical expertise
54


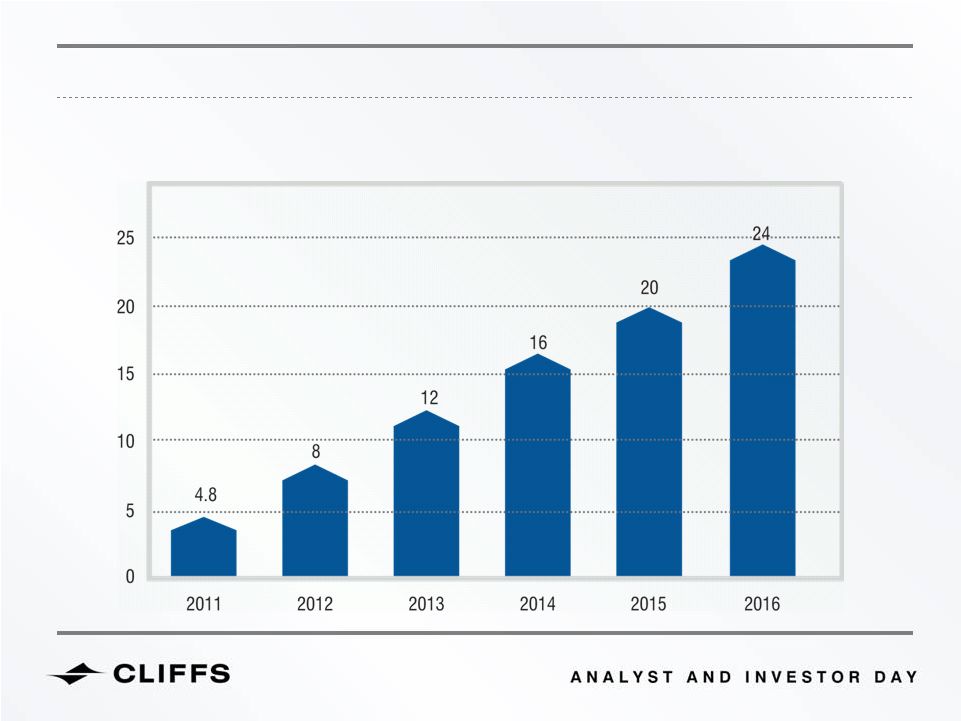
Cliffs intends to expand concentrate operations in Eastern Canada
to 24mtpa by 2015 -
2016
Crude ore to be sourced from Bloom Lake western resources and main pit to
be extended
Current year drilling campaign of West Bloom Lake deposit indicated significant
resource
exists
Anticipated capital cost approximately the same as Phase II expansion of
~$600 million
Lamêlée and Peppler Lake reserves available for future expansion
PHASE III –
EASTERN CANADA EXPANSION TO 24MTPA
1
Sufficient drilling to quantify resources under SEC proven & probable standards has not yet occurred.
55
1


PRODUCTION OUTLOOK INCLUDING PHASE III
BLOOM LAKE’S INCREASING PRODUCTION PROFILE                                
(IN MILLIONS OF METRIC TONS)
56


Duncan Price
CLIFFS NATURAL RESOURCES INC.
ASIA PACIFIC IRON ORE &
NORTH AMERICAN COAL
57


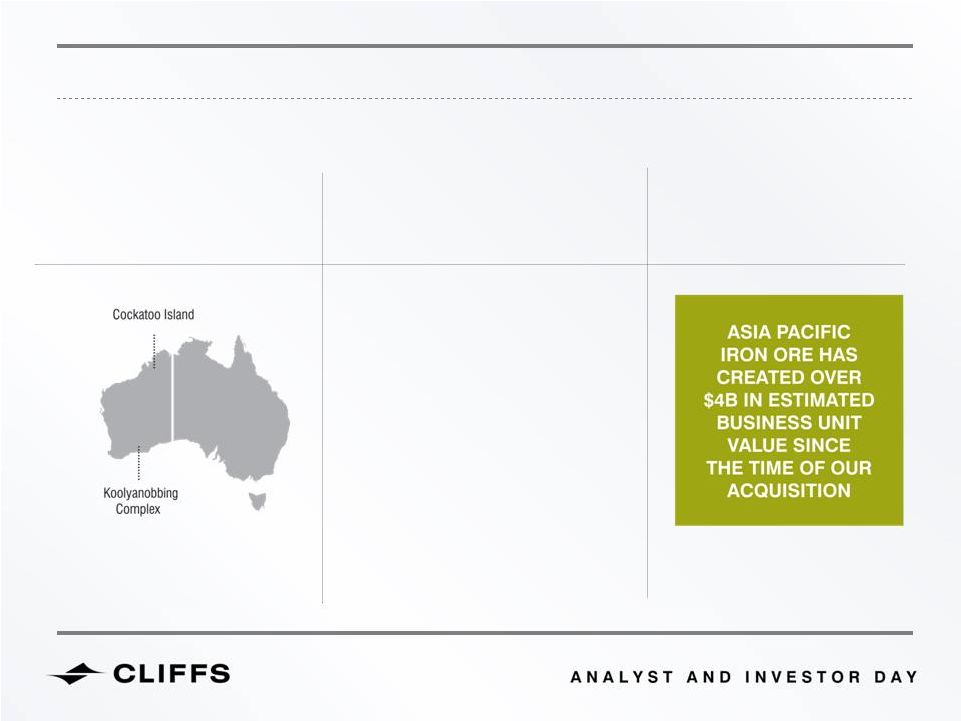
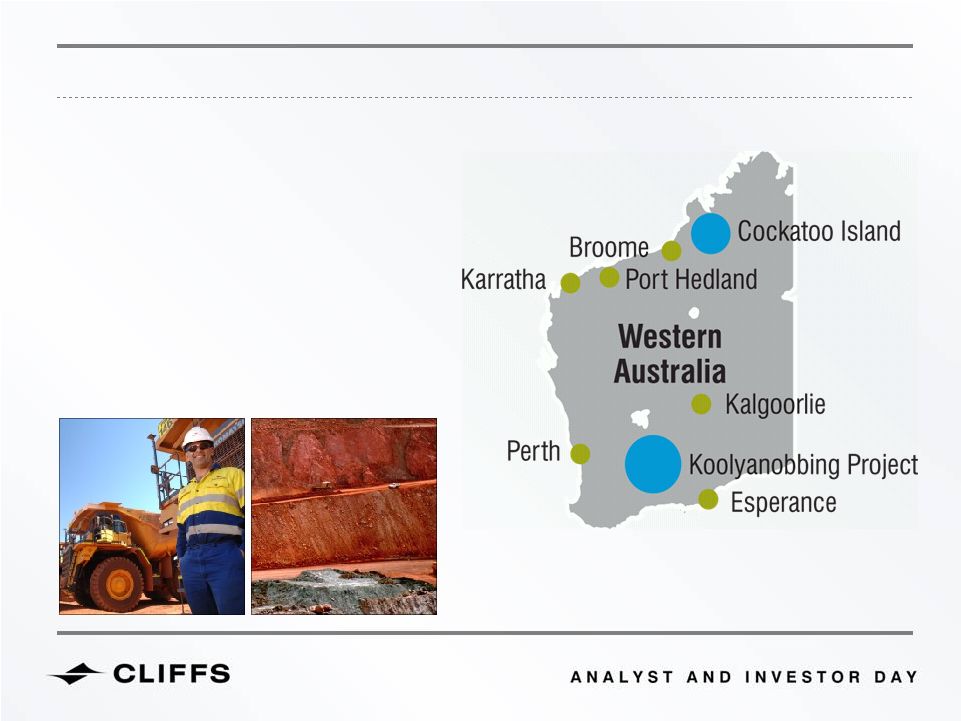
100% ownership of Koolyanobbing
8.5mtpa total production and growing
Expansion plans to 11mtpa by second quarter 2012
50% ownership of Cockatoo Island
1.5mtpa total production
(to EO3Q 2012)
CLIFFS’
ASIA
PACIFIC
IRON
ORE
CURRENT
OPERATIONS
WESTERN
AUSTRALIA
58


3
RD
PARTY
RAIL
(575KM)
3
RD
PARTY
PORT
ROAD HAUL
MINING
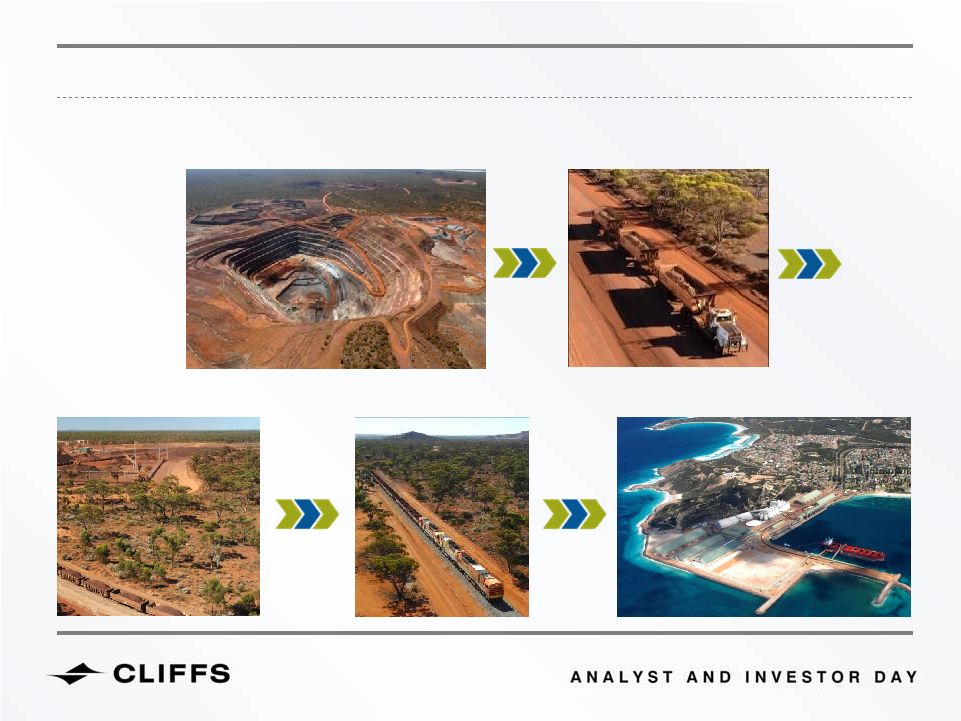
KOOLYANOBBING OPERATIONS
Infrastructure network is central to operations
ORE PROCESSING PLANT
59


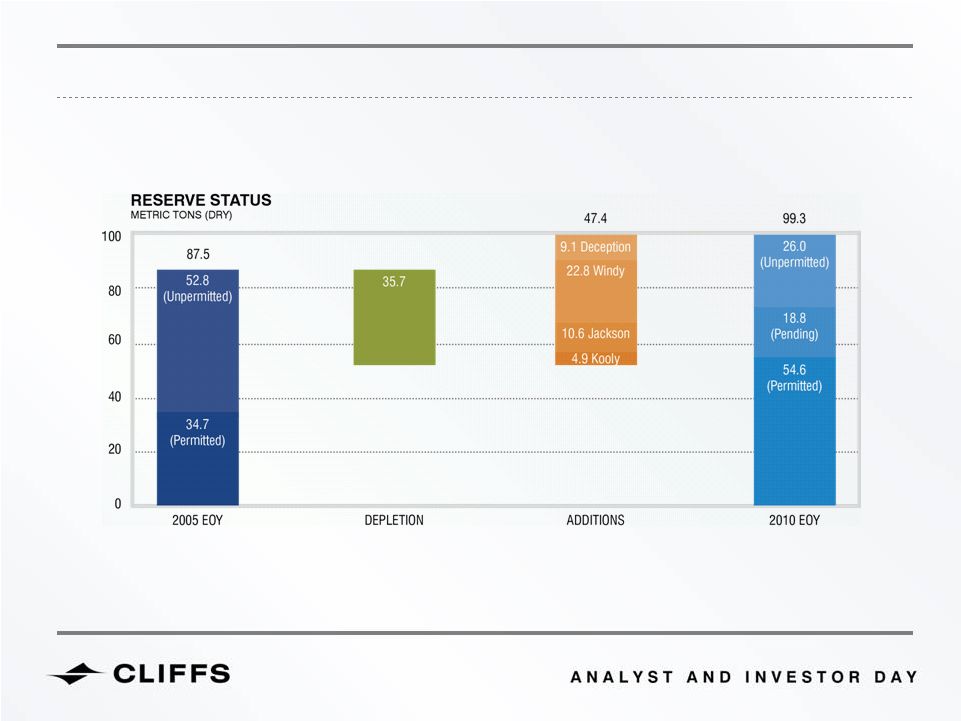
RESERVE GROWTH THE CORNERSTONE OF EXPANSIONS
60


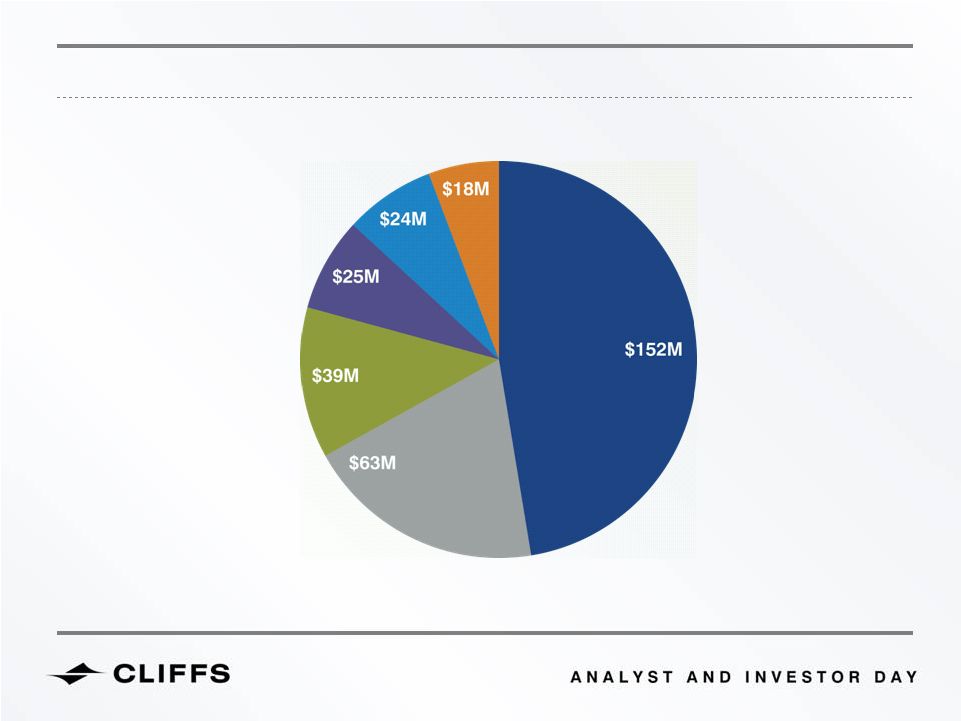
Rail –
A$152M
New locomotives
and wagons
Upgrade of rail yards and
maintenance facilities
Extension of passing loops
Plant Upgrade –
A$63M
Primary crushing and screening facilities
Update of secondary crushing circuit
New interconnecting conveyors
Mining Capacity –
A$39M
Mobile fleet
Additional road train fleet
Infrastructure works
Port –
A$25M
Upgrades to existing RDC
and conveyor systems
New road over rail pass
EPCM –
$24M
Other –
A$18M
ASIA PACIFIC IRON ORE EXPANSION TO 11MTPA
61


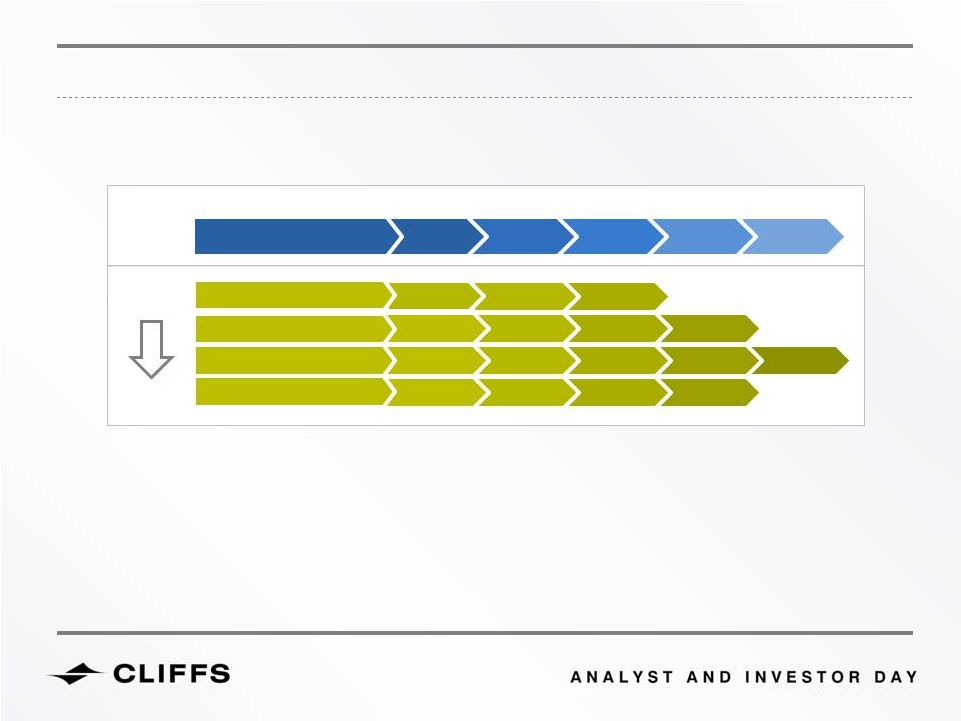
TIMELINE OVERVIEW
Q2
Q3
Q4
Q1
Q2
9mtpa
11mtpa
2011
2012
Mining Upgrade
Plant Upgrade
Rail Upgrade
Port Upgrade
62


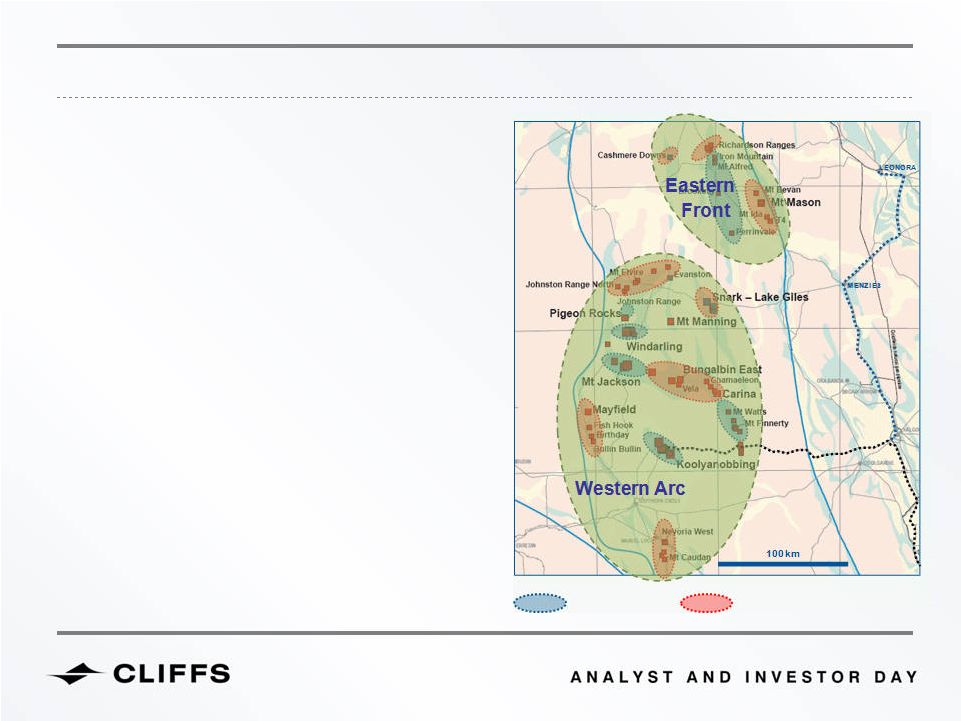
APIO resources
Other regional resources
Western Arc will be depleted by 2020
“Phase I”
drilling for conceptual direct
shipping ore targeting 50-150mt
commenced May 2011 at
Mt Richardson
Potential development
options include:
Sequential operation
Parallel development with
expanded total capacity
EASTERN FRONT POTENTIAL TO BE THE NEXT GROWTH PLATFORM
63


CLIFFS NATURAL RESOURCES INC.
NORTH AMERICAN COAL
64


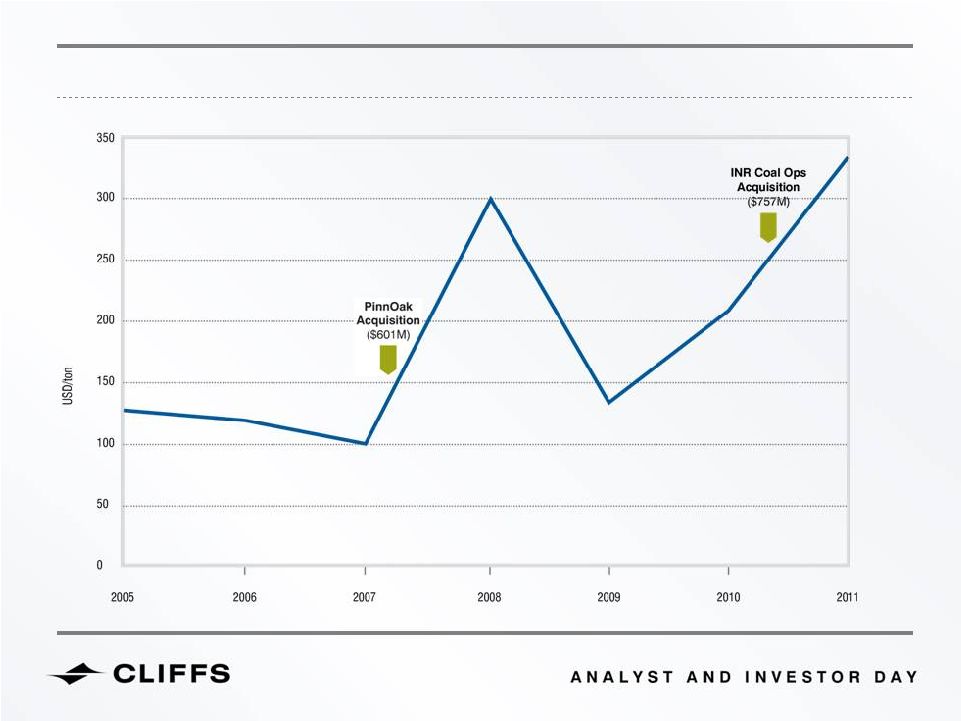
STRATEGIC ENTRY INTO METALLURGICAL COAL…
BMA Benchmark Prices
65


...SECURED LONG LIFE MET COAL ASSETS
1
Reserve review due at end of 2011
2
Premier low vol, low sulfur metallurgical coal
3
Low vol metallurgical coal
4
High vol metallurgical coal
66
Reserves
1
Metallurgical
Coal
Thermal
Coal
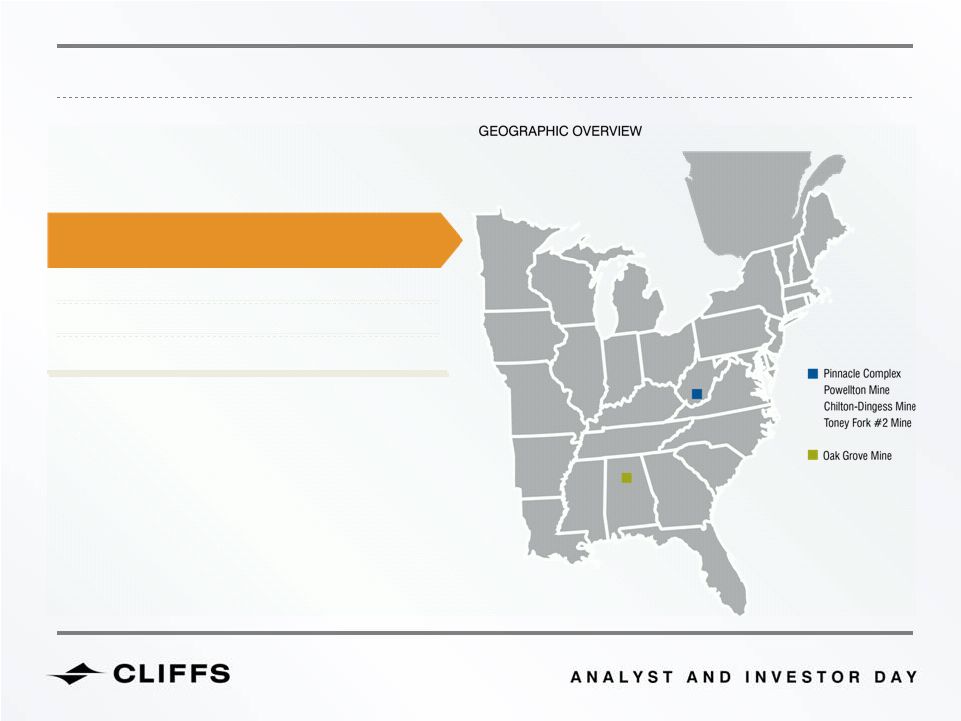
Oak Grove
2
42.1mt
Pinnacle
3
62.2mt
INR Coal Operations
58.9mt
4
61.8mt


CHALLENGES BEYOND EXPECTATIONS
DEWATERING CHALLENGES
GLOBAL FINANCIAL CRISIS (GFC)
NATURAL DISASTER
ADVERSE GEOLOGY
HIGH CO READINGS
67


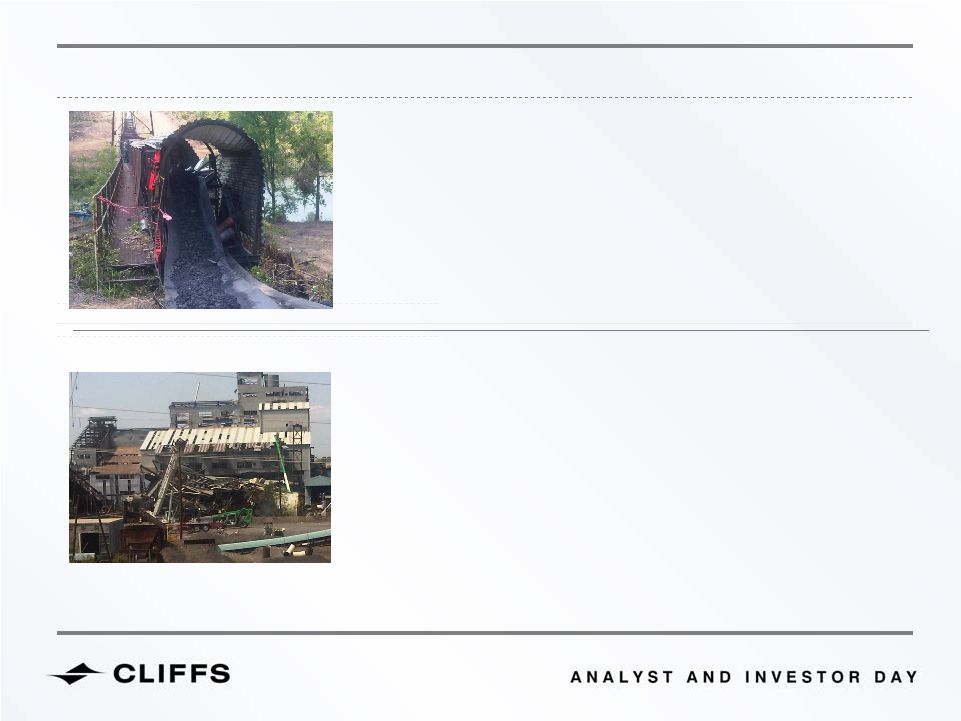
TORNADO DAMAGE AT OAK GROVE MINE
Damaged overland conveyer system
2.5 miles of 5-mile system connecting Oak Grove Mine to the
Concord Preparation Plant rendered inoperable
Requires stockpiling of crude coal until repairs are completed and
recommissioning occurs
Concord Preparation Plant rendered completely inoperable
Top four floors of plant structurally damaged
New structure expected to be in place end of September
Recommissioning
of
plant
targeted
for
mid-
to
late-November
Opportunity to enact some improvement, including deployment
of 40 new spiral separators
68


CARBON MONOXIDE READINGS AT PINNACLE MINE
Regulatory agencies have denied initial remediation plan
Production not expected to resume before fourth quarter
Considering appeal of decision
Remediation effort includes:
Assessment of various options
Prospective installation of seals to allow operations in
continuous mining sections to proceed
Prospective installation of temporary seal to deprive
suspected “hotspot”
of oxygen
69


OPERATIONAL HIGHLIGHTS…AGAINST THE TIDE
Integrated INR’s coal operations into North American Coal
business segment...bolted on a 35% capacity increment without
a glitch
INR’s coal operations are delivering tons and costs at
expected rates
New longwall machine at Pinnacle Mine
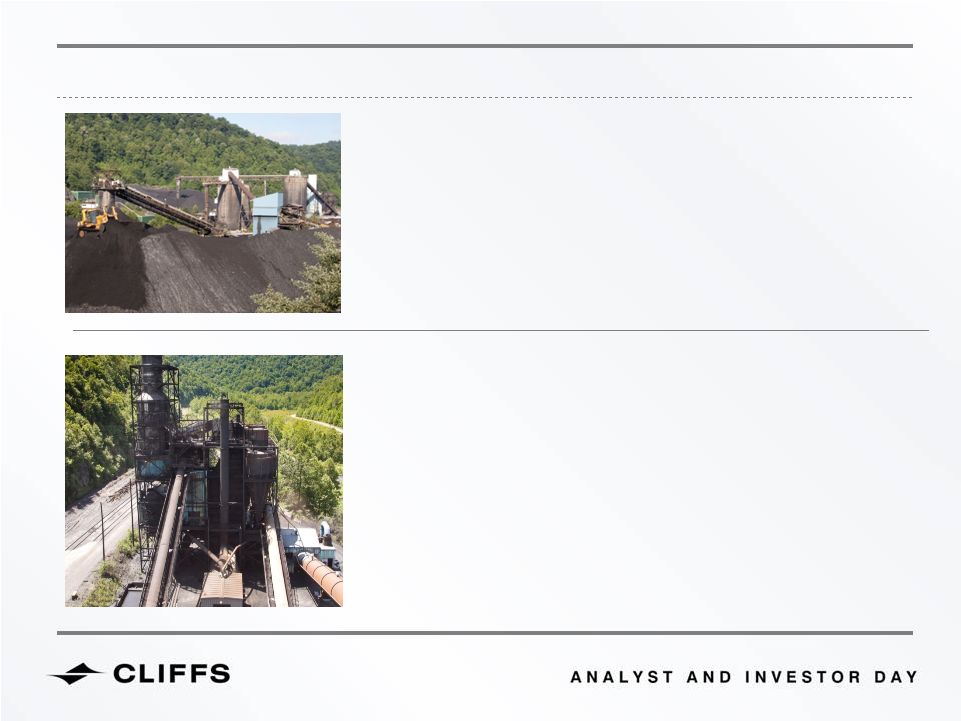
Preparation plant able to clean high ash and improving yields
Major capital projects on schedule
Installed dewatering capacity 1.7M gallons/day
70


DELIVERING CAPITAL PROJECTS
Pinnacle preparation plant upgrade -
$25M
Delivered on budget, 6 months ahead of schedule
Demonstrated
efficiency
uplift
-
plant
yield
up
to
86-95%
from 63-70% organic efficiency
Portal set for August 2011 delivery
Permitting/weather delays partially recovered through        
effective project management
71


OVERALL GROWTH AHEAD OF PLAN
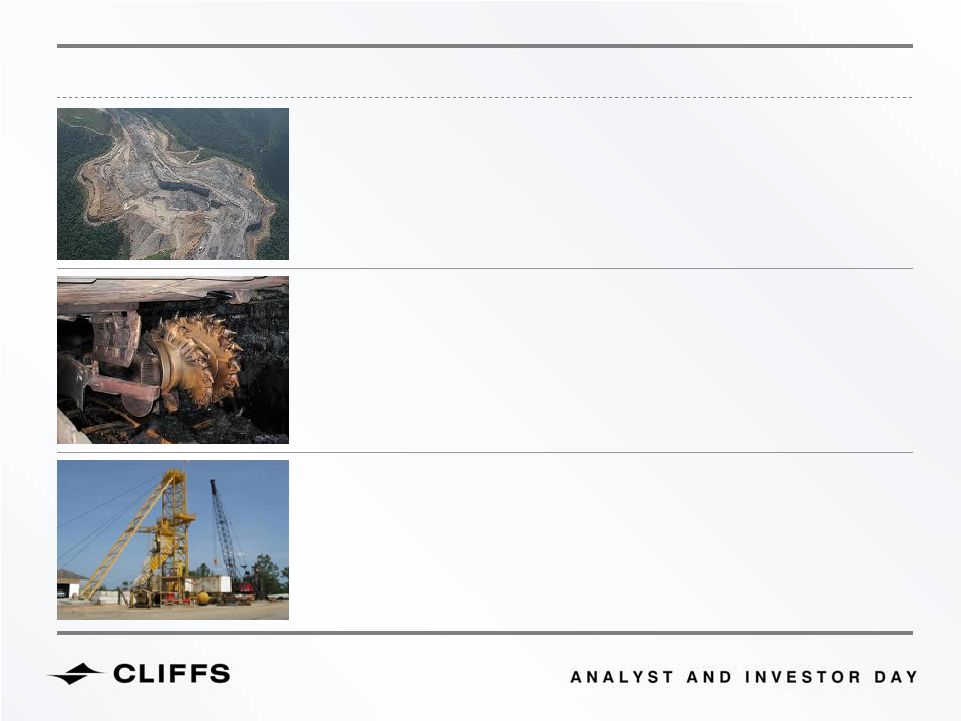
GREEN RIDGE (LOW VOL METALLURGICAL COAL)
Well ahead of plan ... 117kt production in 2011
Costs well below initial expectation
LOWER WAR EAGLE (HIGH VOL METALLURGICAL COAL)
Slope completed in Q1; continuing to staff up
Ramping up in 2011 (40kt); up to 540kt in 2012
TONEY FORK (THERMAL)
Behind on haulage in Q1 due to weather
Full year production target approximately 1mt in 2011
CHILTON ELK LICK (HIGH VOL METALLURGIAL COAL)
Approvals a critical path activity
First production in 2012 with full production 2013
72


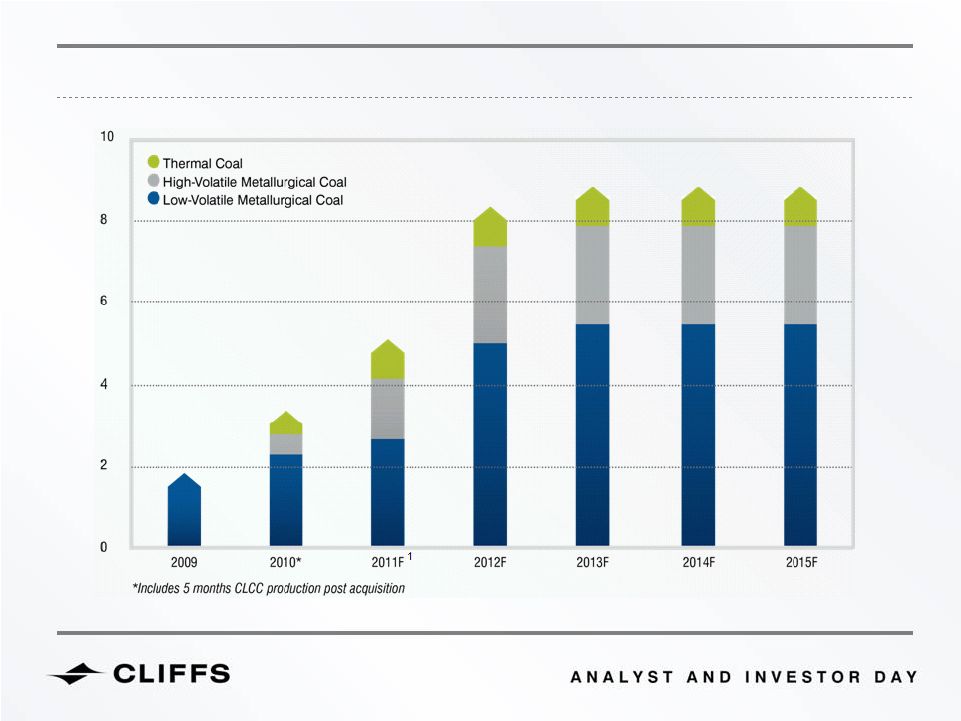
GROWTH TARGET: 9MTPA BY 2015
73
1
Outlook as of June 2, 2011. On June 24, 2011 Cliffs reported that regulators denied a remediation plan at its Pinnacle Mine, which will likely delay production into the
fourth quarter of 2011. Prior to this event, Cliffs expected Pinnacle Mine to produce more than 1mt of low-vol met coal in the last six months of 2011.
PRODUCTION (mt)


NORTH AMERICAN COAL’S OPERATIONS STRATEGY
SHORT-TERM DELIVERY…
Consolidate and leverage
current initiatives
Drive continuous improvement
Recovery from tornado
Pinnacle Mine up and running
GROWTH & RENEWAL…
Maintain the momentum on
current growth projects
Explore RGSS and coal
shipment options
Next generation capital
improvement projects
THE
NEXT
“NEXT”
THING
Creating fresh options
1 YEAR
1-3 YEARS
3+ YEARS
74


Recovery from the tornado
Remediate Carbon Monoxide Challenge
Translate the portal & sealing investments
into outcomes
Consolidate & leverage early wins at Pinnacle
Maintain growth momentum...and pursue
next generation growth
... and continuously evaluating our direction
WHAT’S NEXT?
75


Bill Boor
CLIFFS NATURAL RESOURCES INC.
FERROALLOYS
76


Q3
Q2
ACQUISITION OF CLIFFS’
OWNERSHIP
KWG
Purchased 19%
for $7.5 million
Freewest Resources
Purchased 7%
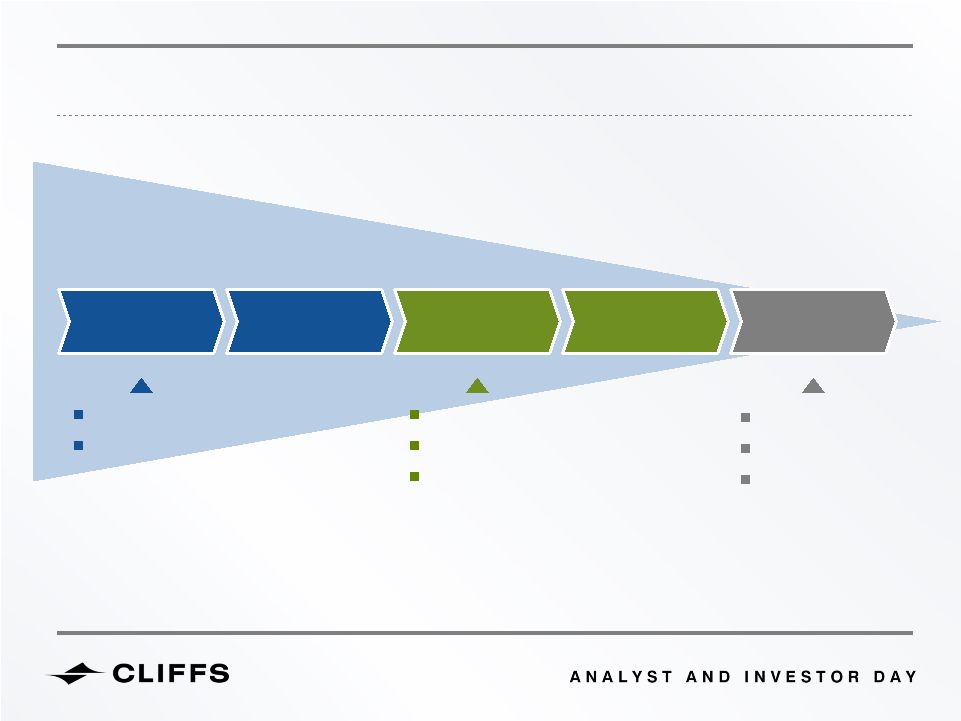
for $11 million
Completed acquisition
for $200 million
Spider Resources
Completed acquisition
for $120 million
Cliffs’
Chromite project represents the start of Ferroalloys, a new business for Cliffs
Upon
completion,
Cliffs
will
be
the
only
North
American
chromite
mining and processing operation
Q1
Q2
Q3
Q4
Q1
2009
2010
Freewest
Spider
7%
93%
100%
CLIFFS’
FERROALLOYS ORIGIN
77
KWG
19%


CHROMITE PROJECT AND FUTURE CUSTOMERS
OPEN-PIT MINE
(~4mtpa crude ore)
PROCESSING
FACILITY
(~1.3mtpa Concentrate
to FeCr Facility)
FeCr
PRODUCTION
FACILITY
CONCENTRATE TO
MARKET
(1mtpa)
Asia
Europe
North America
FeCr TO MARKET
(600ktpa)
78


CLIFFS CHROME PROJECT VIDEO CLIP #1


Cliffs’
Black Thor deposit compares very well with world-class benchmarks
CLIFFS’
BLACK THOR DEPOSIT BENCHMARKS VERY WELL RELATIVE TO
WORLD-CLASS CHROMITE MINES
Cr:Fe
Location
Seam Thickness (meters)
Open Pit or Underground
ROM Grade (Cr2O3)
Cliffs
(Black Thor)
Xstrata
Samancor
Outokumpu
ENRC
Canada
South Africa
South Africa
Finland
Kazakhstan
~20 to >100
0.8 & 1.0
1.1 to 1.8
30 to 90
Not Reported
OP and/or UG
UG
UG
UG
1 OP / 2 UG
~30% to 32%
38% to 39%
37% to 39%
25%
42%
~1.8  to 2.0
1.55
1.45
1.52
>2.5
80


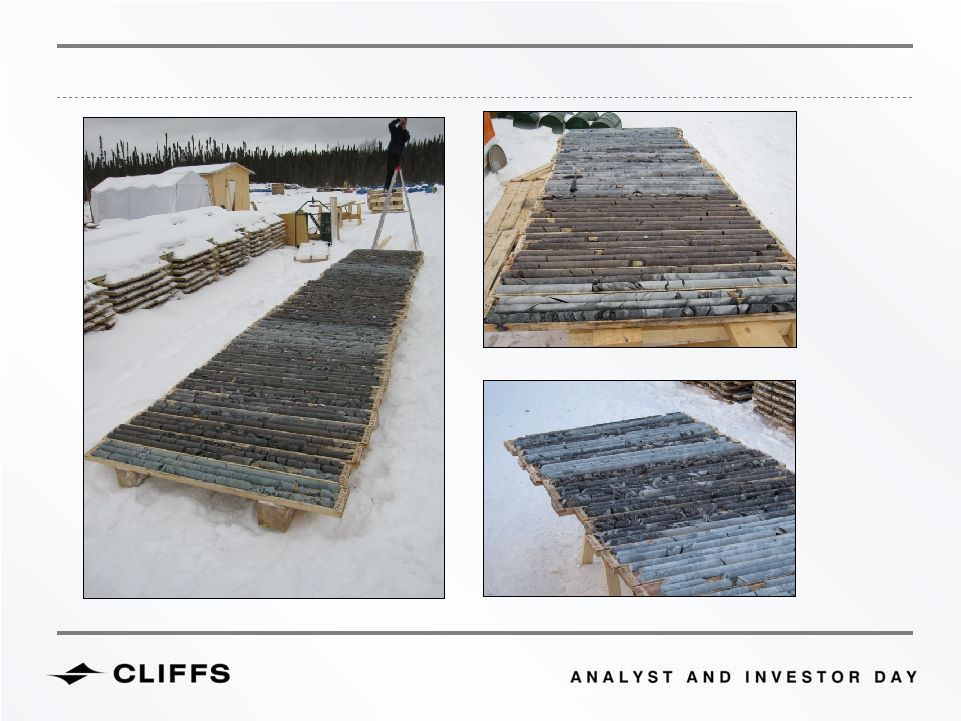
CORE SAMPLES FROM BLACK THOR DEPOSIT
81


CLIFFS CHROME PROJECT VIDEO CLIP #2


CHROMITE PROJECT OVERVIEW
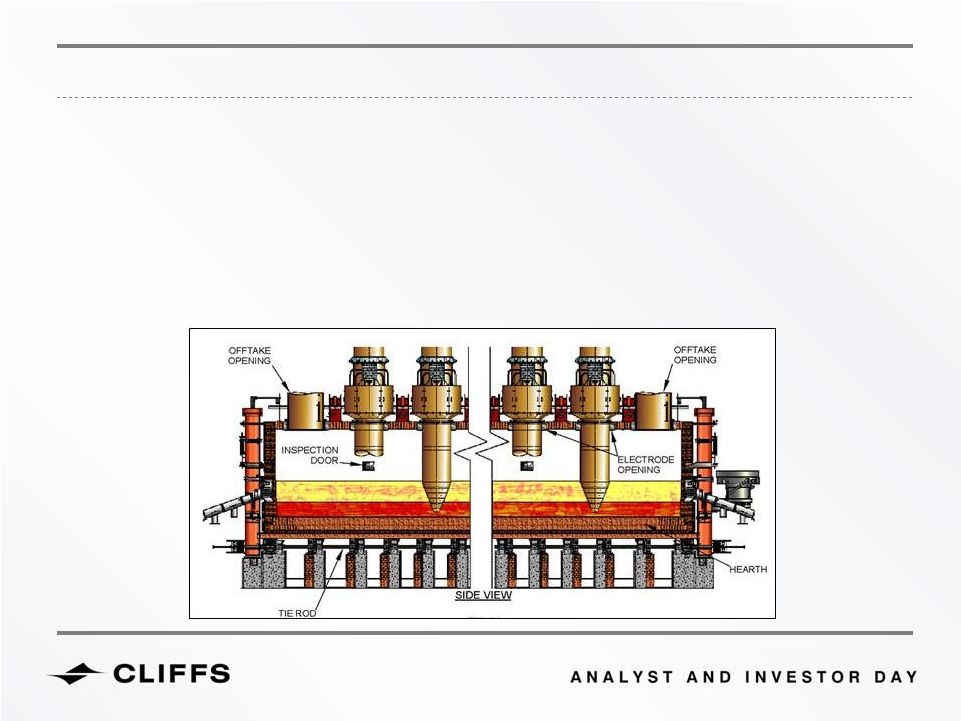
Ferrochrome Production Facility
Final step in Project is to refine ore and concentrate into metal to be sold for use in stainless-steel manufacturing
The facility requires approximately 300 MWH to process the material in an electric arc furnace
Multiple technology options under consideration to develop state-of-the-art process which maximizes power
efficiency and reduces costs
Will
be
situated
near
existing
rail
infrastructure
for
transport
to
customers
in
U.S.
and
ports
in
Canada
for
shipment
to world markets
83


CHROMITE PROJECT OVERVIEW
Ferrochrome Production Facility
Site location studies on-going
anticipated
need
for
1-2
km
site
(brownfield preferred)
Power cost and grid stability are key
drivers for selection
Canada relies on hydroelectric
power which offers clean electric
energy with long-term price stability
Power constraints elsewhere are
driving up cost curve
84
2


85
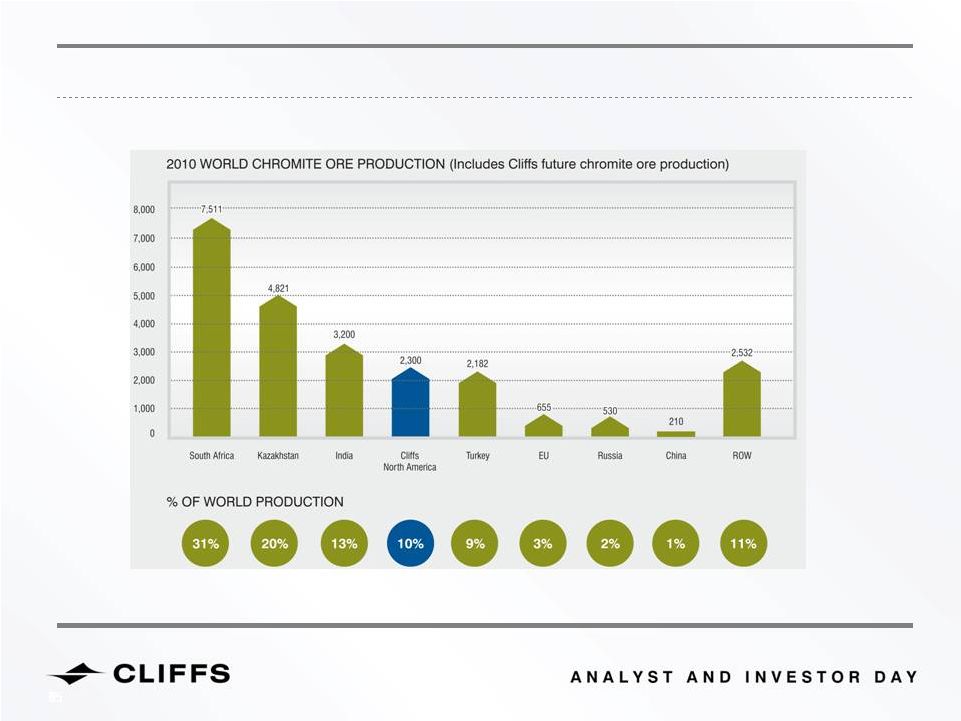
WORLD CHROMITE ORE PRODUCTION
85
85


86
CHROMITE PROJECT TIMELINE
PROJECT
MILESTONES
Construction
Production
Complete Feasibility
Permitting
Investigations of environmental baseline conditions underway
Submitted
a
“Project
Description”
in
May
First
step
in
EA
process
Permits needed for construction and operation may be issued by governmental agencies only
after the EA is successfully completed
2010
2011
2015
2012
2013
2014
CRITICAL
PATH
Complete Prefeasibility
Acquired Control of Deposits
Feasibility study will be completed in 2012, leaving the environmental assessment (EA) and permitting
process as the determinants of start-up timing
86
86


Cliffs chromite mine will be world class, positioned in a AAA country and
with very low mining costs
Cliffs is working to develop an efficient transportation network
and build a
state-of-the-art furnace operation to supply world markets with both
chromite ore and ferrochrome
Ferrochrome processing is critical to access North American and
European markets that don’t have processing capacity
Significant value and access to growth markets will be generated
from
the chromite ore delivered to Asian customers
With a very large potential resource, Cliffs has the ability to expand its
position in the market through time
IN CLOSING
87


Cliff Smith
CLIFFS NATURAL RESOURCES INC.
GLOBAL EXPLORATION
88


2011
Budget:
Approximately
$50
-
$55
million
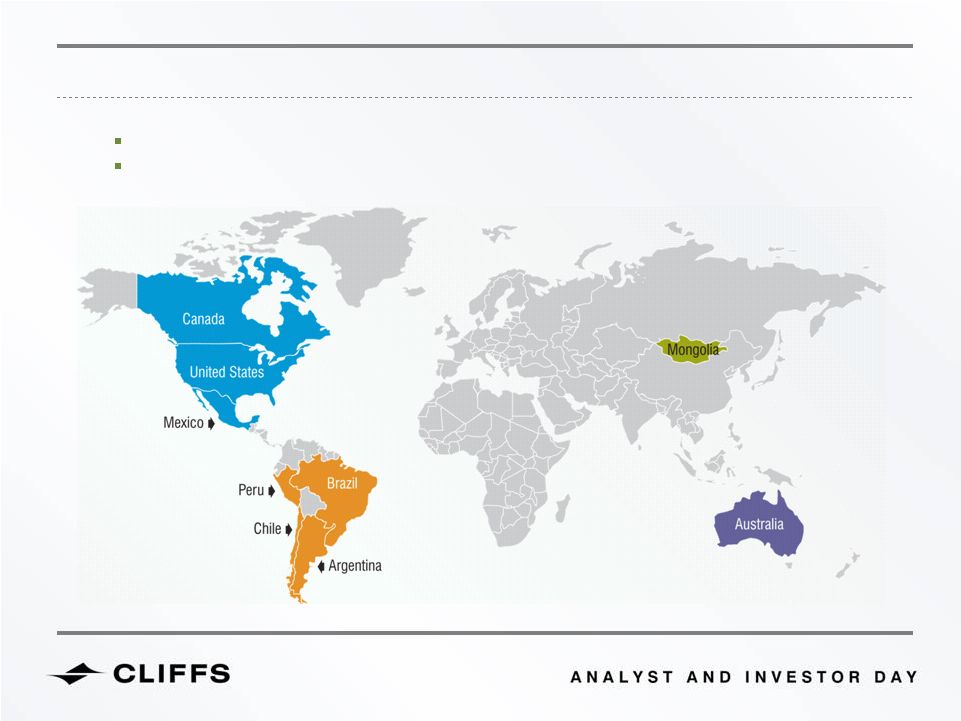
North America; Peru, Brazil, Chile, Argentina; Mongolia and Australia
ACTIVE COUNTRIES
89


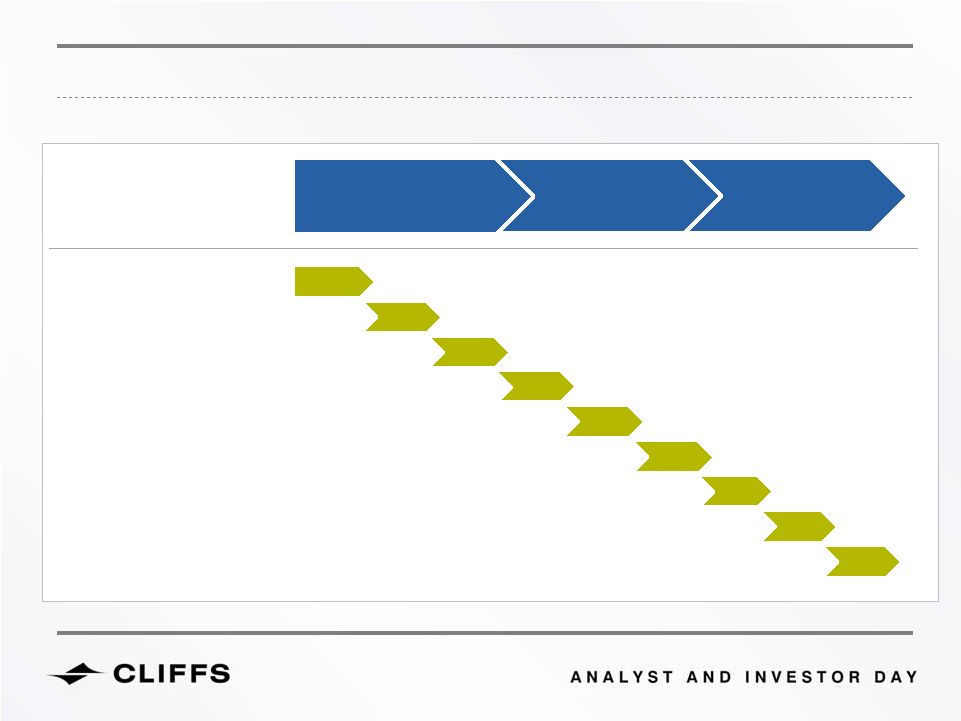
TYPICAL STAGES OF EXPLORATION PROJECTS
EXPLORATION
PIPELINE
STUDIES
EXPLORATION
ACTIVITIES
EXPLORATION
DEAL
STRATEGIC FIT
DISCOVERY
POTENTIAL RESOURCE
LOI / TERM SHEET
LEGAL AGREEMENT
TARGET IDENTIFICATION
PRE-FEASIBILITY STUDY
FEASIBILITY STUDY
SCOPING STUDY
90


Altius Minerals
December
2010
Strategic
Alliance
Agreement
targeting
ferroalloys
in
Eastern
Canada
First Point Minerals
November
2009
option
agreement
to
earn
51%
JV
interest
to
advance
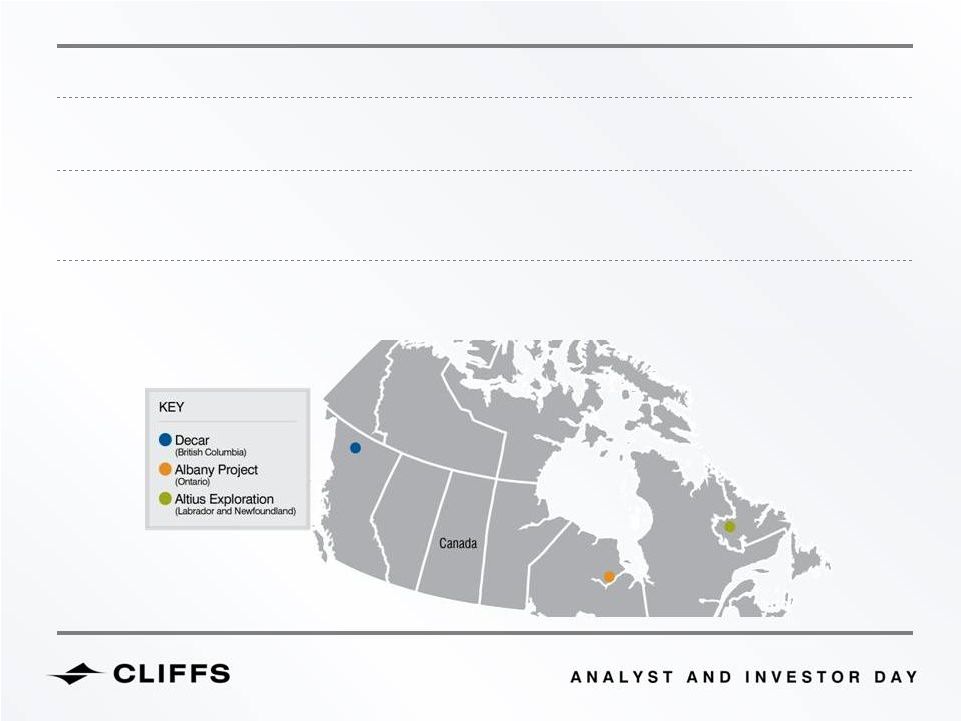
Decar
nickel
alloy
property
Currently funding year two of earn-in agreement
Zenyetta Minerals
January 2010 option agreement for Albany project targeting nickel, copper and PGMs
CANADA DRILLING PROGRAMS
91


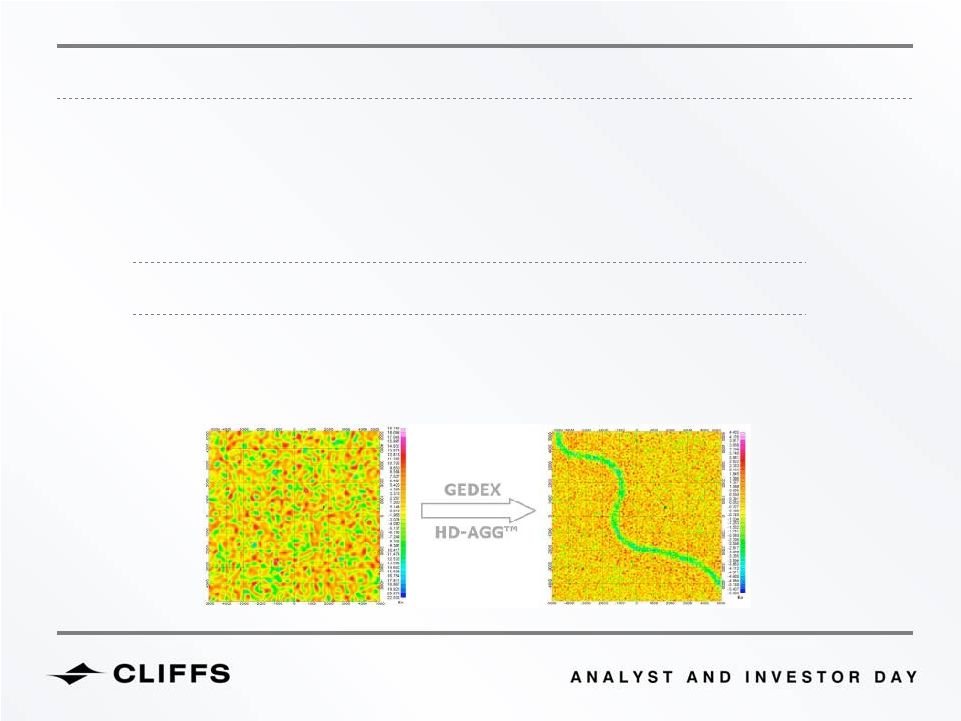
ACCESS TO EMERGING, PROPRIETARY TECHNOLOGY
November 2010 Strategic Agreement provides Cliffs global access to
Gedex’s
HD-AGGTM™
airborne subsurface mapping system:
Used in airborne platform, outperforms gravimeters by order of magnitude
3D spatial gradient of gravity vectors
For exploration anomalies, gravimeters must sense 1:1,000,000, whereas Gedex
technology can sense 1:3,000
Capable
of
“seeing”
buried
structures
by
mass
and
quickly
detects
ore
bodies
Cliffs
intends
to
deploy
for
non-chromite
“Ring
of
Fire”
exploration
Conventional Technology
Gedex
Technology
92


Geology indicates potentially large resource conducive to an open-pit operation
Products could include a low-grade nickel with simple process flowsheet and 30-55% Fe magnetite
concentrate with 3% nickel, 2% chromite
Successful resource definition and studies needed to lead to an actual mine, but potential does exist
FOCUS ON DECAR NICKEL ALLOY PROPERTY
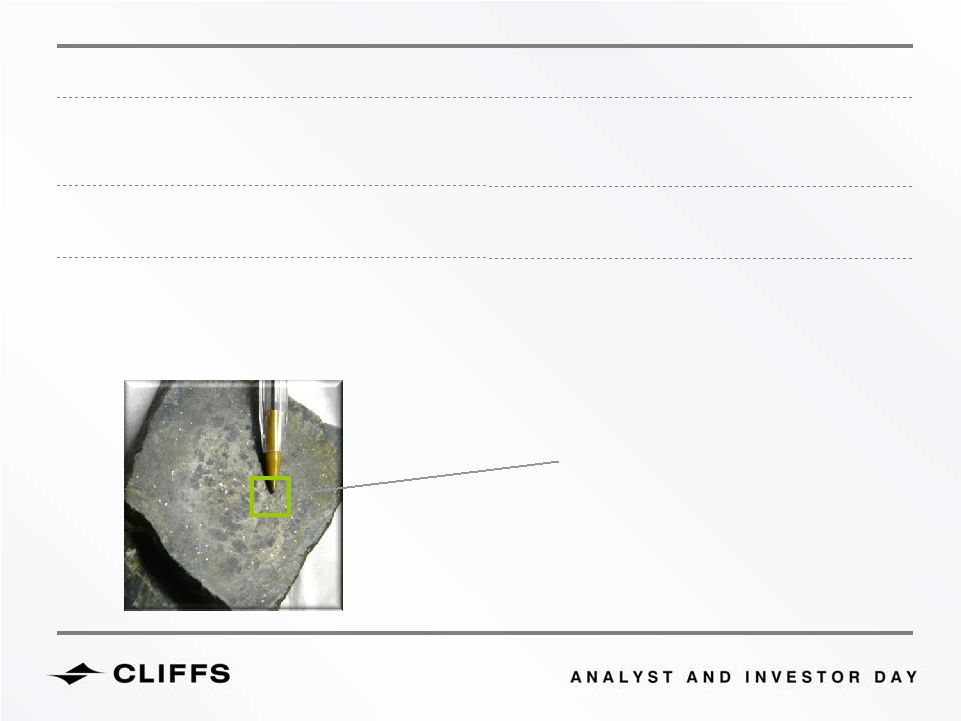
Small silver flakes are the
targeted nickel in the deposit
93


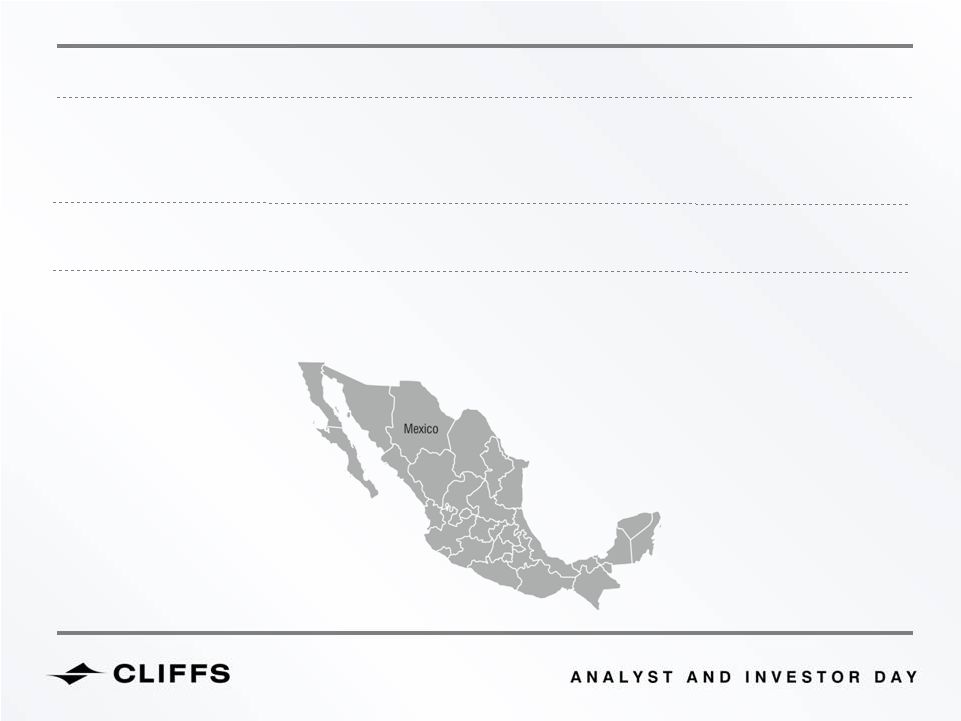
Riverside Resources
June 2010 Alliance Agreement for iron oxide copper gold (IOCG) exploration in Mexico
Exploration
for
IOCG
projects
in
Northwest
Baja
California
State
and along the Pacific Coast from
Western Sinaloa State to Oaxaca State, Mexico
Focus on identifying major target areas using Riverside’s proprietary Mexico-specific databases
with extensive field follow up to delineate a minimum of four IOCG deposits within an area of
1,500,000 km²
MEXICO EXPLORATION ACTIVITY
94


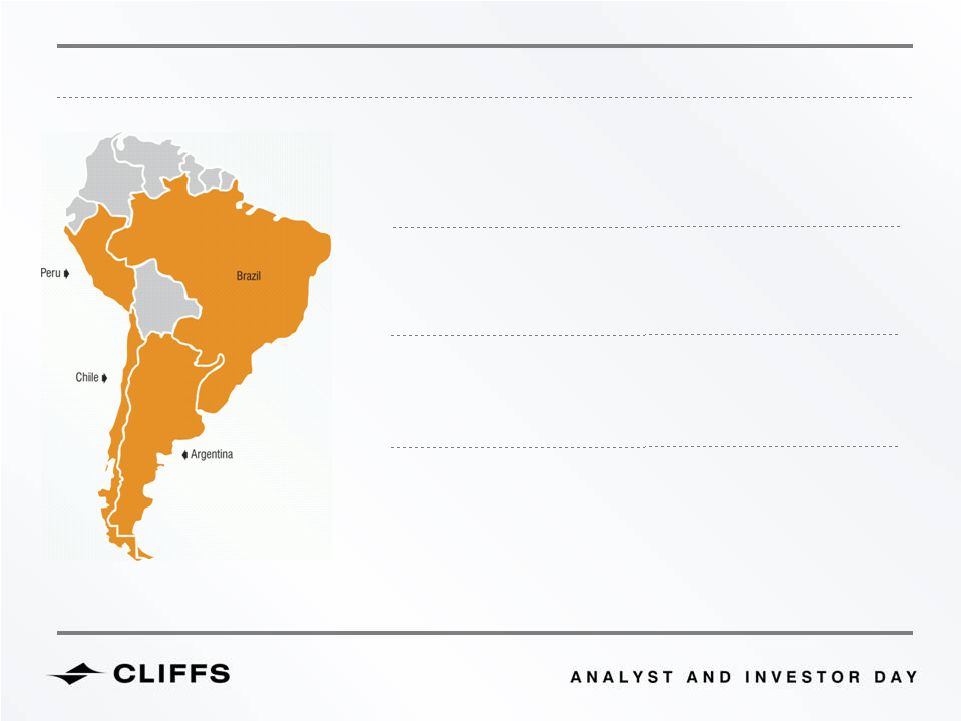
SOUTH AMERICA EXPLORATION ACTIVITY
Estrella Gold (Peru)
February 2011 Exploration Alliance Agreement
targeting IOCGs
AusQuest Peru
IOCG earn-in agreement
Mariana Resources (Chile)
June 2010 Alliance and JV agreement targeting IOCGs
Other Chile and Argentina Drilling Programs
Number of additional private ventures targeting manganese
and other steelmaking raw materials
95


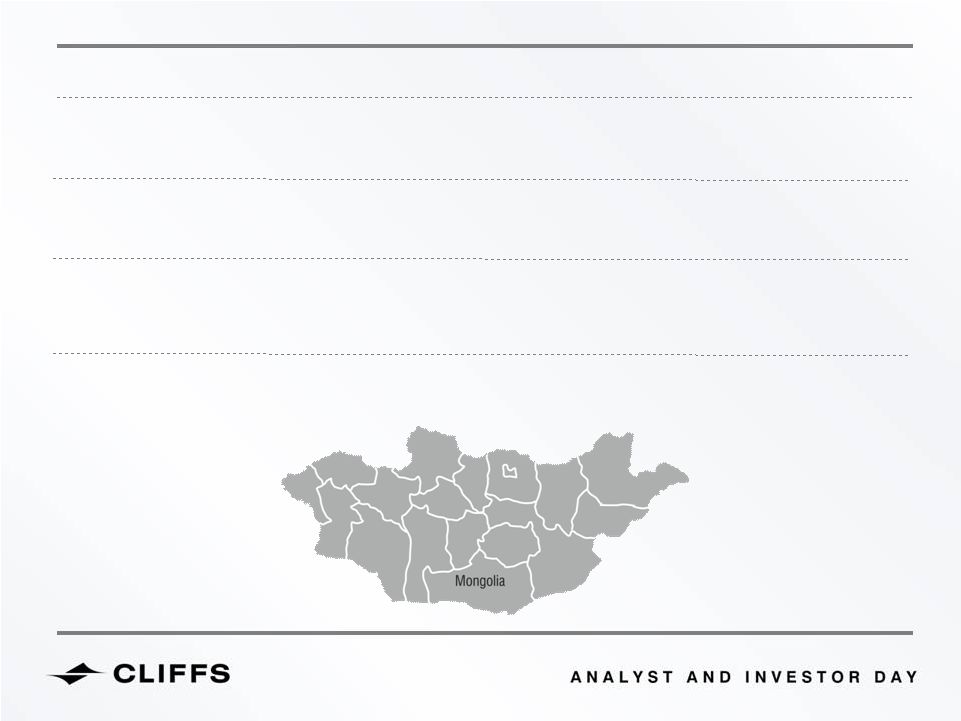
MONGOLIA EXPLORATION ACTIVITY
Private target generation focused on chromite, nickel and molybdenum
A new frontier –
combination of great geology, historically underexplored and
attractive investment climate
Most other mining companies focused on vast metallurgical coal projects, but
Cliffs sees opportunity in ferroalloys
Established,
local
partner
with
one
person,
Cliffs’
in-country
presence
96


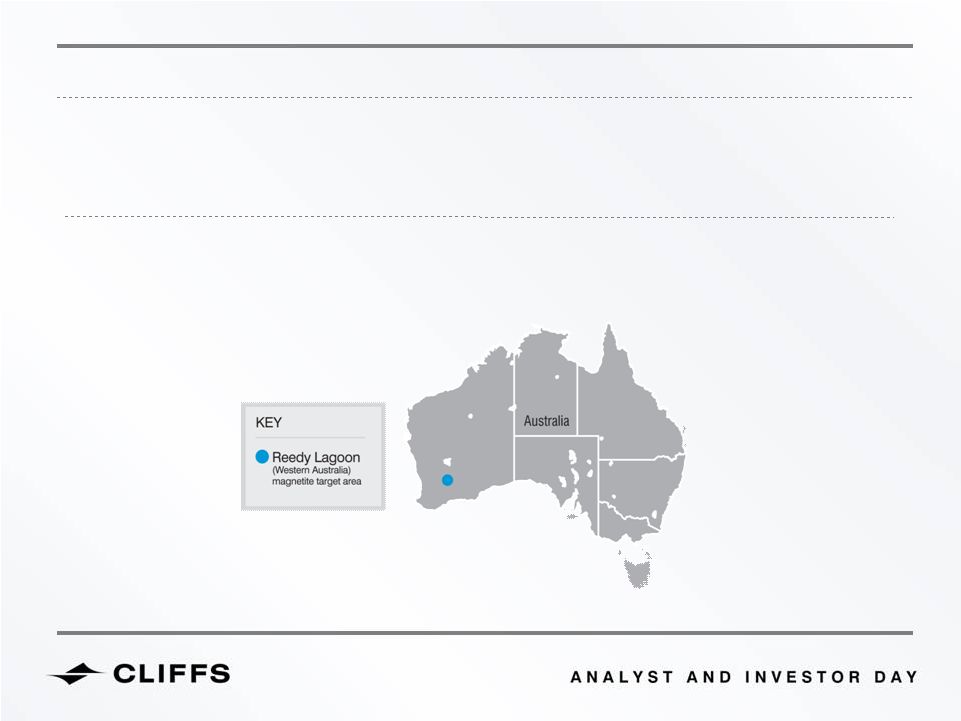
AUSTRALIA DRILLING PROGRAMS
AusQuest
September 2008 Cliffs strategic alliance, subscription and option agreement
Reedy Lagoon
February 2011 JV to explore for magnetite iron ore in Southwest Yilgarn, Western Australia
97


CLIFFS NATURAL RESOURCES INC.
SUSTAINABILITY
Kelly Tompkins
98


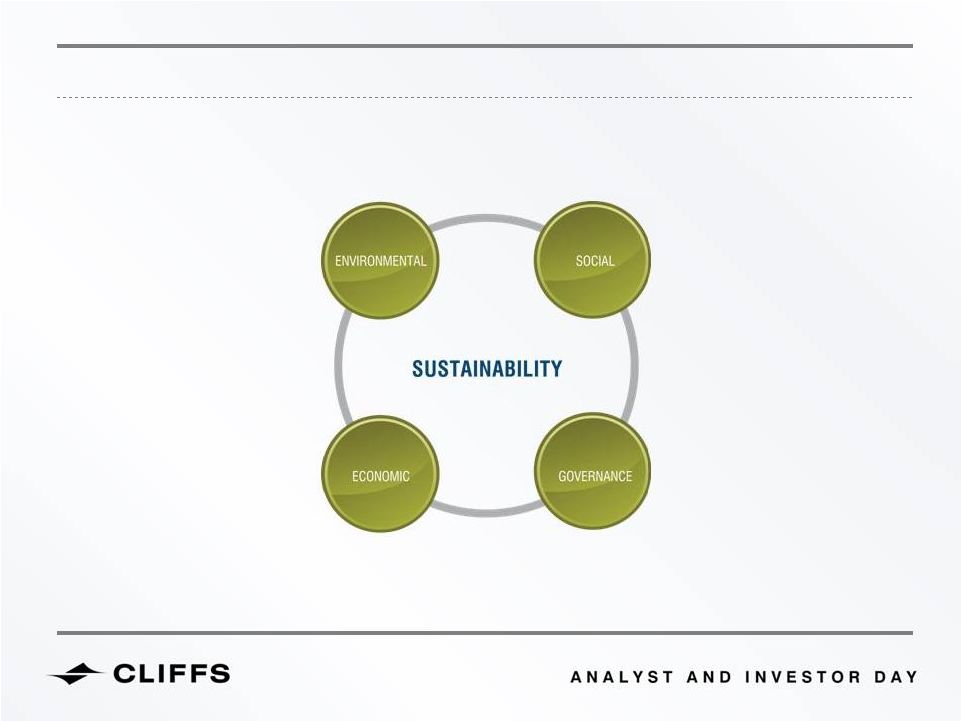
SUSTAINABILITY AT CLIFFS
Sustainability is the Cliffs’
social license to operate
SOCIAL
Safety
Diversity
Labor Relations
Community Engagement
Aboriginal Relations
ENVIRONMENTAL
Energy
Climate Change
Waste, Emissions
Water
Land Use/Reclamation
ECONOMIC
Economic Development
Community Development
Market Presence
Indirect Economic Impacts
GOVERNANCE
Corporate Governance Structure
Risk & Crisis Management
Codes of Conduct,
Corruption & Bribery
99


KEY STAKEHOLDERS ARE INCREASINGLY AWARE OF SUSTAINABILITY
Investors
demand more transparency and comparability
Regulators
hold industry participants to tighter and additional standards
Communities
are increasingly aware, skeptical and active
Employees
want to know their employer has high sustainability standards
100


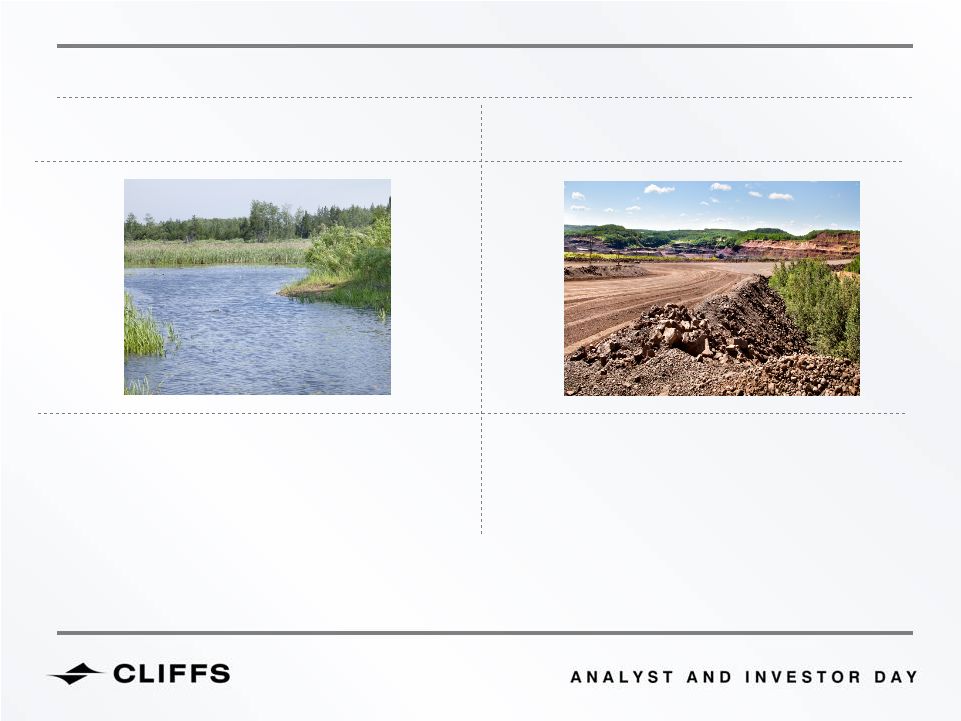
WORDS IN ACTION
Land Reclamation
Operations Impacts
& Efficiency
Cliffs has demonstrated reclamation plans to
return former mine sites to beneficial public
use long after the economic benefits
are derived
Unique
Cliffs-led-tree-planting
initiative
with
community,
government
and
public
interest
groups;
enhanced
Cliffs'
reputation
for
sustainable mining practices in West Virginia
Emission reduction standards obstacle to
optimizing UTAC mine
production capability in Minnesota
Investment in redesigned fuel system to
handle lower emission, solid fuels and
biomass, providing fuel flexibility
Secured permit to produce incremental
tons and avoided substantial pollution-
control cost
101


WORDS IN ACTION
Koolyanobbing Expansion
Aboriginal Relationships
Unique collaboration between Cliffs and
government agencies, interest groups and
Aboriginal communities
Improved relationships and benefits for
all parties
Conservation of rare flora and fauna and
flexibility and certainty in accessing the
mineral resource
Innovative designation of the area as a
conservation and mining reserve
Understanding the evolving nature of
Aboriginal relations; building upon
Cliffs’
historical commitment to
community engagement
Recognize and respect traditional
ecological knowledge and develop
progressive Impact Benefits Agreements
with First Nations communities
102


PUBLIC POLICY OUTLOOK
Greenhouse Gas
% Depletion
MSHA
Water quality
regulations
Air quality
regulations
Environmental
permitting
Fisheries Act -
Metal
Mining Effluent
Regulations
Air quality regulations
Permitting and
Approvals
Plan du Nord –
(Plan North)
Energy and
Infrastructure Incentives
(Plan North)
Mining Tax
Carbon Tax
Biodiversity
Conservation
Permitting
Mine Reserves
Energy
Land Management
Water Permitting
Strategies in place to manage legislative and regulatory risks and opportunities
103


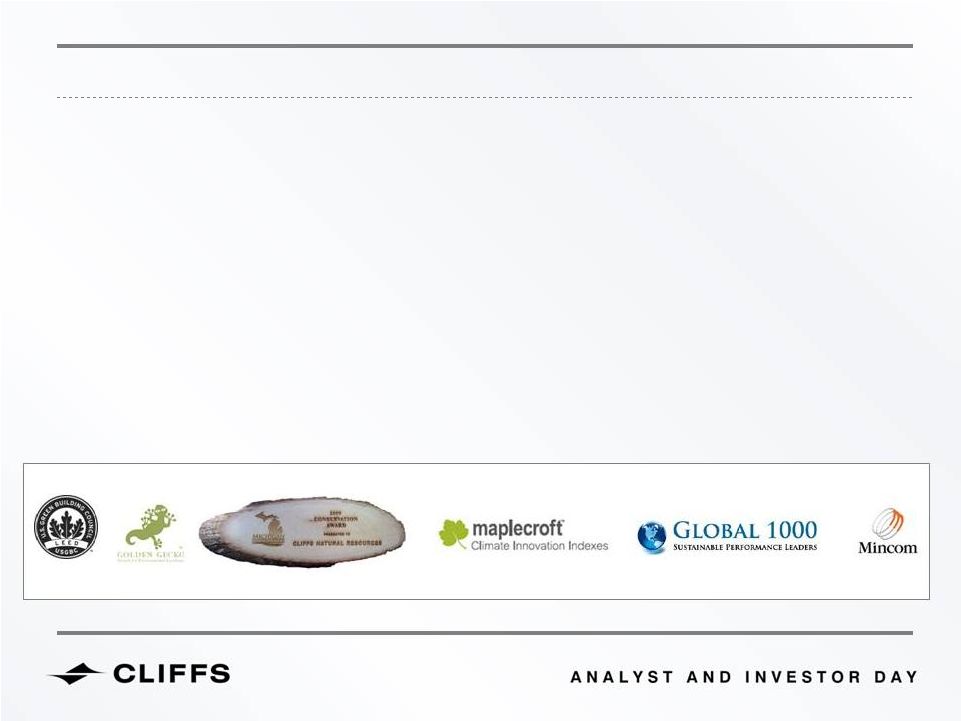
AWARDS AND RECOGNITION
Earned LEED certification
Selected finalist for Golden Gecko Award, Western Australia
Conservation Award from Marquette County, Michigan
Inclusion in Maplecroft Climate Innovation Indexes
Named Global 1000 Sustainability Performance Leader
Awarded Mincom Innovation and Excellence in Asset Management Vision
No. 9
on Bloomberg Businessweek’s Inaugural Top Performers List
104


BUILDING ON THE FUNDAMENTALS
OPERATIONAL EXCELLENCE
SHAREHOLDER RETURNS
SUSTAINABILITY
ENVIRONMENTAL
SOCIAL
ECONOMIC
GOVERNANCE
105


CLIFFS NATURAL RESOURCES INC.
CAPITAL STRUCTURE &
ASSET ALLOCATION
Laurie Brlas
106


STRATEGIC
CAPITAL
DECISIONS
A
COMPREHENSIVE
CAPITAL
MANAGEMENT
AND DISTRIBUTION PROCESS DESIGNED TO DRIVE TOP QUARTILE TSR
Considerations
for
uses
of
cash
and
excess
cash
flow
Business Investments
Re-invest in business –
organic growth and capital expenditures
Mergers & Acquisition –
focus on value-creating opportunities
Build long-term, optimal structure that is sustainable “through-cycle”
Investment grade rating/profile is core to strategy
Balance Sheet Structure
Return to Shareholders
Sustainable ordinary dividend increases
Special dividends
Share repurchase
107


CLIFFS’
CURRENT BALANCE SHEET STRUCTURE
Increased scale provides ability to support higher leverage metrics, while remaining investment grade
Active management positions Cliffs to capitalize on growth and distribution opportunities
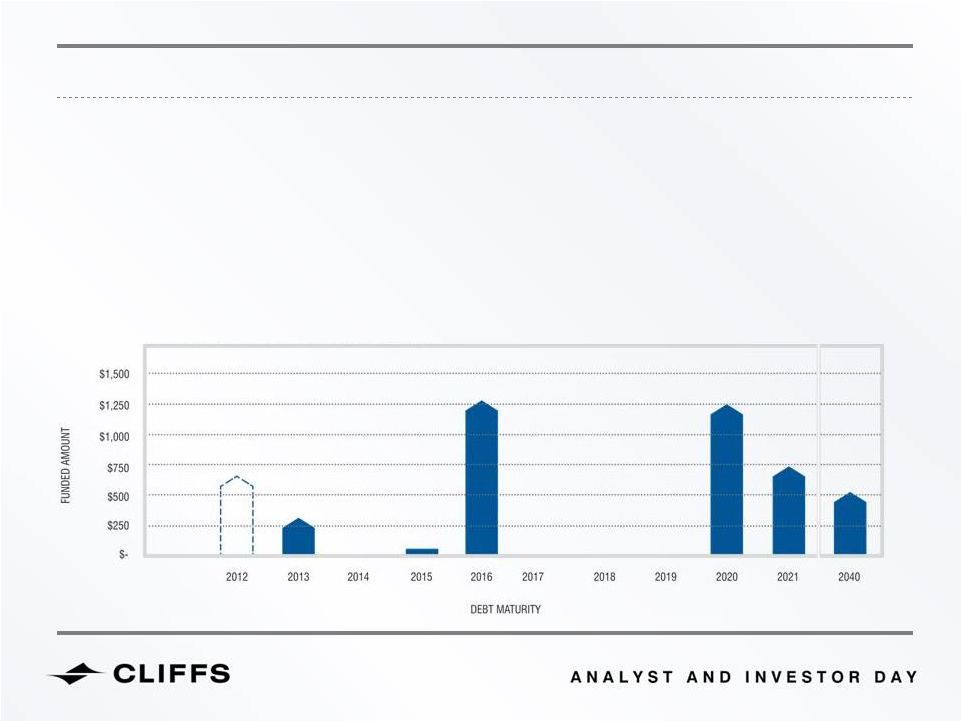
Average duration of current funded debt is ~9 years
Currently maintaining a ~60% / 40% fixed to floating rate debt mix
Reserve liquidity is key to capital structure strategy
APPROXIMATE TOTAL DEBT: $4 Billion¹
1
As of 6/15/11
108


FINANCIAL FLEXIBILITY TO FUND FUTURE GROWTH
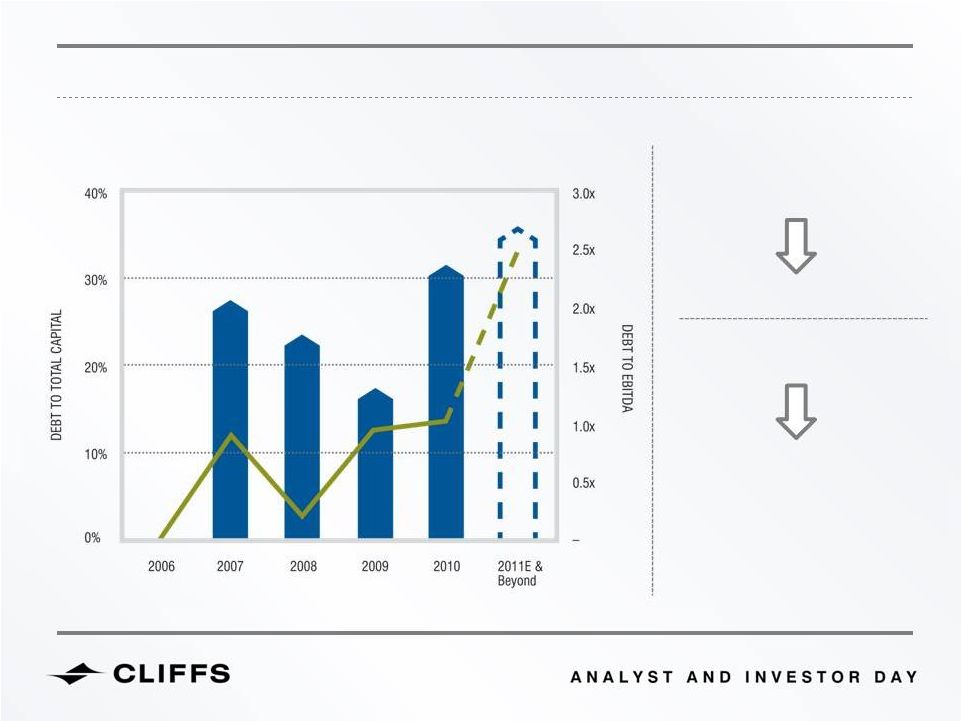
TARGETED
LEVERAGE
PARAMETERS
DEBT TO TOTAL CAPITAL
30% to 40%
DEBT TO EBITDA
2x to 2.5x
HISTORICAL DEBT TO TOTAL CAPITAL & DEBT TO EBITDA
109


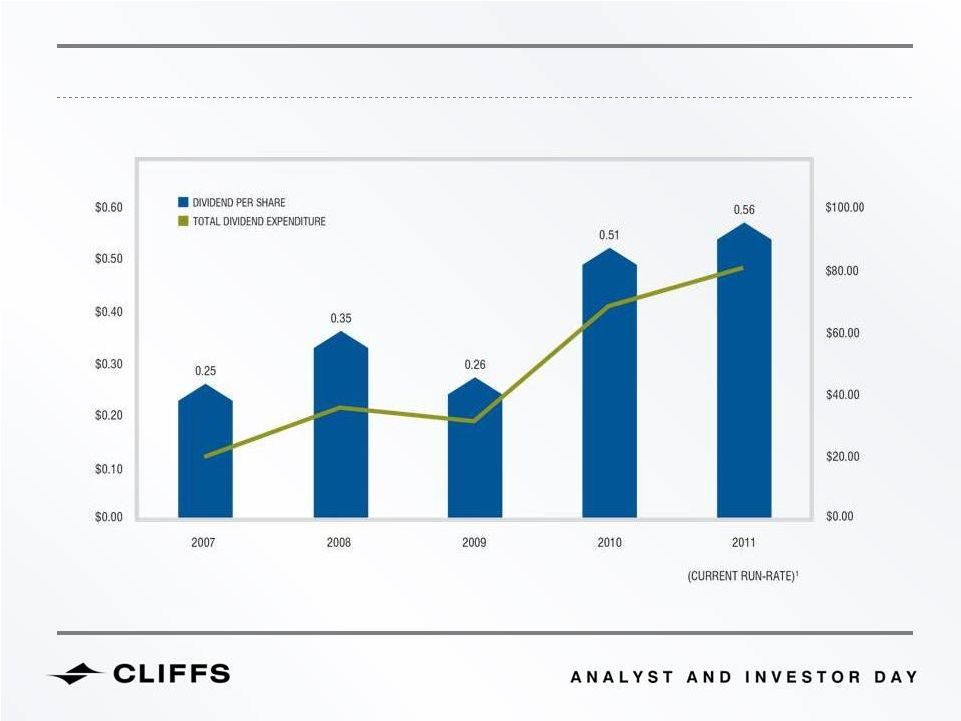
ANNUAL DIVIDENDS PER SHARE AND HISTORICAL TOTAL SPEND
1
Based on shares outstanding of approximately 147 million
110


CLIFFS’
CURRENT DIVIDEND PAYOUT AND POLICY
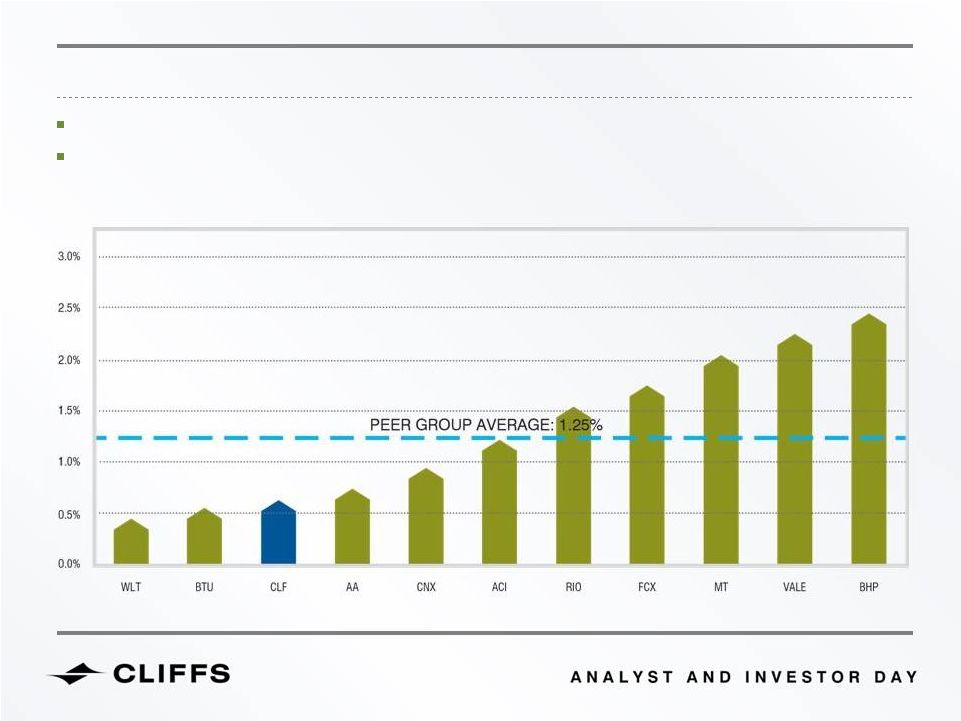
Cliffs employs a progressive philosophy that steadily increases or maintains dividend levels
Current objective is to consistently migrate toward yields similar to comparable companies
111


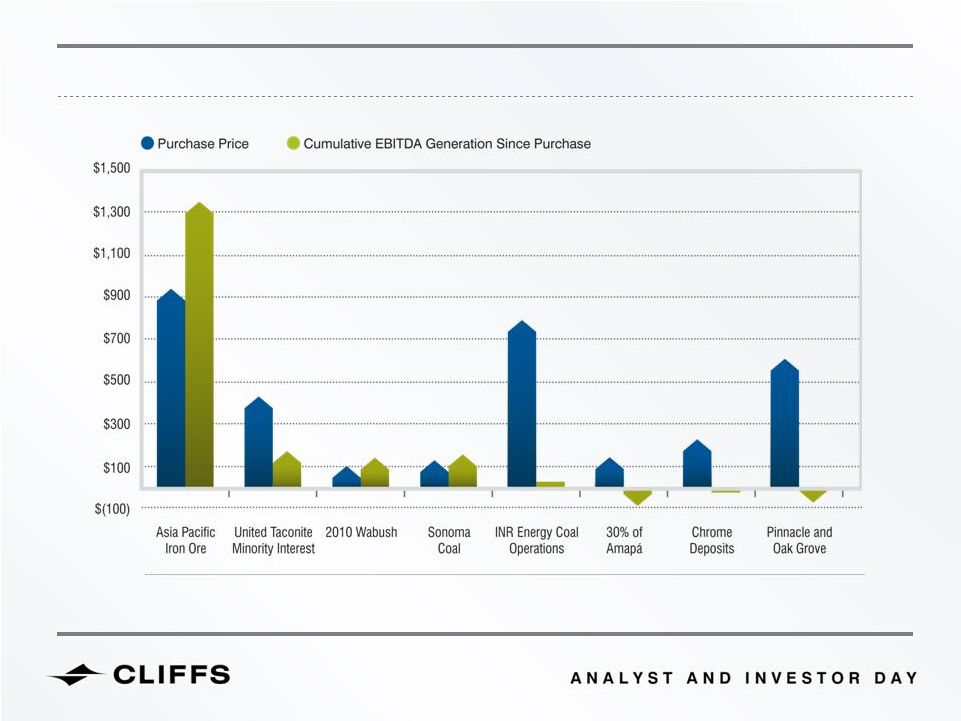
ACQUISTION
SCORECARD
2005
THROUGH
2010
1
The
figures
above
for
the
loss
at
Amapá
depict
cumulative
equity
loss
since
date
of
initial
investment
2005/2008
2008
2010
2007
2010
2007
2010
2007
Year Acquired
1
(in millions)
112


113
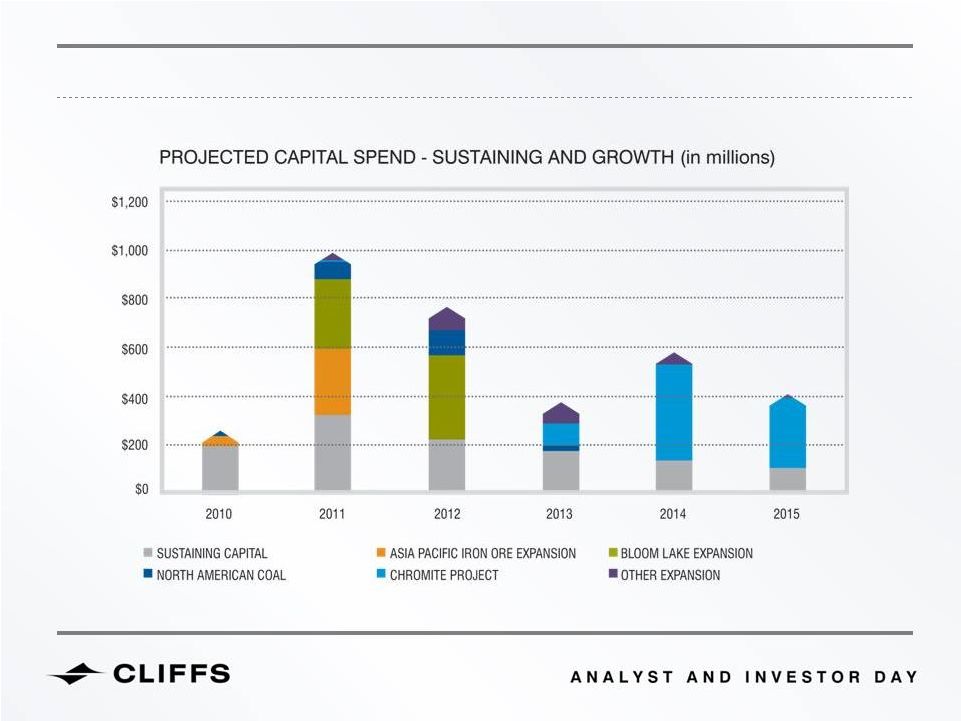
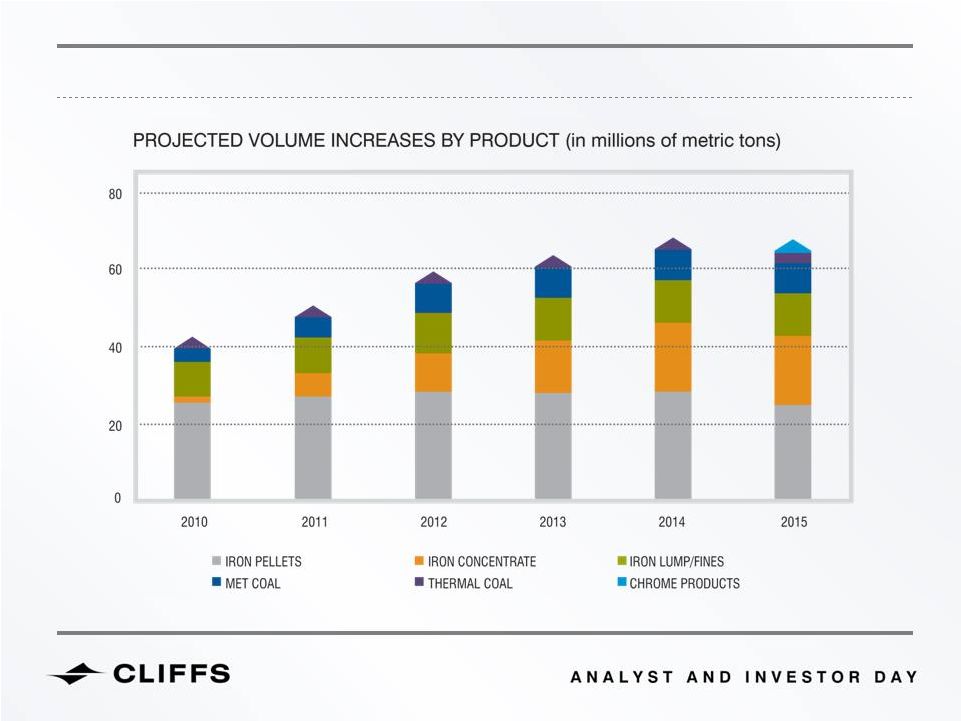
PROJECTED CAPITAL SPENDING RELATED TO VOLUME GROWTH


114
PROJECTED CAPITAL SPENDING RELATED TO VOLUME GROWTH
1
Assumes 1mt of chromite concentrate and 600kt of ferrochrome
2
Assumes
production
from
Amapá
and
Bloom
Lake
Mine
and
excludes
Bloom
Lake
Mine’s
ramp
up
to
24mtpa
1
2


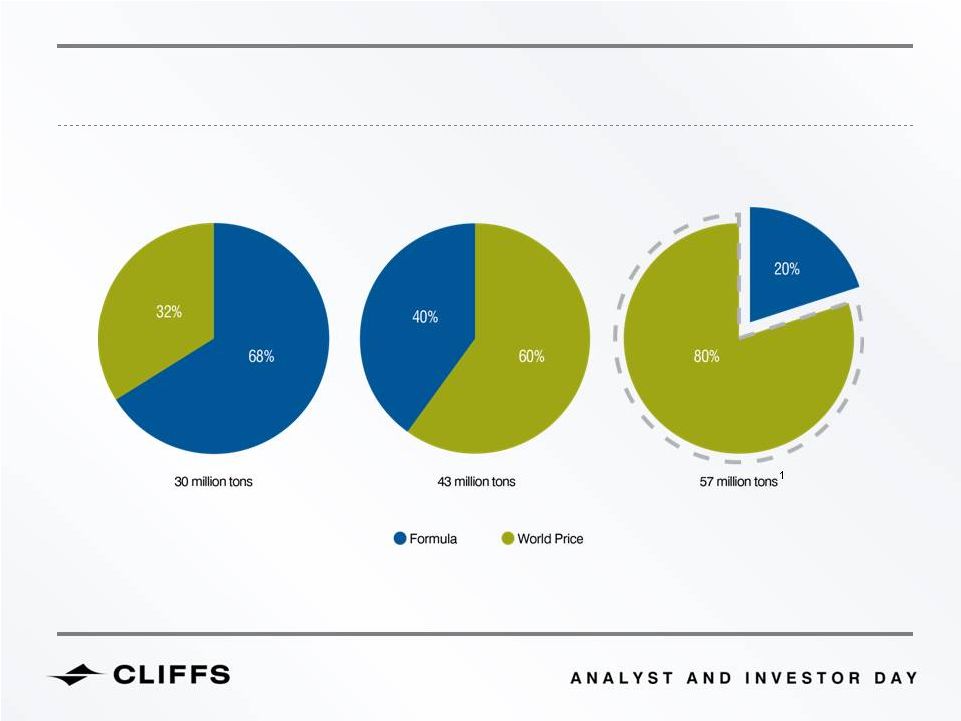
IN 2014, NEARLY 80% OF CLIFFS’
GLOBAL IRON ORE VOLUME IS EXPECTED TO
BE PRICED WITH THE WORLD MARKET
1
Assumes 29.5mt of iron ore pellets, 11mt of iron ore lump and fines iron ore and 16mt of iron ore concentrate
115
2008
2011E
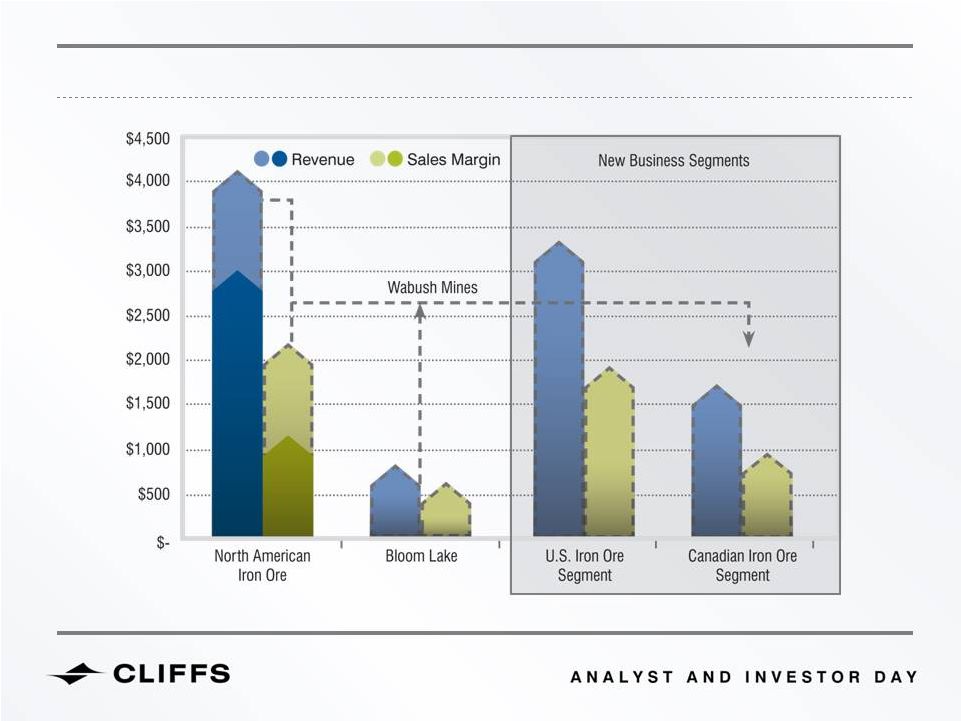
2014E


BREAKING OUT U.S. IRON ORE AND CANADIAN IRON ORE SEGMENTS
116
(in millions)
2011E


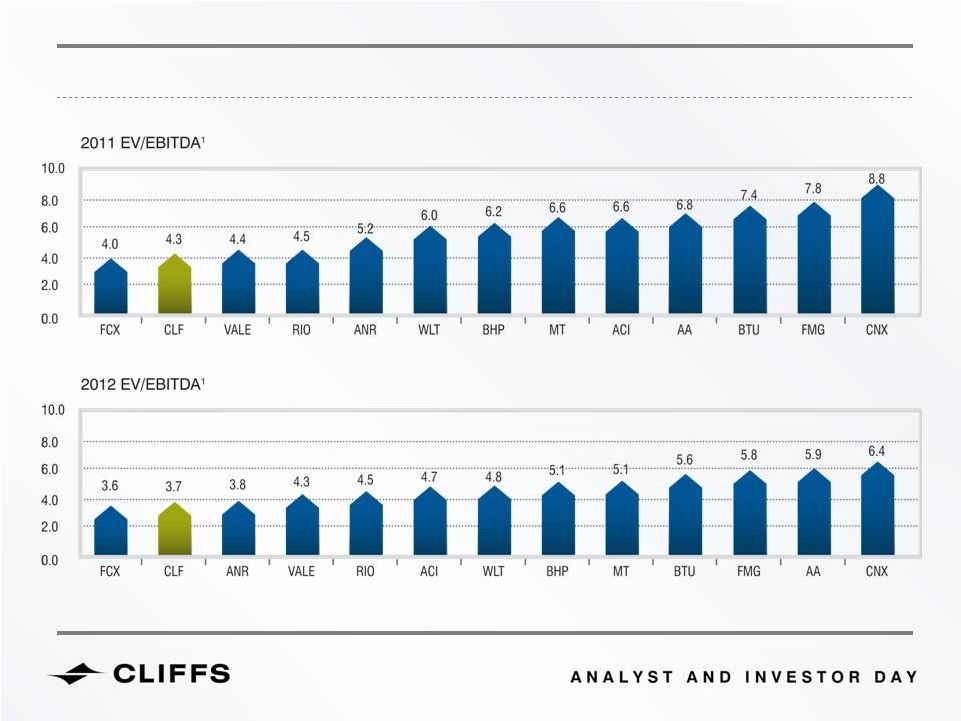
WITH EXECUTION OF GROWTH PLANS, VALUE CREATION WILL OCCUR
1
Reuters 5/27/11
117


Joe Carrabba
CLIFFS NATURAL RESOURCES INC.
SUMMARY AND CONCLUSION
118


Megatrends within the commodities space are underpinning our industry:
New supply delays, increasing demand and degrading ore quality
As a business, Cliffs has transformed:
Positioned to become a nearly 60mtpa iron ore, 10mpta coal and
1mpta ferroalloy producer
Seaborne exposure and customer diversification is increasing, with half of
future revenues poised to come from markets outside North America
The Company strives to allocate capital in value-generating ways, with a
strong pipeline of internal growth
THE CLIFFS JOURNEY HAS JUST BEGUN...
119


CLIFFS NATURAL RESOURCES INC.
CLIFFS EXECUTIVE LEADERSHIP TEAM
QUESTION &
ANSWER SESSION
120


PLEASE SUBMIT YOUR ELECTRONIC QUESTIONS TO: 
NYSE@CliffsNR.com
121


CLIFFS NATURAL RESOURCES INC.
APPENDIX
122


Portman
Limited
United
Taconite
2010
Wabush
Sonoma
Coal
INR Energy
Coal
Operations
Chrome
Deposits
PinnOak
Operating Income (GAAP as reported)
3,537.9
$       
995.4
$        
139.8
$        
106.9
$        
95.3
$          
12.6
$          
(18.4)
$         
(232.0)
$      
2,438.5
$       
Depreciation, Depletion & Amortization
983.9
             
391.1
          
29.6
             
24.6
             
47.8
             
14.6
             
-
                  
153.4
          
322.9
             
Other Non-Operating Income
35.0
                 
(1.4)
             
-
                  
-
                  
1.9
               
-
                  
10.6
             
2.1
               
21.8
                 
EBITDA (Non-GAAP)
4,556.8
$       
1,385.0
$    
169.4
$        
131.5
$        
145.0
$        
27.2
$          
(7.8)
$           
(76.5)
$         
2,783.1
$       
Reconciliation of Operating Income
(GAAP)  to EBITDA (Non-GAAP)
Other
2005-2010
(Cumulative)
Summary of Acquisitions 2005 - 2010 (Cumulative)
Cliffs
Consolidated
2005-2010
(Cumulative)
RECONCILIATION OF NON-GAAP FINANCIAL METRICS
1
1
Other primarily represents Cliffs' legacy North American Iron Ore mines, including Northshore (100%), Tilden (85%), Empire (79%), United Taconite
(30%), Wabush (27%) and Hibbing (23%).
($ in millions)
123