 OPERATIONAL EXCELLENCE | A WORLD LEADER | STEWARDSHIP Cliffs Natural Resources Inc. Corporate Presentation April 2009 JC Exhibit 99(a) |
| OPERATIONAL EXCELLENCE | A WORLD LEADER | STEWARDSHIP Cliffs Natural Resources Inc. Corporate Presentation April 2009 JC Exhibit 99(a) |
 OPERATIONAL EXCELLENCE | A WORLD LEADER | STEWARDSHIP 1 “Safe Harbor” Statement under the Private Securities Litigation Reform Act of 1995 This presentation includes predictive information that is intended to be made as
“forward-looking” within the safe harbor protections of the Private Securities Litigation Reform Act of 1995. Although the Company believes that its forward-looking
information is based on reasonable assumptions, such information is subject
to risks and uncertainties, which could cause materially different
results. Important factors that could cause actual results to differ
materially from those in the forward-looking information are set forth
in the Company’s most recent Annual Report and reports on Form 10-K and 10-Q, and news releases filed with the Securities and Exchange Commission.
All reports and news releases are available on Cliffs’ website www.cliffsnaturalresources.com. |
 OPERATIONAL EXCELLENCE | A WORLD LEADER | STEWARDSHIP Cliffs Natural Resources Inc. Overview JC |
 OPERATIONAL EXCELLENCE | A WORLD LEADER | STEWARDSHIP 3 Overview of Cliffs Natural Resources Inc. Cliffs Natural Resources (NYSE: CLF) is an international mining and natural resources
company. We are the largest producer of iron ore pellets in North America,
a major supplier of direct-shipping lump and fines iron ore out of
Australia and a significant producer of metallurgical coal. With core values of environmental and capital stewardship, our colleagues across the
globe endeavor to provide all stakeholders operating and financial
transparency as embodied in the Global Reporting Initiative (GRI)
framework. Cliffs is executing a strategy designed to achieve scale and
focused on serving the world’s largest and fastest growing steel
markets. The Company boasts a conservatively managed balance sheet with low
debt and strong liquidity. |
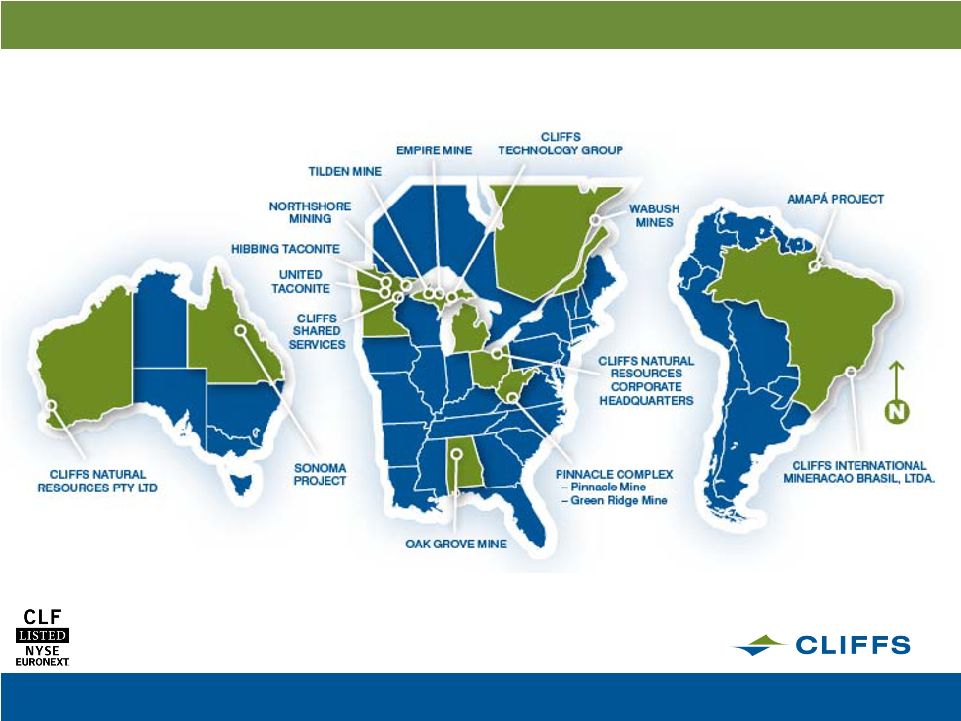 OPERATIONAL EXCELLENCE | A WORLD LEADER | STEWARDSHIP 4 Cliffs Natural Resources Global Footprint |
 OPERATIONAL EXCELLENCE | A WORLD LEADER | STEWARDSHIP 5 Current Market Information Metals & Mining Sector $3.6 Billion in 2008 Revenues $2 Billion Market Capitalization 113.5MM shares outstanding, ~5MM in NYSE average volume per day 2% Dividend Yield Over 80% institutionally held, 60% by top 25 institutions, 2% insiders Ownership concentrated in North America (95%) and Europe (5%) Over 75% call themselves “value” investors |
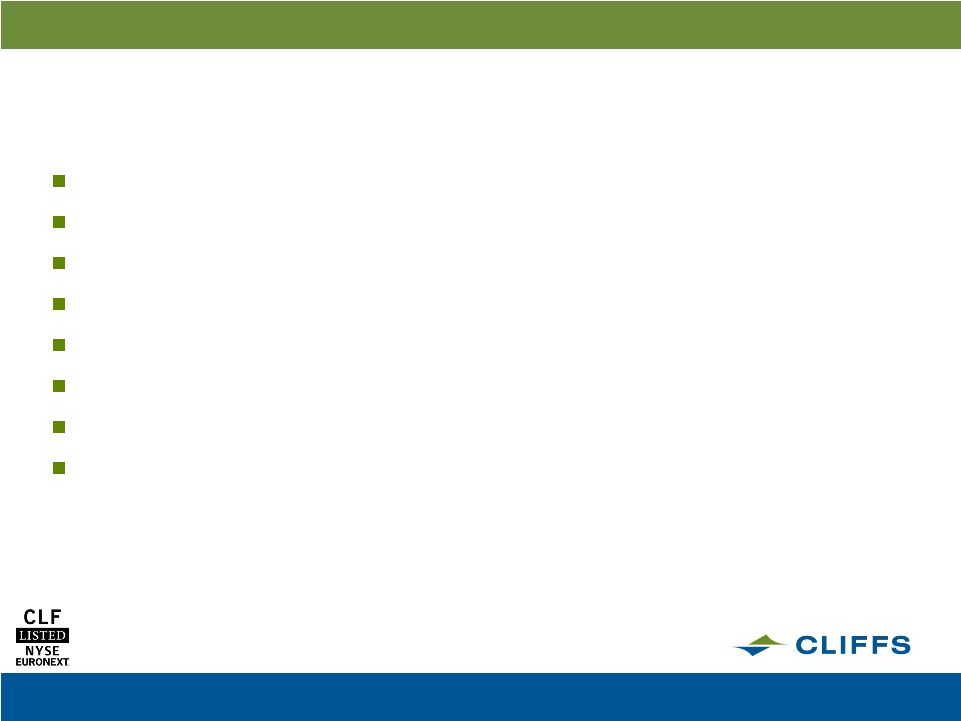
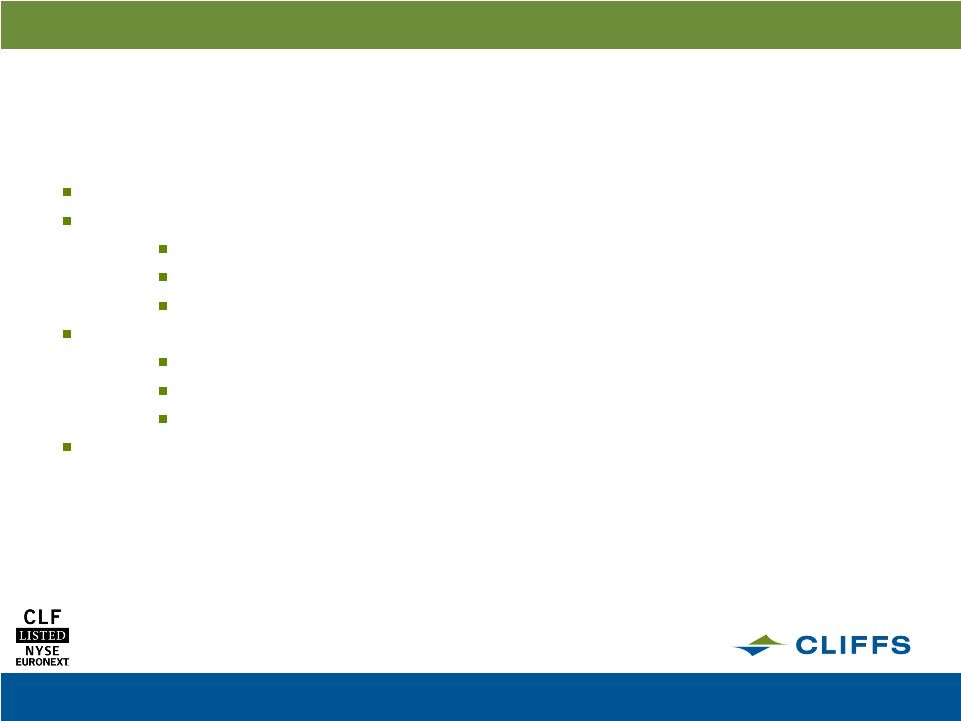
 OPERATIONAL EXCELLENCE | A WORLD LEADER | STEWARDSHIP 6 Cliffs’ Strategic Imperatives Scale Through Diversification Shareholder Returns Global Execution Operational Excellence Building Scale Through Diversification Multiple Revenue Streams Product Diversification Geographic Presence Operational Excellence Safety Technical Competencies Operating Efficiencies Global Execution Competencies of the Firm Outlook of Personnel Global Scalability Shareholder Returns Shareholder Value Risk Management “Earning the Right to Grow” |
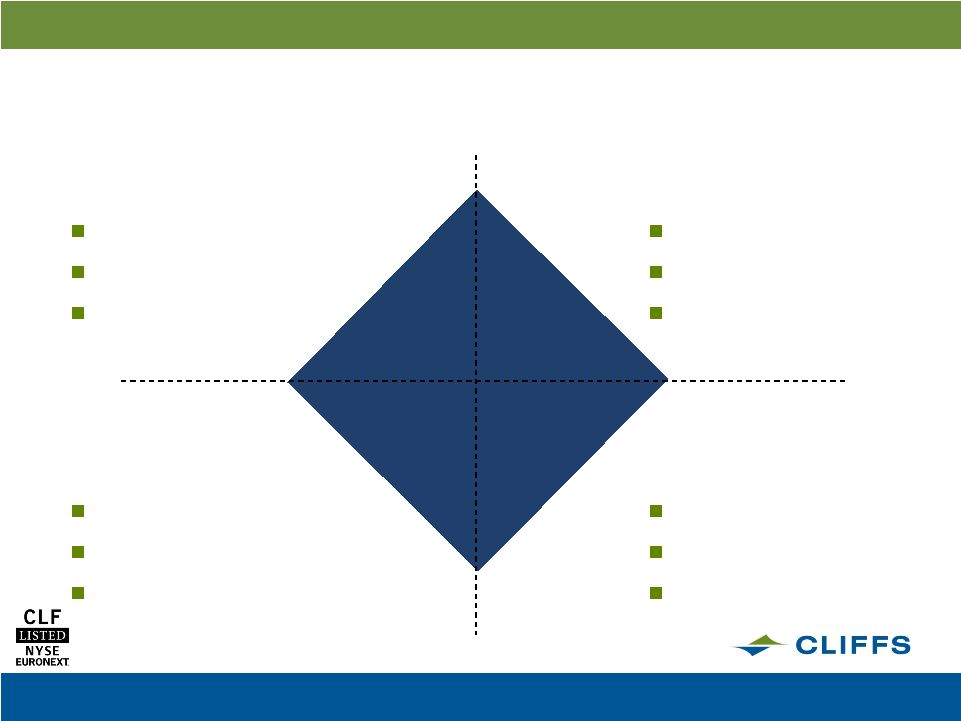
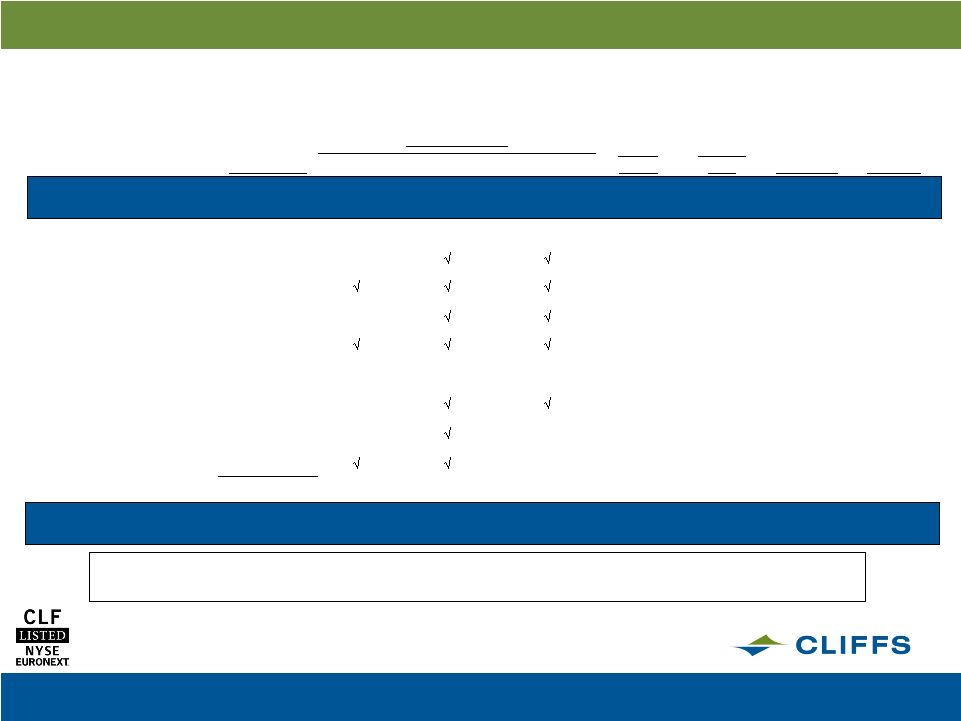
 OPERATIONAL EXCELLENCE | A WORLD LEADER | STEWARDSHIP 7 Cliffs’ Strategy: Geographic and Mineral Diversification GEOGRAPHIES MINERALS • MANGANESE • MOLYBDENUM • FERRO CHROME OTHER LATIN AMERICAN COUNTRIES NORTH AMERICA ASIA-PACIFIC (AUSTRALIA) LATIN AMERICA (BRAZIL) NORTH AMERICAN MET COAL SEABORNE IRON ORE IRON ORE SEABORNE MET COAL |
 OPERATIONAL EXCELLENCE | A WORLD LEADER | STEWARDSHIP 8 Cliffs’ Strategy Maintain the core: North American Iron Ore Expand globally and diversify products - North American Coal - Cliffs Asia Pacific Business Unit - Cliffs Latin American Business Unit Consistently exhibit leadership in sustainable development best practices Capitalize on Company’s unique technological expertise - Concentrating and processing lower-grade ores into high-quality products
- Partnering with Kobe Steel to use its ITmk3 technology |
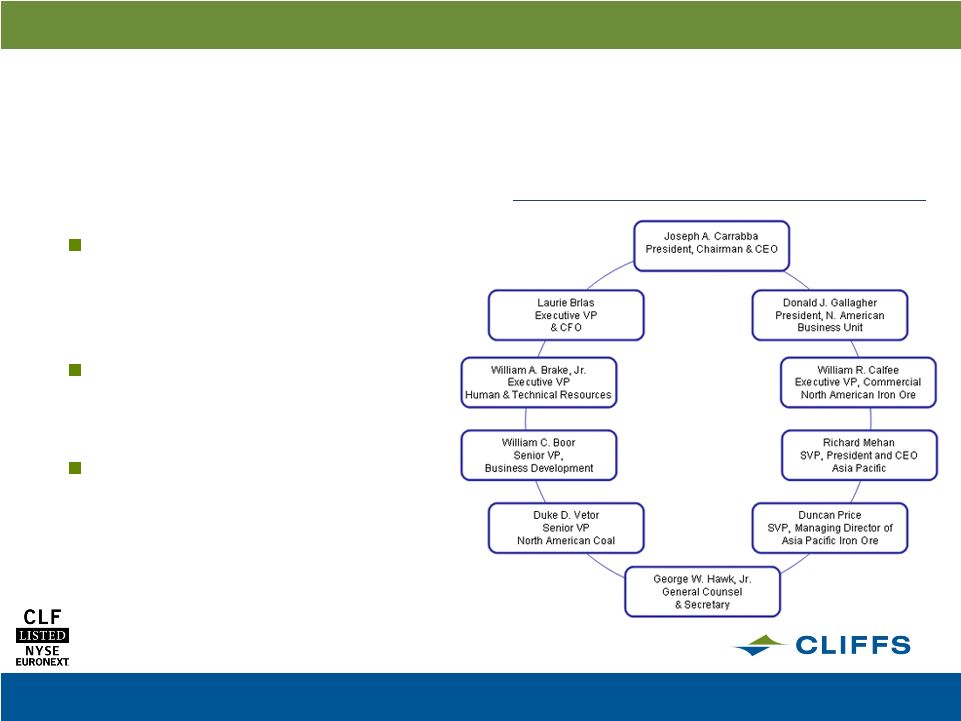 OPERATIONAL EXCELLENCE | A WORLD LEADER | STEWARDSHIP 9 High Corporate Governance Standards Cliffs Corporate Governance Performance outranked 98.2% of S&P 400 companies and 98.6% of materials companies in 2008* Strong and knowledgeable 10-person Board of Directors; 9 Directors are independent 5 dedicated Board oversight committees monitor critical areas of Company business Cliffs Management Team * Source: Survey by Institutional Shareholder Services |
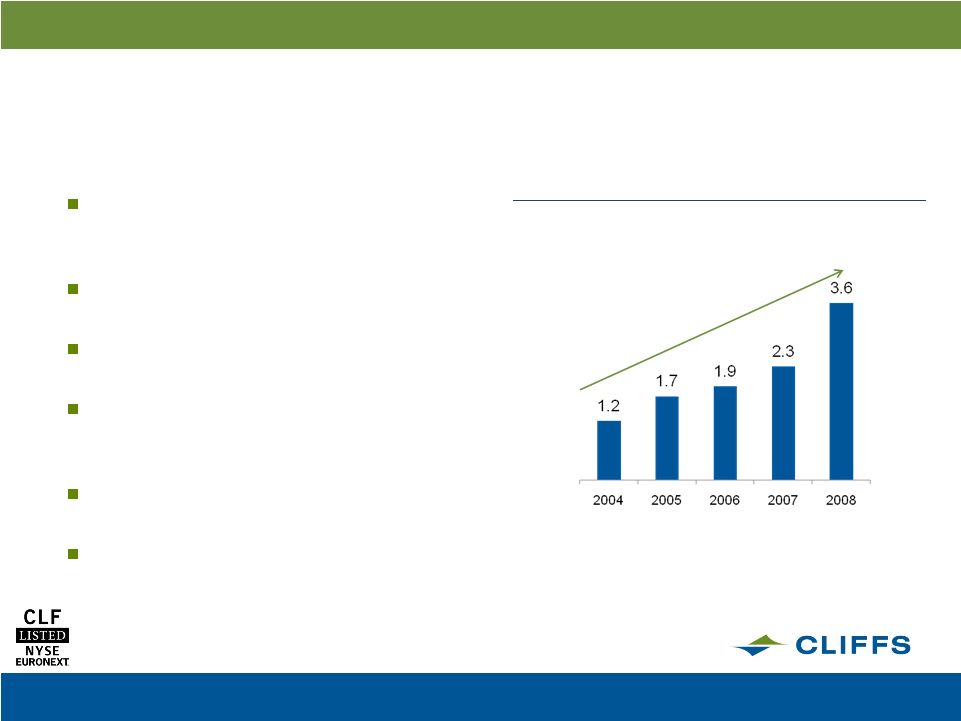 OPERATIONAL EXCELLENCE | A WORLD LEADER | STEWARDSHIP 10 Transformation into International Mining Entity & Merchant Restructured in 2002 to better acquire & expand capacity domestically & seek opportunities in international markets Acquires Portman Limited, Australia’s then 3 largest iron ore miner, in 2005 Expands into Latin America in 2006 with 30% ownership of Brazilian Amapa iron ore project Diversifies into coal in 2007 with 45% economic interest in Sonoma Project, Australian thermal & coking coal Acquires PinnOak Resources, premium quality U.S. metallurgical coal producer, in 2007 Selects Michigan site for Iron Nugget Project plant in 2007 Total revenue growth ($ b) CAGR=+31.6% rd |
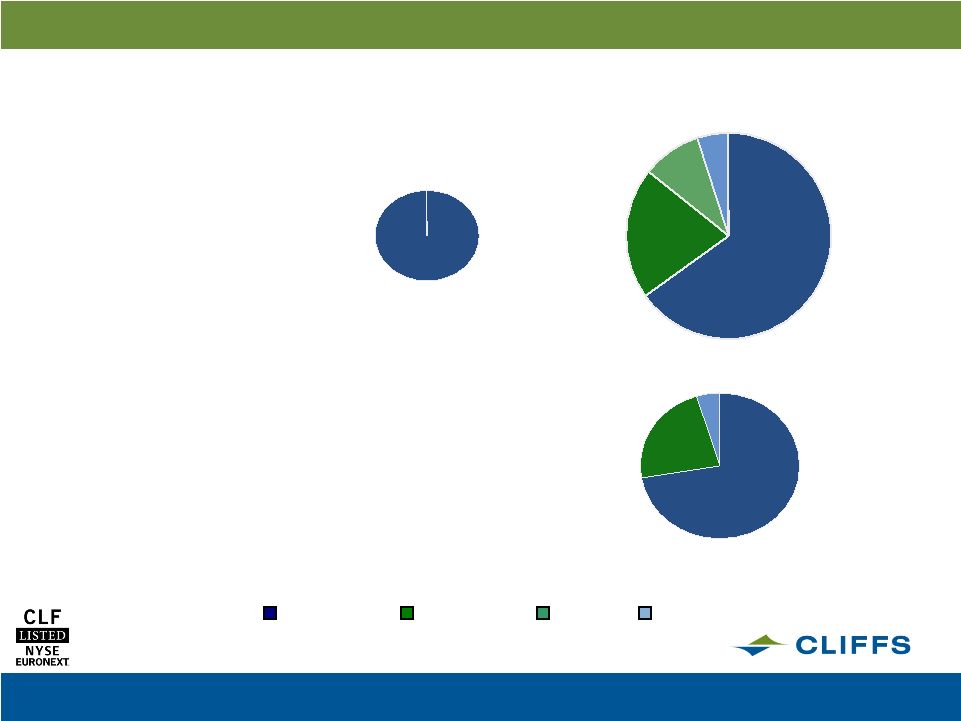
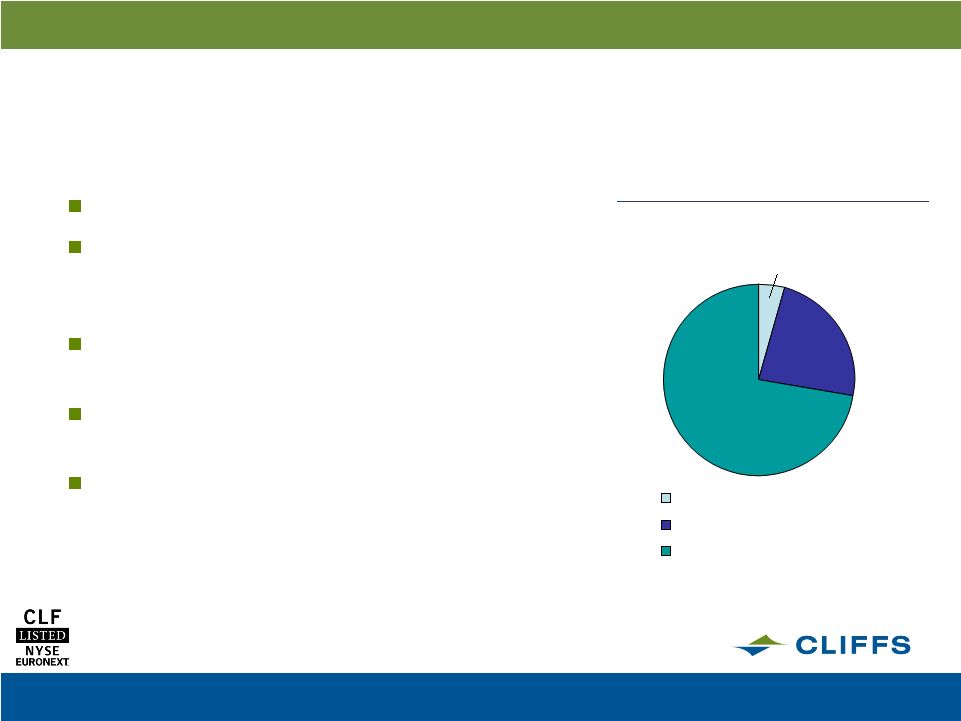 OPERATIONAL EXCELLENCE | A WORLD LEADER | STEWARDSHIP 11 Human Resources 5,711 employees worldwide Strong commitment to continuous safety improvement reflected in corporate mission and core values In 2007, reported a company-low 1.93 Mine Safety & Health Admin. (MSHA) reportable injury frequency rate Committed to geographical expansion in areas of political stability Foundation activities actively support educational institutions and development projects in communities where Cliffs operates Employees breakdown 258 (5%) 1322 (23%) 4131 (72%) Corporate & Support Salaried Business Units Labor Force |
 OPERATIONAL EXCELLENCE | A WORLD LEADER | STEWARDSHIP 12 Sustainable Development Integral to Success in Industry Mines managed by Cliffs interact with federal and state agencies to ensure operations meet or exceed land, air & water quality standards Consistently and uniformly evaluates performance against ISO 14001 standards Cliffs’ subsidiary, renewaFUEL, produces high-energy, low-emission biofuel cubes for renewable resources Founding reporter of The Climate Registry Cliffs will publish first Sustainable Development Report in 2009, in accordance with Global Reporting Initiative Standards |
 OPERATIONAL EXCELLENCE | A WORLD LEADER | STEWARDSHIP Cliffs Natural Resources 2008 Consolidated Results Overview LB |
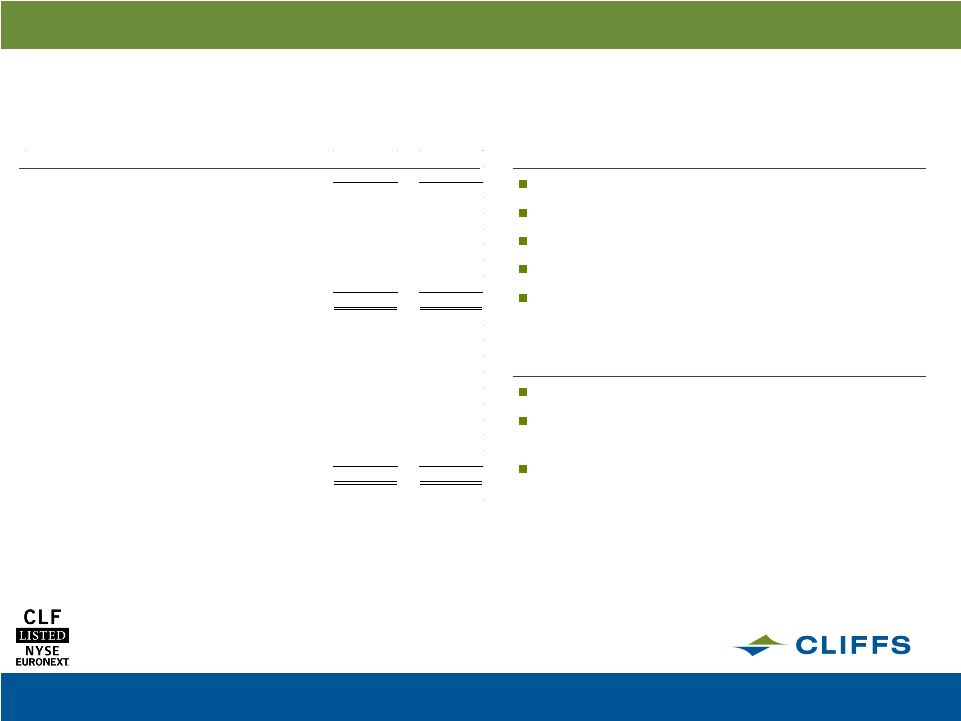
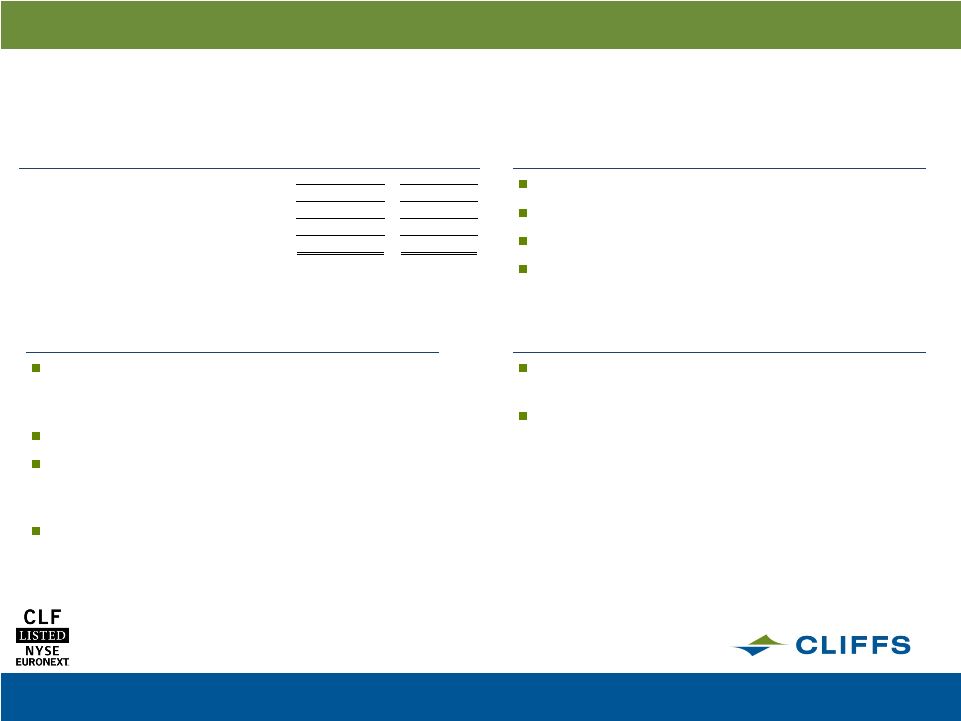
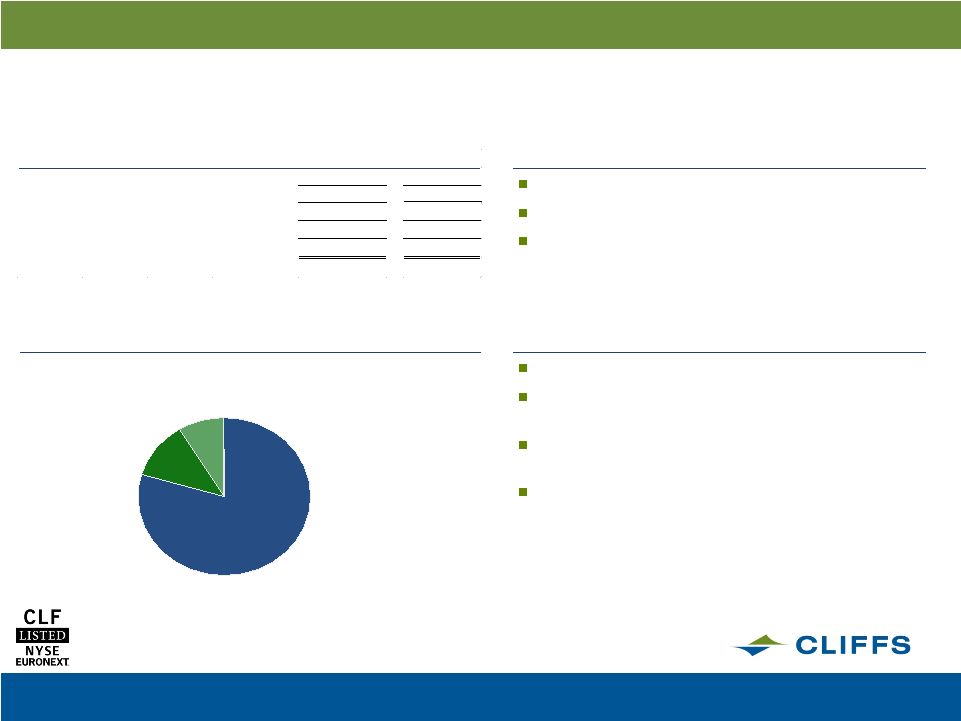 OPERATIONAL EXCELLENCE | A WORLD LEADER | STEWARDSHIP 2008 Consolidated Profit & Loss Results Drivers Strong iron ore and coal pricing throughout 2008 Sales contribution from North American and Australian coal businesses Unique structural design of North American Iron Ore supply agreements Non-recurring items from Alpha deal termination, mark-to- market adjustments for hedging program and limited asset impairments Highlights Full-Year revenues increase 59% to $3.6 billion Earnings per diluted share increase 85% to $4.76 Cash from operations increase of 195% to $853 million Iron Ore 80% 2008 Revenues by Type Freight & Other 9% Coal 12% P&L 14 2008 2007 REVENUES 3,609.1 2,275.2 SALES MARGIN 1,159.7 462.0 OPERATING INCOME 938.9 381.6 EARNINGS PER DILUTED SHARE 4.76 $ 2.57 $ Year |
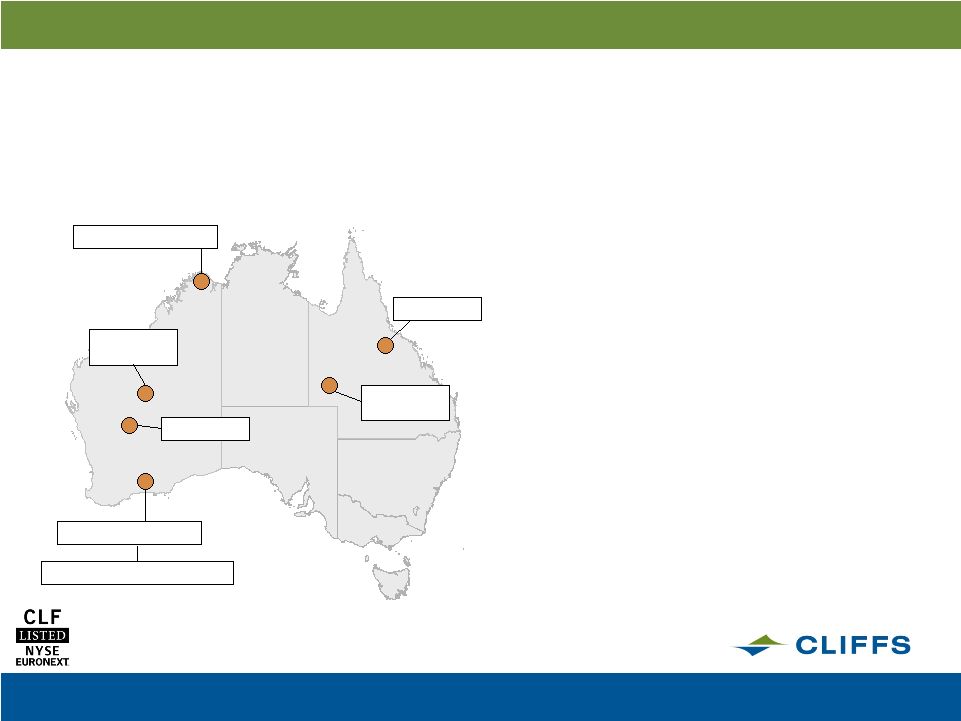 OPERATIONAL EXCELLENCE | A WORLD LEADER | STEWARDSHIP 15 Strategies – What we have already accomplished Asia Pacific Strategy 1 Step: In 2005, purchased 80% of Portman Limited Cockatoo Island Koolyanobbing Created Diversification Options • Sonoma (45%) • AusQuest (30%) Sonoma AusQuest – Diamantina AusQuest – Table Hill Created Growth Options • Added Portman Koolyanobbing Reserves • Bought GoldenWest Stake (16.96%) • Cockatoo Island Expansion • Purchased the remaining 20% of Portman Golden West Koolyanobbing Reserves st |
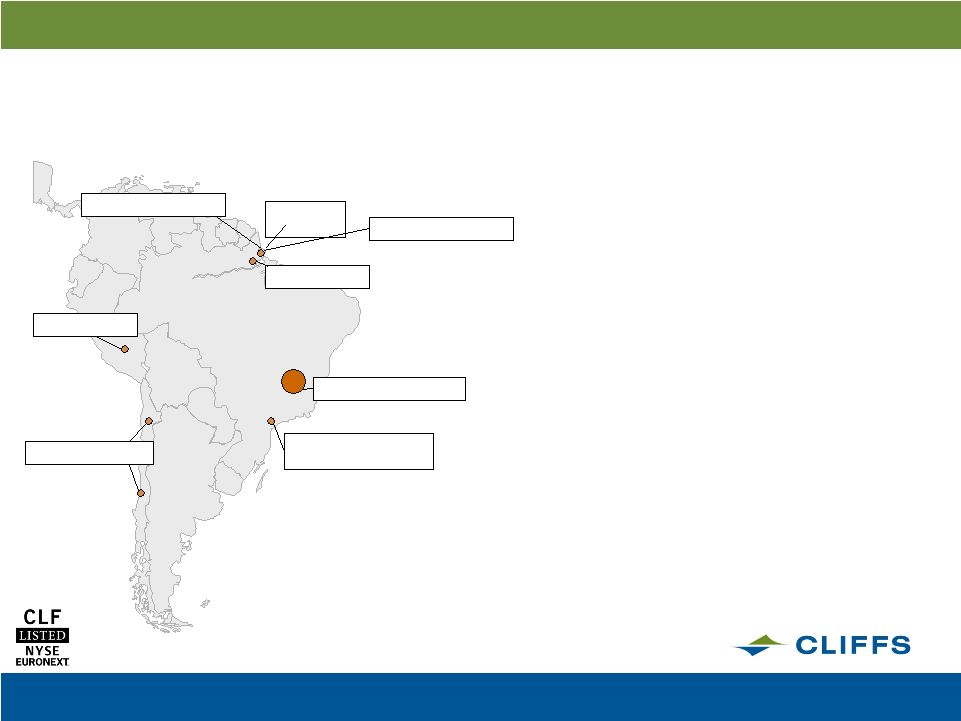 OPERATIONAL EXCELLENCE | A WORLD LEADER | STEWARDSHIP 16 Strategies – What we have already accomplished Latin America Strategy 1 Step: Took 30% Interest in Amapa Project Amapa Project Cliffs International Mineracao Brazil, LTDA Opened Rio Business Development Office Created Growth Options • Near Amapa Opportunities • Amapa Reserves • Minas Gerais Opportunities Minas Gerais Opportunities Nearby Prospects Amapa Reserves Created Diversification Options • Peru Opportunities • Chilean Opportunities • Manganese Opportunities Chilean Opportunities Peru Prospects Manganese Opportunities st |
 OPERATIONAL EXCELLENCE | A WORLD LEADER | STEWARDSHIP 17 Strategies – What we have already accomplished Central Appalachian Metallurgical Coal Strategy Operational execution has been disappointing However, acquisition provided solid platform in a mineral with attractive fundamentals A scarce resource Smaller and smaller mines being exploited Older mines shutting down Limited mountaintop mining expected to come “online” due to environmental concerns Increasing Barriers 404 water permit requirements Increasing cost of safety compliance Our strategy going forward is to focus on asset prioritization versus company targeting
|
 OPERATIONAL EXCELLENCE | A WORLD LEADER | STEWARDSHIP Customer Geography Industry $ 2,907 $ 535 Market Cap $931 $3,609 $ 4,111 $2,125 Cliffs in 2008 19 2008 Ausquest 22 2008 Golden West 485 2008 Portman 20% 269 2008 UTAC 497 2007 PinnOak 280 2007 Amapa 120 2007 Sonoma $ 433 2005 Portman 80% -- $825 $ 882 Cliffs in 2003 EBITDA Revenue Asset Value Diversification Investment Effect of Diversification - As a North American Iron Ore only company, we would have been subjected to a >40% drop in steel production. Global production has fallen
approximately 15% 18 Strategies – What we have already accomplished |
 OPERATIONAL EXCELLENCE | A WORLD LEADER | STEWARDSHIP Value of Diversification 19 19 2003 Revenue in millions 2008* Sales Margin in millions $825 Sales Margin was ($10) NA Iron Ore NA Coal AP Iron Ore AP Coal $2,370 $770 $346 $123 * In 2008 North American Coal had a sales margin loss of $46 million $804 $349 $53 |
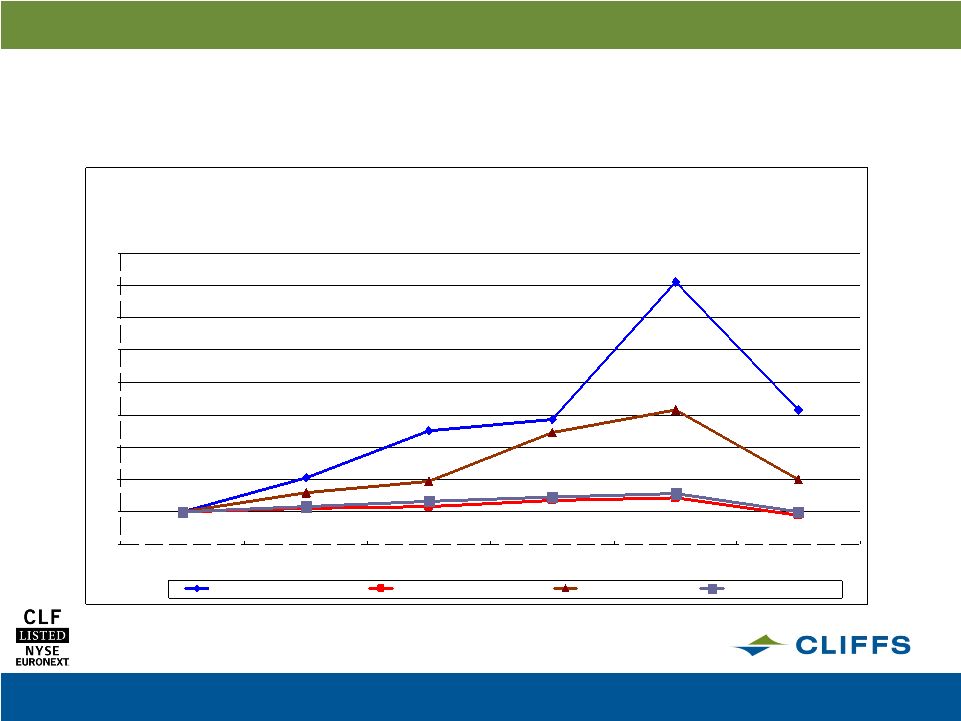 OPERATIONAL EXCELLENCE | A WORLD LEADER | STEWARDSHIP 20 Strategic Direction Set in 2003 has Significantly Paid off for Shareholders Comparison of 5 Year Cumulative Total Return Assumes Initial Investment of $100 December 2008 0 100 200 300 400 500 600 700 800 900 Dec-2003 Dec-2004 Dec-2005 Dec-2006 Dec-2007 Dec-2008 Cliffs Natural Resources Inc. S&P 500 Index Total Returns S&P 500 Steel Index S&P MidCap 400 Index |
 OPERATIONAL EXCELLENCE | A WORLD LEADER | STEWARDSHIP 2008 Year End Balance Sheet Results Drivers Current focus on cash generation and preservation Curtailment of production to avoid putting cash into inventory Strict management of capital expenditures ($183 million vs. $240 million expectation) Highlights $179.0 million of cash and equivalents at year end No borrowing drawn on $600 million credit facility $525 million in long-term borrowings No major commitments due until 2012 Pension obligation and 2009 cash contribution extremely manageable Select Balance Sheet Items 21 Year 2008 2007 ASSETS Cash and Equivalents 179.0 $ 157.1 $ Inventories 265.4 241.9 TOTAL CURRENT ASSETS 861.7 754.6 PROPERTY, PLANT AND EQUIPMENT, NET 2,456.1 1,823.9 TOTAL ASSETS 4,111.1 $ 3,075.8 $ LIABILITIES AND SHAREHOLDERS' EQUITY TOTAL CURRENT LIABILITIES 844.9 399.6 PENSION AND OTHER POSTRETIREMENT BENEFITS 448.0 204.8 ENVIRONMENTAL AND MINE CLOSURE OBLIGATIONS 104.9 123.2 SENIOR NOTES 325.0 - REVOLVING CREDIT FACILITY - 240.0 TERM LOAN 200.0 200.0 TOTAL LIABILITIES 2,357.1 1,659.6 SHAREHOLDERS' EQUITY 1,750.5 1,163.7 TOTAL LIABILITIES AND SHAREHOLDERS' EQUITY 4,111.1 $ 3,075.8 $ |
 OPERATIONAL EXCELLENCE | A WORLD LEADER | STEWARDSHIP Cliffs Natural Resources North American Iron Ore LB |
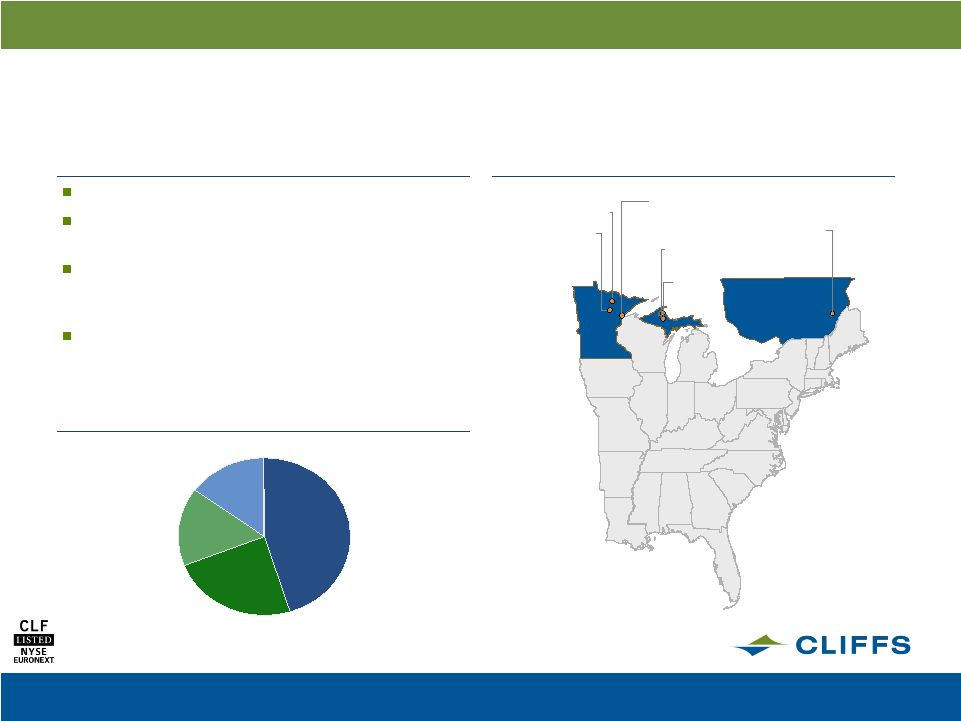 OPERATIONAL EXCELLENCE | A WORLD LEADER | STEWARDSHIP 23 Source: Company data Business Overview North America’s largest supplier of iron ore pellets Customer base includes nearly all U.S.-based, integrated steel producers North American Iron Ore mines managed by Cliffs currently have a rated capacity of 38.1 million tons of iron ore pellet production annually (~25 million equity tons) Over 950 million tons of proven and probable reserves North American Iron Ore Segment Cliffs Managed 46% North America Pellet Producers U.S. Steel 24% Iron Ore Company of Canada 16% Arcelor Mittal¹ 14% Hibbing Taconite United Taconite Northshore Mining Empire Mine Tilden Mine Wabush Mine Geographic Overview Ownership is composed of Arcelor Mittal Mines 11% and Minorca
4% 1 |
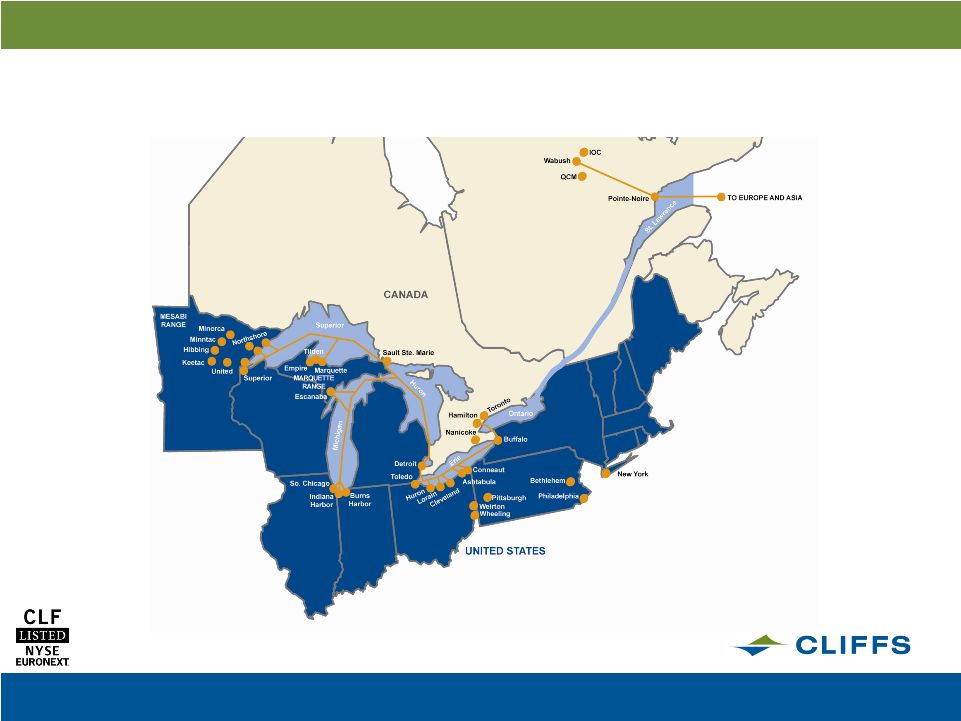 OPERATIONAL EXCELLENCE | A WORLD LEADER | STEWARDSHIP 24 North American Iron Ore Shipping Routes |
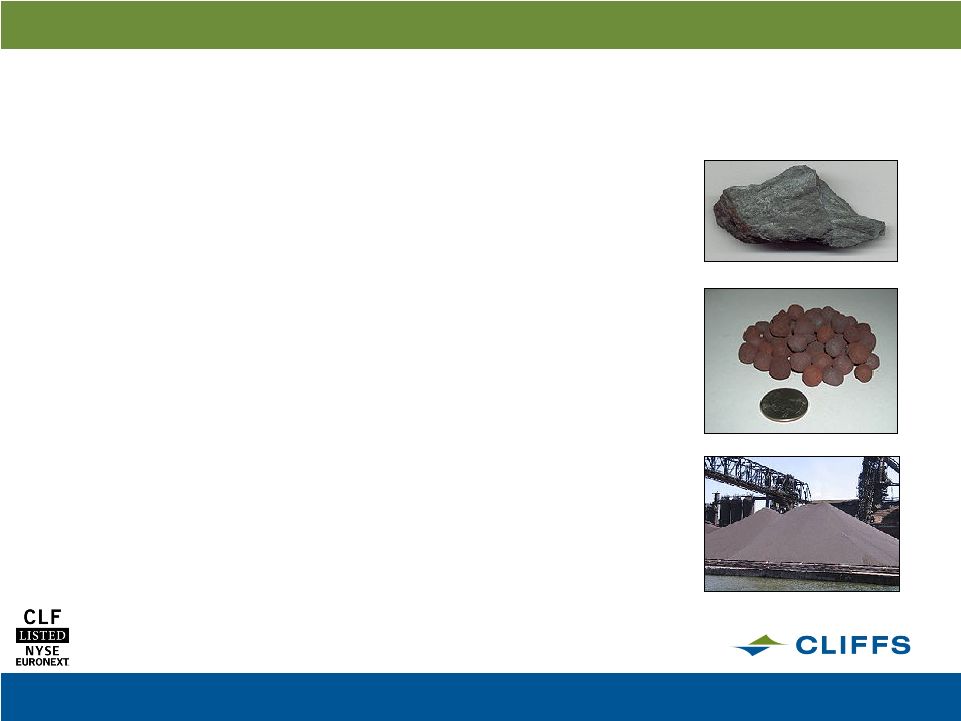 OPERATIONAL EXCELLENCE | A WORLD LEADER | STEWARDSHIP North American Iron Ore Pellet Process 1. Use explosives, giant electric drills, shovels and industrial trucks to open-pit mine <30% iron content ore 2. Crush and screen (reduce raw ore from the size of a Peugeot automobile to the consistency of face powder). 3. Employ magnetic or floatation techniques to liberate iron from waste product
(silica) 4. Beneficiation to >59% iron ore concentrate 5. Mix with binding agent (clay). Add limestone or dolomite to create premium “fluxed” product. Rotating drums roll concentrate into “green balls,” or unfired pellets 6. Fire in a giant rotary kiln fueled by natural gas or coal. 7. Stockpile and load into rail cars or Great Lake vessels to deliver to point of
consumption 25 |
 OPERATIONAL EXCELLENCE | A WORLD LEADER | STEWARDSHIP North American Iron Ore Business Model and Pellet Contracts NAIO Business Model Market is comprised of 38 blast furnaces in North America (29 United States, 7 Canada
and 2 Mexico) Customer consolidation: ArcelorMittal, SeverStal, Algoma
(Essar) and U.S. Steel Canada Transportation: Great Lakes ore vessels
Imports/exports geographically limited by St. Lawrence Seaway Cliffs reports revenues per long ton (1.016 metric ton, 1016 kilograms) NAIO Pellet Contracts Virtually 100% of 2009 sales volume is committed under long-term contracts
Weighted average term of North American Iron Ore contracts is six years Depending on the contract, annual price per ton of pellets is adjusted on a variety of
factors. Typical structure would include: Factor related to international pellet price settlement (negotiated by Vale)
Vale, Eastern Canada or LKAB pellet price Factor related to steel pricing U.S. PPI for Cold-Rolled Steel or Hot Rolled Steel Customer Hot Rolled Coil selling price at blast furnace (mix of spot/contract
sales) Factor related to Cliffs production costs (to reflect energy
intensity) U.S. PPI for Industrial Commodities U.S. PPI for Fuel and Power U.S. PPI for Fuel and Related Products 26 |
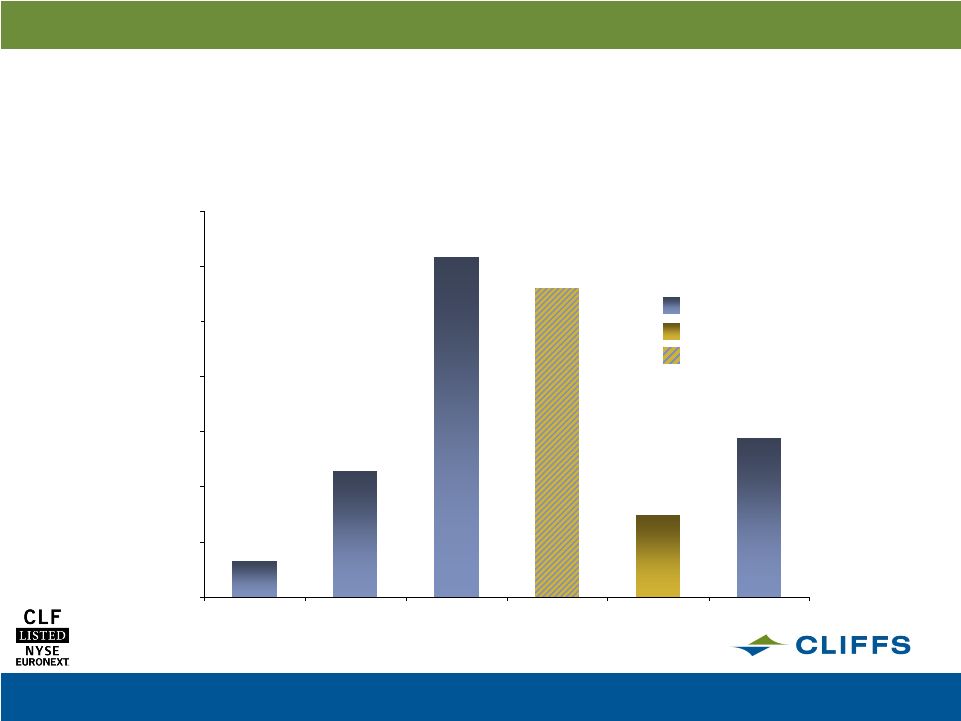 OPERATIONAL EXCELLENCE | A WORLD LEADER | STEWARDSHIP 33 114 308 280 75 144 0 50 100 150 200 250 300 350 Empire Hibbing Northshore Tilden Wabush United Taconite (Million Tons) North American Iron Ore Reserves Magnetite Hematite Combination of Hematite, and Magnetite 27 |
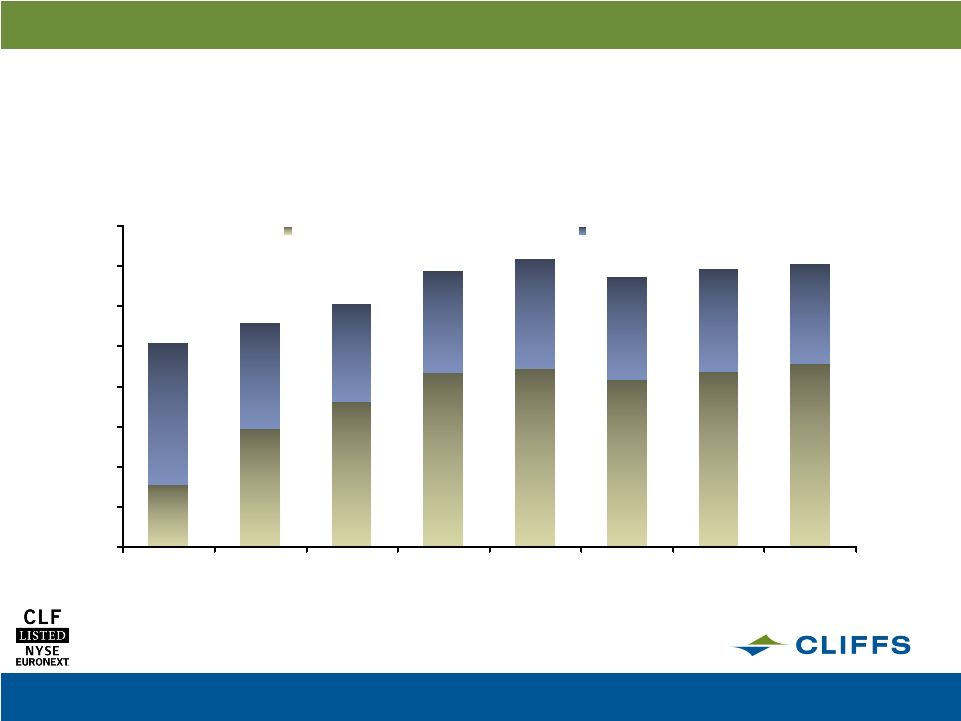 OPERATIONAL EXCELLENCE | A WORLD LEADER | STEWARDSHIP (Million Gross Tons) 7.8 14.7 18.1 21.7 22.1 20.8 21.8 22.9 17.6 13.2 12.2 12.7 13.8 12.8 12.8 12.3 0 5 10 15 20 25 30 35 40 2001 2002 2003 2004 2005* 2006 2007 2008 Cliffs' NA Equity Production NA Non-Equity Production North American Iron Ore Equity Production 28 |
 OPERATIONAL EXCELLENCE | A WORLD LEADER | STEWARDSHIP 2008 2007 SALES VOLUME (Long tons in millions) 22.7 22.3 REVENUE PER TON 92.56 $ 66.01 $ COST PER TON 57.12 48.14 SALES MARGIN PER TON 35.45 $ 17.87 $ Year North American Iron Ore Results & Outlook 2009 NAIO Outlook Contractual obligations for 19 million tons in sales volume No per-ton revenue guidance as blast furnace pellet benchmark has not yet settled, although will benefit from supply agreement lag year adjustments and floors Currently producing annualized rate of 15 million equity tons Deleveraging of fixed costs expected to result in higher per ton costs of $70 - $80 Highlights Equity production reached 23 million tons Revenues per ton up 40% Sales margin per ton up 98% 2008 Results Results Drivers Factors in formula based supply agreements up throughout most of 2008 (iron ore and steel factors) Cost per ton up 19% as a result of Michigan expansion project, energy costs and higher labor costs from USW agreement Collected cash for 1.2 million tons not shipped – contractual obligations from customers 29 |
 OPERATIONAL EXCELLENCE | A WORLD LEADER | STEWARDSHIP Cliffs Natural Resources North American Coal JC |
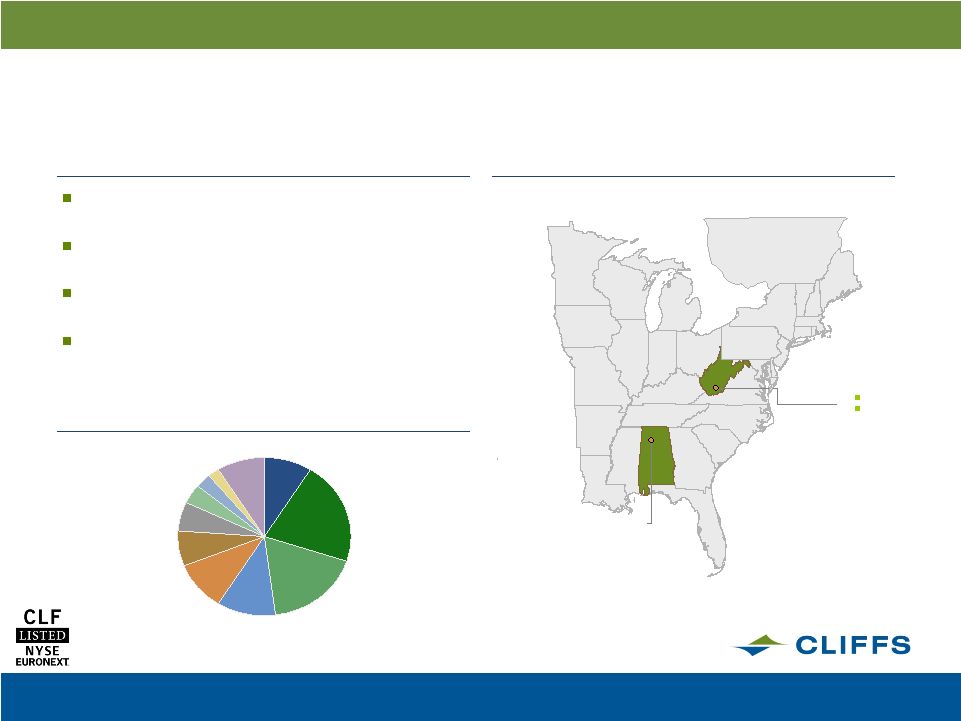 OPERATIONAL EXCELLENCE | A WORLD LEADER | STEWARDSHIP 31 Source: Company data Business Overview Domestic producer of high-quality, low-volatility metallurgical coal with significant production sold to international markets Three underground mines: Pinnacle Complex in West Virginia, Oak Grove in Alabama Positioned near rail or barge lines providing access to international shipping ports Over 240MM tons of in-place proven and probable reserves North American Coal Segment Alpha Natural Resources 21% U.S. Metallurgical Coal Producers Geographic Overview Oak Grove Mine Pinnacle Complex Pinnacle Mine Green Ridge Mine Massey Energy 18% Walter Resources 11% Patriot Coal 10% Cliffs 9% CONSOL 7% United Coal Corp. 6% Arch Coal 4% Foundation Coal 3% Sun Coke 2% All Others 9% |
 OPERATIONAL EXCELLENCE | A WORLD LEADER | STEWARDSHIP North American Coal Business Model Customers include U.S. and international steel producers with a historic split of 50/50% Coal typically sold on one-year contracts starting Jan. 1 for U.S. customers and April 1 for
international customers Transportation: Rail to point of consumption or port (Newport News, VA and Mobile, AL) Cliffs reports coal revenue per short ton (0.9072 metric tons, 907.2 kilograms) at mine mouth vs.
BHP hard coking coal benchmark sold as metric ton at the port 32 |
 OPERATIONAL EXCELLENCE | A WORLD LEADER | STEWARDSHIP 2008 2007 SALES VOLUME (Short tons in millions) 3.2 1.2 REVENUE PER TON 92.95 $ 70.77 $ COST PER TON 107.27 97.83 SALES MARGIN PER TON (14.32) $ (27.07) $ Year North American Coal Results & Outlook 2009 NAC Outlook At Feb. 25, 2009 had 1.6 million tons under contractual obligation Average expected realization of contracted tons is $108 per ton Highlights Acquired in July 2007 Revenues per ton up 31% Production of 3.5 million tons Continued progress in areas of safety, sales and marketing 2008 Results 2008 Results Drivers Prices for metallurgical coal spiked over $300 per ton on the spot market in 2008, driven by supply-side constraints including flooding in Queensland, Australia Recapitalization efforts continue Throughout 2008 costs were impacted by extended long- term mine planning and development, as well as hiring and training of miners, and increased royalty expenses Goal of planning and development work is to drive future production and lower costs 33 |
 OPERATIONAL EXCELLENCE | A WORLD LEADER | STEWARDSHIP Cliffs Natural Resources Asia Pacific Iron Ore LB |
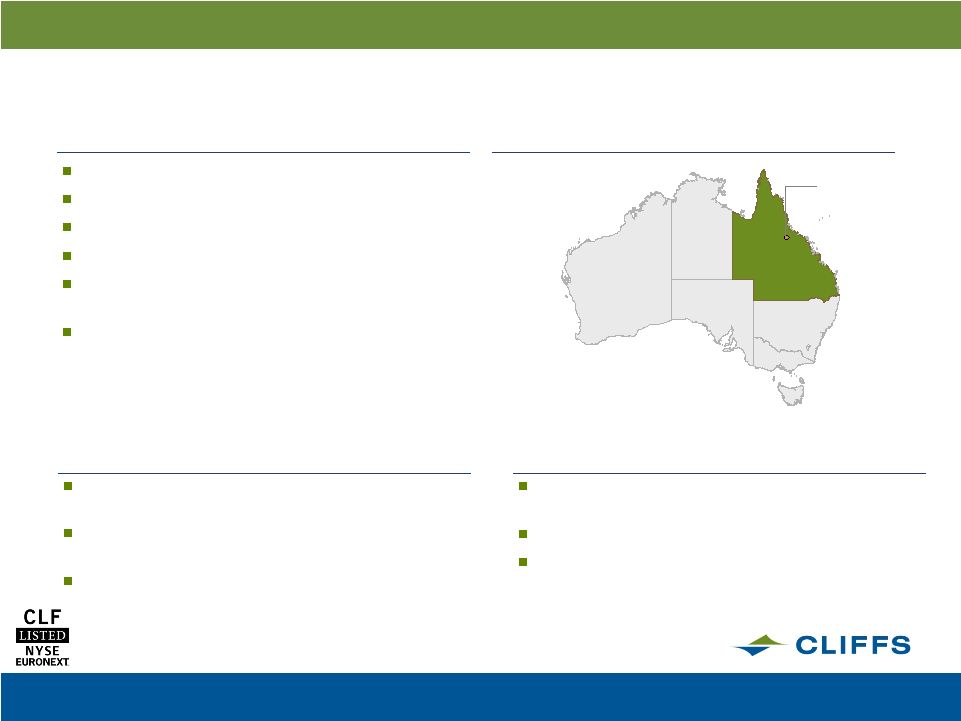
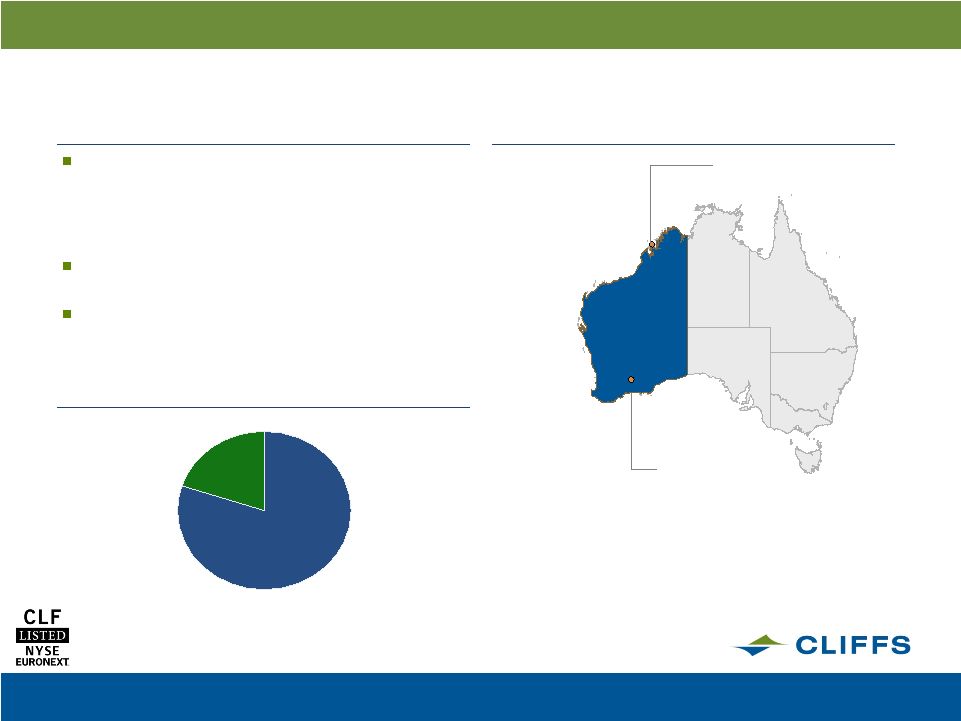 OPERATIONAL EXCELLENCE | A WORLD LEADER | STEWARDSHIP 35 Source: Company data Business Overview Asia Pacific Iron Ore operations located in Western Australia: – Koolyanobbing mine (100% owned) – Cockatoo Island Joint Venture (50% owned) Serves the Asian iron ore markets with direct-shipping fines and lump ore Over 90MM tonnes of reserves Asia Pacific Iron Ore Segment China 76% Customer Overview Geographic Overview Cockatoo Island Koolyanobbing Japan 24% |
 OPERATIONAL EXCELLENCE | A WORLD LEADER | STEWARDSHIP Asia Pacific Iron Ore Business Model Diverse customer base include steel producers in China and Japan with a 2008 split of 74/26% No single customer accounted for more than 10% of APIO sales in 2008 Contracts are five-year term supply agreements with volume partially dependent on customer
requirements Price per ton determined with Australian benchmarks for lump and fines ore Historic product lump vs. fines mix approx. 50/50% Most Chinese customer contracts begin Jan. 1 Japanese contracts begin April 1 Transportation: Koolyanobbing rails to Port of Esperance, one of the least congested ports in Australia Cliffs reports APIO revenues per metric ton (1,000 kilograms) 36 |
 OPERATIONAL EXCELLENCE | A WORLD LEADER | STEWARDSHIP 2008 2007 SALES VOLUME (Metric tons in millions) 7.8 8.1 REVENUE PER TON 98.69 $ 54.59 $ COST PER TON 54.00 42.83 SALES MARGIN PER TON 44.69 $ 11.76 $ Year Asia Pacific Iron Ore Results & Outlook 2009 APIO Outlook Market in Asia showing signs of rebounding from lows witnessed in fourth quarter of 2008 Expected 2009 sales volume of 8.4 million tonnes No 2009 settlement in sight, though expected to be down Cost per tonne of $50 - $60 Highlights Sales volume of 7.8 million tonnes, despite limited production from Cockatoo Island joint venture Revenues per tonne up 81% Sales margin per tonne up 280% 2008 Results 2008 Results Drivers Strong demand from China and rest of Asia for majority of year Australian benchmark pricing for lump and fines up 97% and 80% respectively in 2008 Cost per ton up 19%, negatively impacted by unfavorable currency exchange throughout majority of 2008, stockpile movements and higher royalty and mining costs 37 |
 OPERATIONAL EXCELLENCE | A WORLD LEADER | STEWARDSHIP Reserves Position Measured/Indicated 73.6 Mt Inferred
104.5 Mt Conceptual
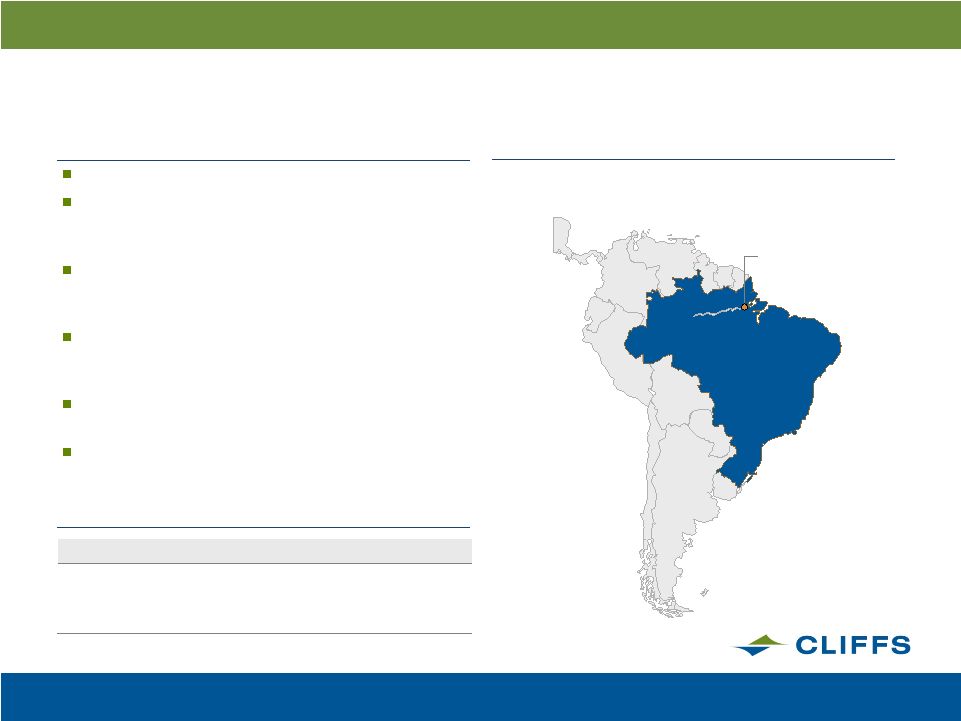
150.0 Mt 38 Source: Company data Business Overview 30% owned by Cliffs, 70% owned by Anglo American Consists of a significant iron ore deposit, a 192-kilometer railway connecting mine to port, and 71 hectares of real estate for a loading terminal Majority of production committed under long-term supply agreement with operator of an iron oxide pelletizing plant in Bahrain Ramping up to design capacity of 6.5 Mtpa, 2008 ramp-up significantly slower than expected with annual production or 1.2 Mt. $35 million equity loss in 2008, expected $50 - $60 million equity loss in 2009 Anglo, together with Cliffs, studying all aspects of the mine and taking proactive steps to ensure production ramped Amapá Project Reserves Overview Geographic Overview Amapá Project |
 OPERATIONAL EXCELLENCE | A WORLD LEADER | STEWARDSHIP 39 Business Overview 45% economic interest, ramped up in 2008 2008 equity sales volume: 933M tonnes ~27 million tonnes of reserves Mix of hard coking and thermal coal Supply agreements in place with JFE, China Steel (met) and a Korean utility (thermal) Moves by rail to the Abbot Point Bulk Coal Terminal for export Sonoma Project Geographic Overview Sonoma 2009 Sonoma Outlook Total production of 3.5 million tonnes, 3.3 million tonnes of sales volume Approximately 60% thermal, 40% metallurgical Per tonne costs of $85 - $95 2008 Results and Drivers Contributed $123 million to sales and $53 million to sales margin in 2008 Strong demand from China and rest of Asia for majority of year Prices for coal strong throughout 2008 driven by supply- side constraints including flooding in Queensland and demand for power generation in South Africa |
 OPERATIONAL EXCELLENCE | A WORLD LEADER | STEWARDSHIP Cliffs Natural Resources Macro Economic Dynamics JC |
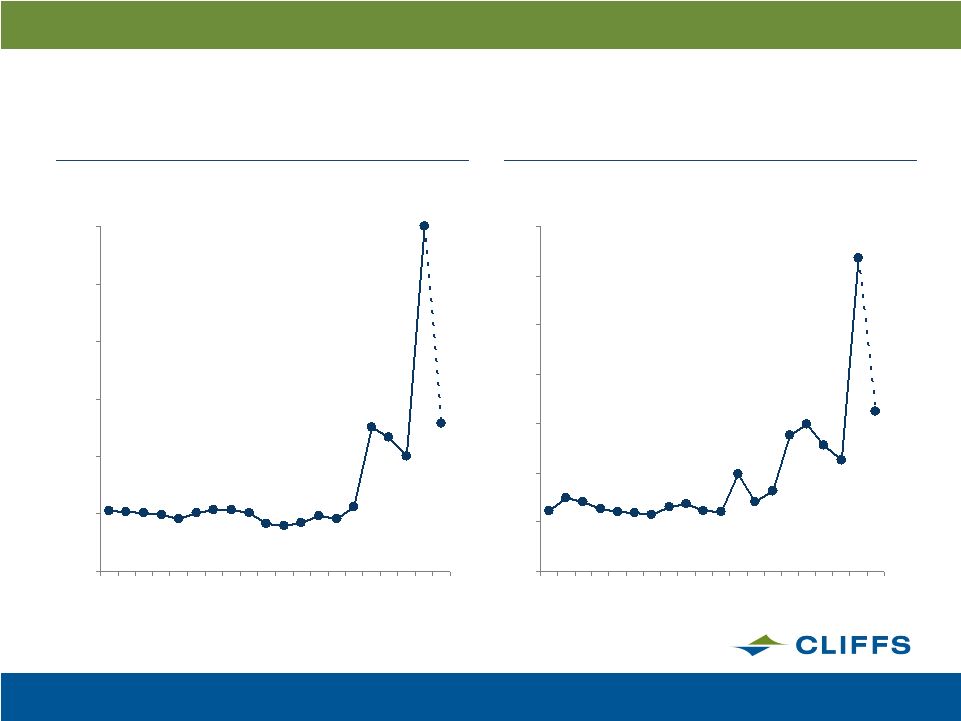 OPERATIONAL EXCELLENCE | A WORLD LEADER | STEWARDSHIP 41 Strong Coal Pricing Trends 0 20 40 60 80 100 120 140 1990 1992 1994 1996 1998 2000 2002 2004 2006 2008 Note: CAPP steam coal index – CSX, 12,500 Btu, 1# Rail Source: Bloomberg, Platts, Company estimates Met coal prices ($/metric ton) Steam coal prices ($/ton) 0 50 100 150 200 250 300 1990 1992 1994 1996 1998 2000 2002 2004 2006 2008 Source: Metal Strategies, equity research, Company estimates 2009E $129 -57% 2009E ~ Mid $60s -50% |
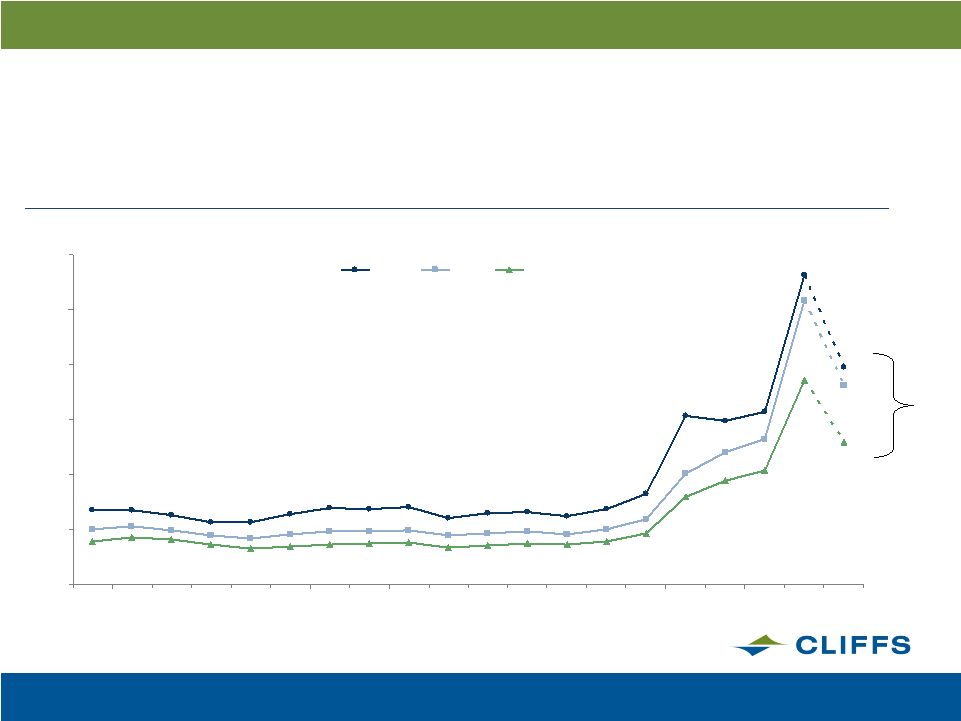 OPERATIONAL EXCELLENCE | A WORLD LEADER | STEWARDSHIP 42 Iron Ore Trends Recently Strong, Though Expected to Be Pressured in 2009 0 25 50 75 100 125 150 1990 1992 1994 1996 1998 2000 2002 2004 2006 2008 Pellets Lump Fines Iron ore prices ($/metric ton based on 64% Iron Content)
Source: Cliffs and Tex Reports $141 $129 $93 86% -3% 5.8% 86.6% 71% 19% 9.5% 96.5% 71% 19% 9.5% 79.9% $99* $65* $91* 2009E -30% * Assumes 30% decrease, an estimate among varying industry analysts for iron ore price
settlement declines in 2009. |
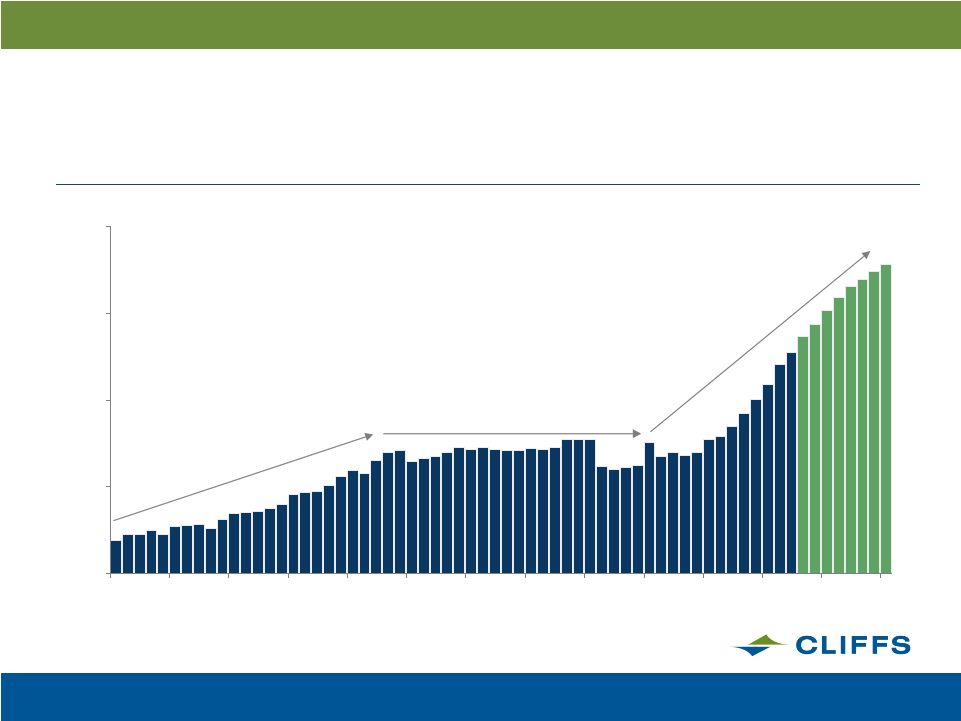 OPERATIONAL EXCELLENCE | A WORLD LEADER | STEWARDSHIP 43 Long-Term Steel Demand Will Drive Our Business Global steel demand (millions of tonnes) 0 500 1,000 1,500 2,000 1950 1955 1960 1965 1970 1975 1980 1985 1990 1995 2000 2005 2010E 2015E Post-World War II reconstruction and Japanese industrialization CAGR 1950-1973: 5.9% Post-oil crisis slowdown CAGR 1973-1995: 0.4% BRIC cycle CAGR 1995-2015: 4.4% Source: IISI, Metal Strategies |
 OPERATIONAL EXCELLENCE | A WORLD LEADER | STEWARDSHIP Cliffs Response to the Current Environment At the onset of the current global macroeconomic recession in the fall, Cliffs acted quickly:
Oct. 2008 – Idled pellet production and furnaces at Northshore Mining and United Taconite Nov. 2008 – Enacted required notices to initiate workforce reductions Dec. 2008 – Took additional actions in North American business unit (iron ore and coal) to match production with demand Long established six-sigma and business improvement program focus shifted from throughput to
cost-cutting projects already identified long before downturn 33 Blackbelts and 243 Greenbelts know where their focus lies Asia Pacific marketing efforts refocused on those customers in China with raw material needs
44 |
 OPERATIONAL EXCELLENCE | A WORLD LEADER | STEWARDSHIP In Summary Steel and the raw materials to make it are extremely important Building block of society Essential to modernization of Brazil, Russia, India and China (BRIC) Raw materials will continue to be scarce in the long-term Very few meaningful iron ore or metallurgical coal projects came online at the top of the last cycle World-wide stimulus packages will eventually result in increased demand (infrastructure,
construction, etc.) Cliffs is well positioned in its current markets and to benefit from the current environment
Active Business Development targeting program Strong Balance Sheet and significant financial flexibility 45 |
 OPERATIONAL EXCELLENCE | A WORLD LEADER | STEWARDSHIP Cliffs Natural Resources Corporate Presentation April 2009 |