1
Laurie Brlas
Senior
Vice
President
CFO
and
Treasurer
Steve Baisden
Director, Investor Relations and
Corporate Communications
KeyBanc
Capital Markets Basic Materials
and Packaging Conference
Boston, MA
September 19, 2007
A WORLD LEADER IN IRON ORE
AND METALLURGICAL COAL
Exhibit 99(a)


2
This
presentation
includes
predictive
information
that
is
intended
to
be
made
as
“forward-looking”
within
the
safe
harbor
protections
of
the
Private
Securities
Litigation
Reform
Act
of
1995.
Although
the
Company
believes
that
its
forward-
looking
information
is
based
on
reasonable
assumptions,
such
information
is
subject
to
risks
and
uncertainties,
which
could
cause
materially
different
results.
Important
factors
that
could
cause
actual
results
to
differ
materially
from
those
in
the
forward-looking
information
are
set
forth
in
the
Company’s
most
recent
Annual
Report
and
reports
on
Form
10-K
and
10-Q,
and
news
releases
filed
with
the
Securities
and
Exchange
Commission.
All
reports
and
news
releases
are
available
on
Cliffs’
website
www.cleveland-cliffs.com.
FORWARD-LOOKING STATEMENTS


3
AGENDA
Cliffs Latin America
41
Cliffs North American Coal
32
Summary
46
Cliffs Asia-Pacific
37
Cliffs North American Iron Ore
23
Industry: Iron Ore and Coal
13
Strategy
Overview
and
Transformation
of
Cliffs
3


4
Growth and Diversification
Revenue Growth
Product Diversification
Geographic Growth
Operational Excellence
Safety
Technical Competencies
Operating Efficiencies
Global Execution
Competencies of the Firm
Outlook of Personnel
Global Scalability
Shareholder Returns
Shareholder Value
Risk Management
“Earning the Right to Grow”
Growth and
Diversification
Shareholder
Returns
Global
Execution
Operational
Excellence
Strategy
VISION OF CLIFFS:
FOUR STRATEGIC IMPERATIVES


5
Strategy
CLIFFS’
STRATEGY
Maintain the core
North American Iron Ore
Expand globally and diversify products
Cliffs Asia-Pacific
Cliffs Latin America
PinnOak
Acquisition
Capitalize
on
Cliffs’
unique
technological
expertise
Concentrating and processing lower-grade ores
into high-quality products
Partnering with Kobe to use its ITmk3 technology


6
Strategy
MINERALS REVIEW
Attractive
Coal–Domestic Metallurgical
Coal–Domestic Thermal
Bentonite
Kaolin
Silver
Zeolites
Uranium
0-3%
Platinum Group Metals
Nickel
Aggregates
Cobalt
Gold
Lithium
Rare Earths
Talc
Tin
Zinc
3-5%
Iron Ore
Diamonds
Coal–Seaborne Metallurgical
Manganese
Coal–Seaborne Thermal
Molybdenum
Bauxite
Copper
Oil Sands
>5%
Most Promising
Least Promising
Fit with Cliffs
(Supply/Demand Characteristics, Core Competencies)
World
Demand
Growth
Unattractive
Average


7
1.   Analysis proves it to be an attractive market
Strong demand driven by world growth in steel production
Geologic shortage of quality ore in Asia
Attractive supply/demand dynamics
2.
Acquisition opportunities that do not interest “Big Three”
3.  Opportunities to partner
Steel mills seek stability of supply and competitive pricing
One of the few alternatives to the Big Three
Operational expertise, credibility as partner
4.  However, attractive assets are scarce, and currently high priced
First priority, but not the only considered
Target: 50% of growth in iron ore
Strategy
FIRST PRIORITY –
IRON ORE


8
Good fit with current operations
Historically holds a cost advantage over
natural gas
Stable pricing over the long term
Good fit with operational competencies
and existing customer base
Opportunity to serve high-growth
emerging markets from low-risk
Australian and U.S. production base
Business
Environment
Supply base becoming more
concentrated: Approximately half of U.S.
market share belongs to top five players
Concentrated industry: Approximately
half of U.S. market share belongs to top
three players
Supply
Dynamics
Steady growth of coal-based
power generation
Very large U.S. market -
12 times the
value of U.S. iron ore
Attractive exposure to emerging-
market regions
2-5% average annual growth of
markets served by Australia
Demand
Growth
Thermal Coal
Met Coal
Strategy
TARGET MARKETS:
MET AND THERMAL COAL


9
Continue technology innovation and leadership in
turning low-grade ores into high-quality products
Commercialization of Kobes ITmk3 technology
Opens EAF market to Cliffs
Use the technology to reduce transportation
cost in remote locations
Plans for a 500,000 ton commercial-scale plant
at Empire Mine location in Michigan
Strategy
NEW IRON TECHNOLOGY


10
TRANSFORMATION TO AN
INTERNATIONAL MINING ENTITIY
Cliffs acquires Portman
Limited, Australia’s then
third-largest iron ore miner
Selects Michigan site
for iron nugget plant
Acquires PinnOak
Resources,
premium-quality metallurgical
coal producer
Cliffs agrees to sell
Wabush
Mines, Canada
Cliffs transitions
from mine manager
to international
merchant mining
company
Diversifies into coal through 45% economic
interest in the Sonoma Project, an Australian
coking and thermal coal project
Joseph Carrabba named CEO;
Cliffs reorganizes into
business-unit structure
Expands into Latin America; acquires
30% ownership position in Brazilian
iron ore project Amapá
Mine
Early 2000s
2005
2006
2007
Transformation


11
Cliffs
North
American
Iron Ore
Australia
Iron Ore
Other
North
American
Coal
CLEVELAND-CLIFFS BUSINESS UNITS
Transformation


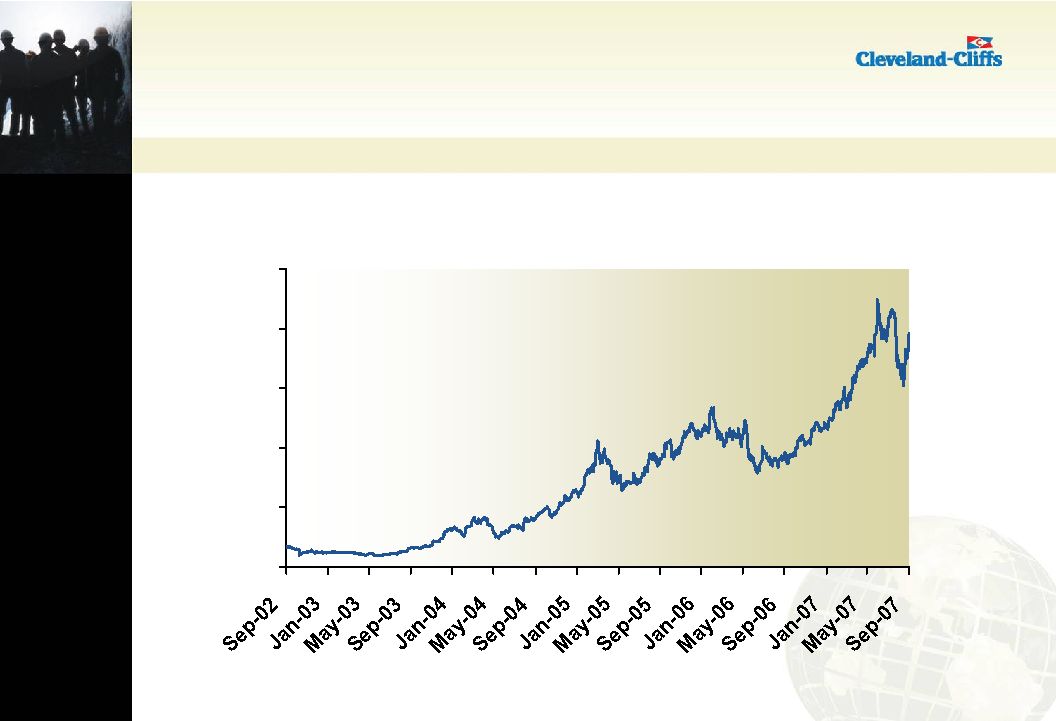
12
CLIFFS EXECUTIVE MANAGEMENT
“DEEPENING THE BENCH”
Transformation
Laurie Brlas, SVP, Chief Financial Officer and Treasurer, December 2006
An extensive accounting and financial career spanning more than 20 years, most recently as
senior vice president, chief financial officer of sterilization systems manufacturer STERIS
Corporation. Her responsibilities include finance, financial reporting, accounting, financial planning,
investor relations, and treasury functions.
Steven M. Raguz, VP, Corporate Planning and Strategic Analysis, March 2007
Formerly, senior director, financial planning and analysis of STERIS Corporation. Responsible for
designing processes to ensure consistency and appropriate information to implement the
Company’s strategy, as well as long-term planning, oversight of analysis and forecasting functions.
William Brake, EVP, Cliffs Metallics, and Chief Technical Officer, April 2007
Former
executive
vice
president,
operations
for
Mittal
Steel
USA,
with
full
operating
responsibility
for all of Mittal’s
domestic steel operations. He began his career with LTV Steel, and following its
acquisition by International Steel Group, was responsible for the initial re-start of the Cleveland,
Ohio, facilities.
William C. Boor, SVP, Business Development, May 2007
Former executive vice president, strategy and development, for American Gypsum Company, a
subsidiary of Eagle Materials Inc. He is responsible for identifying and leading initiatives to support
the growth of the Company and brings diverse experience in manufacturing management, process
engineering, financial management, investor relations and marketing to his new role.


13
AGENDA
Cliffs Latin America
41
Cliffs North American Coal
32
Summary
46
Cliffs Asia-Pacific
37
Cliffs North American Iron Ore
23
Industry: Iron Ore and Coal
13
Strategy
Overview
and
Transformation
of
Cliffs
3


14
Very few steel producers have vertically integrated
1.8 billion metric tons of iron ore production capacity
Limited new discovery of large deposits
Pricing is negotiated and set annually among the largest
buyers and sellers
2007 settlements
9.5% increase for lump and fines ore
5.8% increase for pellets
Approximately 80% fines, lump and concentrates
About 20% pellets (for blast furnaces and direct-
reduction plants)
Industry: Iron Ore
GLOBAL IRON ORE INDUSTRY PROFILE


15
NORTH AMERICAN INTEGRATED STEEL
2007
Market Participants
Mittal 39%
U.S. Steel 40%
AK Steel 7%
Other 7%
Algoma 4%
Severstal 3%
Industry: Iron Ore
2001
Market Participants
U.S. Steel 20%
Bethlehem 15%
Other 13%
LTV 11%
National 10%
Stelco 10%
Ispat 6%
Weirton 5%
Algoma
4%
Rouge
3%
Dofasco
3%


16
Iron Ore Producers
by Company
Metalloinvest
2%   
Kumba
2%
NDMC 2%
Cliffs 2%
Other 57%
Rio Tinto
10%
CVRD
15%
CVG 1%
LKAB 1%
U.S. Steel 1%
GLOBAL STEEL
Steel Producers
by Company
Arcelor Mittal
10%
Other 72%
Shandong 2%
Nucor 2%
U.S. Steel 2%
Corus 2%
Baosteel
2%
Anben
2%
JFE 3%
Nippon 3%
Posco
3%
Concentration vs Fragmentation
Industry: Iron Ore
BHP
7%


17
IRON ORE PRODUCER AND
CONSUMER COUNTRIES
Consumers by Country
China 51%
Japan 8%
Middle East & Africa 3%
North America 5%
South America 5%
Commonwealth of
Independent States 9%
Europe 11%
Other Asia &
Oceania 8%
Producers by Country
China 32%
Brazil 18%
Australia 17%
Other 8%
India 8%
Commonwealth of
Independent
States 11%
North
America 6%
2006 World Production: 1,755 MM Tonnes
Industry: Iron Ore


18
820
795
780
784
747
720
420
395
350
221
127
283
0
250
500
750
1,000
1,250
2007E
2006
2005
2004
2003
2000
Rest of World (5-YR CAGR 3%)
China (5-YR CAGR 27%)
CHINA’S IMPACT ON
THE WORLD STEEL INDUSTRY
MM Tonnes (Production)
847
968
1,067
1,130
1,240
1,190
CAGR: 8%
Industry: Iron Ore


19
$0
$10
$20
$30
$40
$50
$60
$70
$80
Pellets
Lump
Fines
Pellet Prices $DMT Based on Eastern Canadian Pellet Price With 64% Iron
Lump and Fines $DMT for Australian Iron Ore Shipments to Japan
+86%
+5.8%
+19%
+71.5%
-3%
+9.5%
+71.5%
+19%
+9.5%
Industry: Iron Ore
GLOBAL IRON ORE HISTORIC MARKET PRICES


20
COAL MARKET DYNAMICS
2006 global coal production: 6.3B short tons
Vast majority used for electric generation
820MM tons (13%) met coal
2006 U.S. total coal production: 1.16B tons
Vast majority used for electric generation
Coking plant consumption: 23.0MM tons (2% of total)
U.S. is net exporter of coal
49.6MM tons of total coal exported from U.S. in 2006
27.5MM tons (55%) was met coal
Largest importer of U.S.-produced met coal: Europe
Industry: Coal
Source: US Energy Information Administration, 2006 Review: U.S. Coal Supply and Demand


21
COAL MARKET DYNAMICS
Supply constraints continue to impact the met
coal market
Weaker dollar making U.S. exports more attractive
Increased use of pulverized coal injection (PCI
coal) driving demand for higher-quality coals
Economic growth in China and India continuing to
drive demand
Industry: Coal
Source: US Energy Information Administration, 2006 Review: U.S. Coal Supply and Demand


22
RECENT COAL PRICES
Industry: Coal
$0
$25
$50
$75
$100
2002
2003
2004
2005
2006
U.S. Met Coal
Thermal Coal
Source: US Energy Information Administration, 2006 Review: U.S. Coal Supply and Demand.


23
AGENDA
Cliffs Latin America
41
Cliffs North American Coal
32
Summary
46
Cliffs Asia-Pacific
37
Cliffs North American Iron Ore
23
Industry: Iron Ore and Coal
13
Strategy
Overview
and
Transformation
of
Cliffs
3


24
79%
21%
North America
Asia-Pacific
2006 CLIFFS’
SALES BY SEGMENT
Cliffs North American Iron Ore


25
Largest supplier of iron ore pellets to the integrated
steel industry in North America
Cliffs led the consolidation of the North American
iron ore industry and obtained a larger share
of the market
CLIFFS NORTH AMERICA
Cliffs North American Iron Ore


26
*Includes minority interest.
(Million Gross Tons)
CLIFFS’
PRODUCTION
7.8
14.7
18.1
21.7
27
28.3
17.6
13.2
12.2
12.7
8.9
5.3
5.2
7.7
0
5
10
15
20
25
30
35
40
45
2001
2002
2003
2004
2005*
2006*
Cliffs' NA Equity Production
NA Non-Equity Production
AP Production
Cliffs North American Iron Ore


27
NORTH AMERICAN PELLET PRODUCERS: 2006
4%
11%
15%
24%
46%
U.S. Steel
Quebec Cartier Mining
Company
(Arcelor Mittal)
Minorca (Arcelor Mittal)
Cliffs
Iron Ore Company of Canada
(Rio Tinto)
Cliffs North American Iron Ore


28
CLIFFS NORTH AMERICAN PELLET
CUSTOMERS: 2006
Severstal
13%
Algoma
20%
Mittal
Steel USA 44%
WCI
9%
Other
9%
Stelco
5%
Cliffs North American Iron Ore


29
CLIFFS NORTH AMERICAN
IRON ORE SHIPPING ROUTES
Cliffs North American Iron Ore


30
Repair and restart of idled Northshore Mining Furnace
No. 5 commencing in 2008
Expected to increase 2008 capacity by 800,000 tons
Augments Cliffs
ability to satisfy customers
current
and future requirements according to long-term
contracts
Helps
replace
tonnage
from
Wabush
Mine
Cost: $39 million
NORTHSHORE EXPANSION
Cliffs North American Iron Ore


31
Virtually 100% of current annual pellet capacity is committed under
long-term contracts
Weighted average term of North American contracts
is seven years
Annual price adjustments based on a variety of factors including:
International benchmark pellet price
Various PPI indices
-
Industrial Commodities Less Fuel
-
Fuel and Related Products
-
Cold Rolled Steel
-
Hot Rolled Steel
-
All Commodities
-
Fuel and Power
Hot band steel prices
CLIFFS PELLET CONTRACT PRICING
Cliffs North American Iron Ore


32
AGENDA
Cliffs Latin America
41
Cliffs North American Coal
32
Summary
46
Cliffs Asia-Pacific
37
Cliffs North American Iron Ore
23
Industry: Iron Ore and Coal
13
Strategy
Overview
and
Transformation
of
Cliffs
3


33
NORTH AMERICAN COAL:
PINNOAK RESOURCES
STRATEGIC ACQUISITION
Domestic producer of high-quality, low-volatility
metallurgical coal
80% slated for international markets
Three underground mines
Pinnacle and Green Ridge in West Virginia
Oak Grove in Alabama
Cliffs North American Coal


34
Capacity in excess of seven million tons annually
Anticipated production
Second-half 2007: two million tons
2008: five million tons
Reserves: 140 million tons
Price: $450 million cash, $160 million debt
$112.5 million of cash payment deferred until
end of 2009
NORTH AMERICAN COAL:
PINNOAK RESOURCES
Cliffs North American Coal


35
Contract pricing
Currently, one-year contracts negotiated annually
Export contracts reset April to April
Domestic contracts reset by calendar year
Potential opportunity to transition consumers into
long-term contracts
NORTH AMERICAN COAL:
PINNOAK RESOURCES
Cliffs North American Coal


36
NORTH AMERICAN MET COAL PRODUCERS
PinnOak
provides Cliffs with a strong industry position
and platform for further growth
CONSOL 7%
Jim Walter
Resources 11%
Peabody Energy
10%
United Coal Corp.
6%
Massey Energy
18%
Alpha Natural
Resources 21%
Arch Coal 4%
Cliffs
9%
Foundation Coal
Holdings 3%
Sun Coke 2%
Others 9%
Cliffs North American Coal


37
AGENDA
Cliffs Latin America
41
Cliffs North American Coal
32
Summary
46
Cliffs Asia-Pacific
37
Cliffs North American Iron Ore
23
Industry: Iron Ore and Coal
13
Strategy
Overview
and
Transformation
of
Cliffs
3


38
Cliffs Asia-Pacific
CLIFFS ASIA-PACIFIC
Portman:
Cockatoo Island
Perth
Esperance
Portman:
Koolyanobbing
Sonoma Project
Sydney
Abbot Point
Terminal


39
Provided immediate presence in Australia and Asia
Access to fastest growing steel markets and
relationships
where
Cliffs’
iron
ore
competencies
can
be levered
Capacity increased from 6MM to 8MM tonnes in 2006
Portman has 88 million tonnes of proved reserves
and an active exploration program
Production contracted for next three years
Customers in China (80%) and Japan (20%)
Pricing correlates with international negotiated
settlements for fines and lump ore
PORTMAN LIMITED
Cliffs Asia-Pacific


40
Partnered with QCoal
for a 45% interest in the
Sonoma Project
At the northern limit of Queensland’s Bowen
Basin coalfields
Initial production beginning in late 2007
Approximately half coking coal and half thermal coal
Production ramping to between three million and four
million tonnes by end of 2008
JORC Resource estimate of 107 million tonnes
Moves by rail to the Abbot Point Bulk Coal Terminal
for export
Cliffs’
investment ~ $109 million
SONOMA COAL PROJECT
Cliffs Asia-Pacific


41
AGENDA
Cliffs Latin America
41
Cliffs North American Coal
32
Summary
46
Cliffs Asia-Pacific
37
Cliffs North American Iron Ore
23
Industry: Iron Ore and Coal
13
Strategy
Overview
and
Transformation
of
Cliffs
3


42
Cliffs purchased 100% of the shares of Centennial Asset
Mining
Fund
LLC,
an
affiliate
of
MMX
Mineração
e
Metálicos
SA, whereby it acquired 30% of the Amapá
Project.
CLIFFS LATIN AMERICA:
AMAPÁ
PROJECT
Cliffs Latin America


43
Opened regional office in Rio de Janeiro February 2007
Active business development program evaluating
numerous deposits
Amapá
provides an attractive opportunity in Latin
America and, over time, is anticipated to serve as a
platform
for
further
expanding
Cliffs’
presence
in
the region
CLIFFS LATIN AMERICA
Cliffs Latin America


44
Acquisition of 30% interest in Brazilian iron ore project Amapá
Includes: iron ore deposits, 192 kilometer railway, 71 hectares
of real estate
Estimated annual production
2007:
0.4 Mt
2008:
4.8 Mt
2009 and beyond:
6.5 Mt
Long-term supply agreement with Bahrain in place, oversight by Cliffs
Rio de Janeiro office
Cliffs’
2007 investment: $240 million
Initial investment $133 million
Approximately $27 million of capital expenditures to date
$84 million of construction expenditures financed with
project-level debt
Note: Data as of March 2006; Source: MMX, NI 43-101 reports
AMAPÁ
PROJECT
Cliffs Latin America


45
Measured/Indicated:
73.6 Mt
Inferred:
104.5 Mt
Conceptual:
150.0 Mt
Re-certification of resources and reserves planned for the
end of 2007
Note: Data as of March 2006; Source: MMX, NI 43-101 reports
AMAPÁ
GEOLOGICAL RESOURCES
AND RESERVES
Cliffs Latin America


46
AGENDA
Cliffs Latin America
41
Cliffs North American Coal
32
Summary
46
Cliffs Asia-Pacific
37
Cliffs North American Iron Ore
23
Industry: Iron Ore and Coal
13
Strategy
Overview
and
Transformation
of
Cliffs
3


47
FOCUSED ON SHAREHOLDER VALUE
Repurchased 3.2 million (split-adjusted) shares in 2006,
using $121 million in cash
1.3 million shares remaining under authorization as of
June 30, 2006
25% increase in common share dividend
CLF stock price up 112% from September 2006
to September 2007
Summary


48
Cleveland-Cliffs’
Stock
Price:
Sept.
2002
Sept
2007
(Adjusted for stock splits)
Summary
CLIFFS’
STOCK PERFORMANCE
$0
$20
$40
$60
$80
$100


49
Unsecured $800MM agreement includes:
$200MM term loan
$600MM revolver
$200MM accordion feature for future expansion
Enables Cliffs to maintain requisite liquidity to
seize opportunities
Supports Cliffs
continuing objectives of optimizing
capital structure, reducing the cost of capital, and
creating shareholder value
Debt to total capitalization target of 30-40%
Debt to EBITDA target of less than 2.0X
Summary
NEW FIVE-YEAR CREDIT AGREEMENT


50
Summary
2006 FINANCIAL HIGHLIGHTS
Full-Year Results:
Change
2005
2006
10.4%
$ 1,740
$  1,922
Revenue
2.5%
$    357
$     366
Operating Income
0.7%
$    278
$     280
Net Income
2.2%
27.2
27.8
Sales Tonnage:
(Gross Tons)
58%
$   0.30
$  0.475
Cash Dividends Paid
Per Common Share
(In Millions Except Per Share)
0%
0%
Debt to Total Capitalization
At Dec. 31, 2005
At Dec. 31, 2006


51
YEAR-TO-DATE FINANCIAL HIGHLIGHTS
Summary
(In Millions, Except Per Share)
4%
$   2.20
$   2.29
Diluted EPS
First-Half Ended:
Change
June 30,  
2006
June 30,  
2007
10%
$    793
$    873
Revenue
(1%)
$    121
$    119
Net Income
8%
11.1
12.0
Sales Tonnage
(Gross Tons)
0%
10%
Debt to Total Capitalization
At June 30, 2006
At June 30, 2007


52
VISION OF CLIFFS -
2015
Growth and
Diversification
Shareholder
Returns
Global
Execution
Operational
Excellence
Summary
Growth and Diversification
Revenues Doubled
50% of Revenues From
Outside of North America
Up to 25% of Revenues
From Outside of Iron Ore
Operational Excellence
MSHA Frequency Rate
Below 2.00
Net Savings of $5.00 Per
Ton of Iron Ore Production
Global Execution Metrics
Global Corporate
Development
Globally Scalable Operations
Significant Share of
Management From Outside
United States
Shareholder Returns
Average Annual Return of 12%
Balanced Shareholder Returns
Dividends
Share Repurchases
Capital Appreciation
COMBINE INTO OUR VISION OF A NEW CLIFFS


Laurie Brlas
Senior Vice President
CFO
and Treasurer
Steve Baisden
Director, Investor Relations and
Corporate Communications
KeyBanc
Capital Markets Basic Materials
and Packaging Conference
Boston, MA
September 19, 2007
A WORLD LEADER IN IRON ORE
AND METALLURGICAL COAL