 1 BMO CAPITAL MARKETS 2007 GLOBAL RESOURCES CONFERENCE February 27, 2007 JOSEPH CARRABBA President and Chief Executive Officer LAURIE BRLAS Senior Vice President—CFO
and Treasurer Exhibit 99(a) |
| 1 BMO CAPITAL MARKETS 2007 GLOBAL RESOURCES CONFERENCE February 27, 2007 JOSEPH CARRABBA President and Chief Executive Officer LAURIE BRLAS Senior Vice President—CFO
and Treasurer Exhibit 99(a) |
 2 This presentation includes predictive information that is intended to be
made as “forward-looking” within the safe harbor protections of the Private Securities Litigation Reform Act of 1995. Although the
Company believes that its forward-looking information is
based on reasonable assumptions, such information is subject to
risks and uncertainties, which could cause materially different
results. Important factors that could cause actual
results to differ materially from those in the forward-looking information are set forth in the Company’s most recent Annual Report
and reports on Form 10-K and 10-Q, and news releases
filed with the Securities and Exchange Commission. All
reports and news releases are available on Cliffs’
website www.cleveland-cliffs.com. FORWARD-LOOKING STATEMENTS |
 3 TODAY’S AGENDA • Cliffs’ Strategy • Industry Overview – Cliffs’ Customer Base – Our Industry • Cleveland-Cliffs – North America – Asia-Pacific – Latin America • Financials • Summary |
 4 CLIFFS’ STRATEGY |
 5 VISION OF CLIFFS – FOUR STRATEGIC CHANGES Growth and Diversification • Revenue Growth • Product Diversification • Geographic Growth Operational Excellence • Safety • Technical Competencies • Operating Efficiencies Global Execution • Competencies of the Firm • Outlook of Personnel • Global Scalability Shareholder Returns • Shareholder Value • Risk Management • “Earning the Right to Grow” Growth and Diversification Shareholder Returns Global Execution Operational Excellence Strategy |
 6 CLIFFS’ STRATEGY • Maintain the Core – North America • Capitalize on Cliffs’ Unique Technological Expertise • Expand Globally and Diversify Products Strategy |
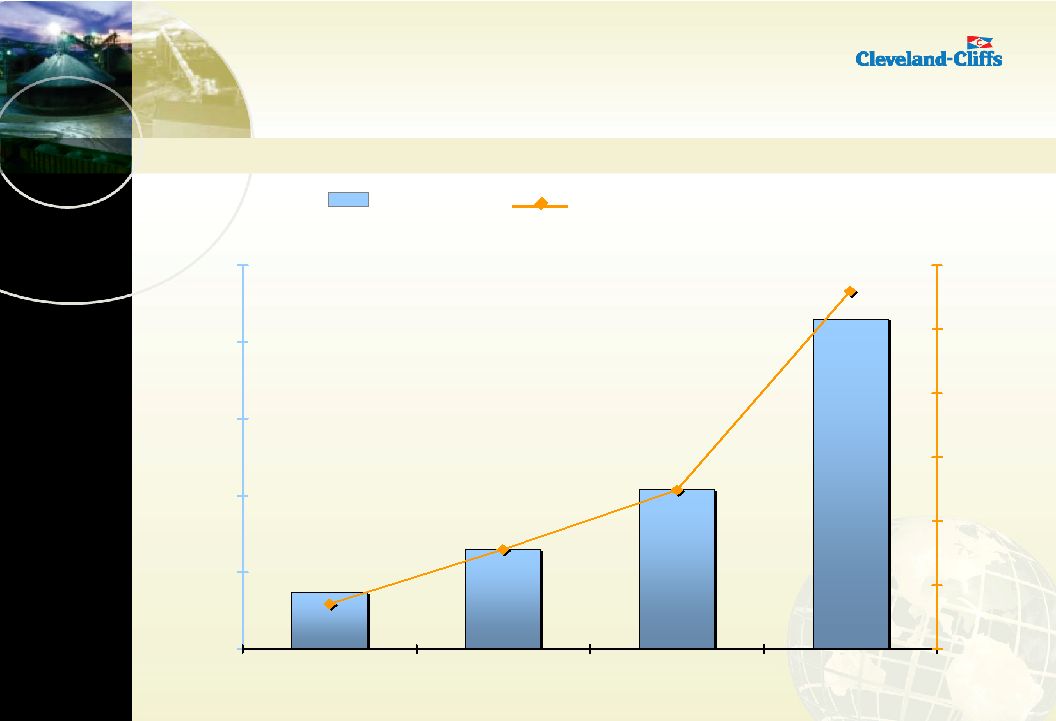 7 0 5 10 15 20 25 1980 1990 2000 2006 Cliffs' Sales Gross Tons (millions) 0% 5% 10% 15% 20% 25% 30% Cliffs' Market Share CLIFFS’ GROWTH IN NORTH AMERICAN MARKET SHARE Cliffs’ Pellet Sales Cliffs’ North American Market Share Strategy |
 8 NEW IRON TECHNOLOGY • Continue to be a global leader and innovator in technological “know how” to upgrade low-grade iron ores to make high-quality products – Commercialization of Kobe’s ITmk3 Technology – Allows Cliffs to participate in the EAF Market – Use the technology to reduce transportation cost in remote locations – Cliffs and Kobe intend to proceed with development of a commercial-scale plant in North America Strategy |
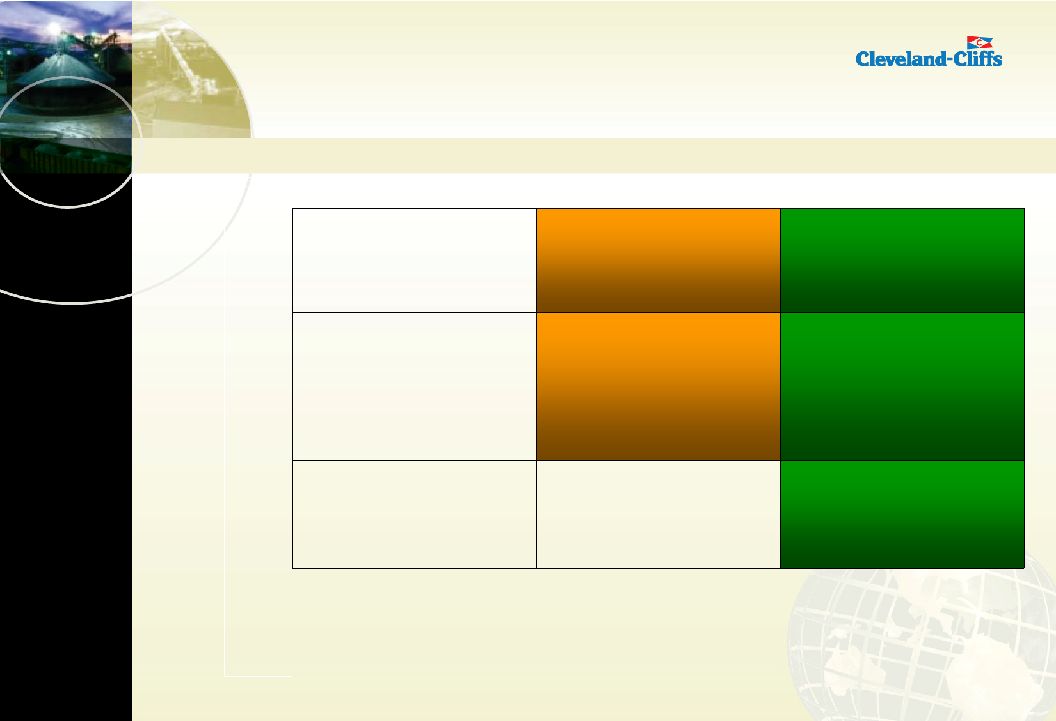 9 TARGET MARKETS - OVERVIEW Attractive • Insufficient Chinese production, or • Geologic oligopoly, or • Structured oligopoly Medium Unattractive • On-demand capacity, or • Backed-up pipeline, or • By-product production Coal – Domestic Thermal Bentonite Coal - Domestic Metallurgical Kaolin Silver Zeolites 0-3% Coal – Seaborne Metallurgical* Platinum Group Metals* Uranium Nickel Aggregates Cobalt Gold Lithium Rare Earths Talc Tin 3-5% Iron Ore Diamonds Manganese Oil Sands** Bauxite Coal - Seaborne Thermal Copper >5% Most Promising Tier 2 Tier 3 *Growth of markets served by Australia **Reduced priority due to lack of entry vehicles World Demand Growth Supply Dynamics Strategy |
 10 FIRST PRIORITY - IRON ORE 1. Diversification analysis shows it to be one of the most attractive markets - Strong demand driven by world growth in steel production - Geologic shortage of quality ore in China - Highly concentrated supplier base 2. Opportunities to acquire smaller assets that do not interest
the “Big Three” 3. Opportunities to partner - Steel mills seek stability of supply and competitive pricing - Cliffs is one of the few alternatives to the Big Three - Cliffs has operational expertise, credibility as partner 4. However - attractive properties are scarce, and currently high priced - First priority - but cannot be the only opportunity that will be considered Target – at least 50% of growth in iron ore Strategy |
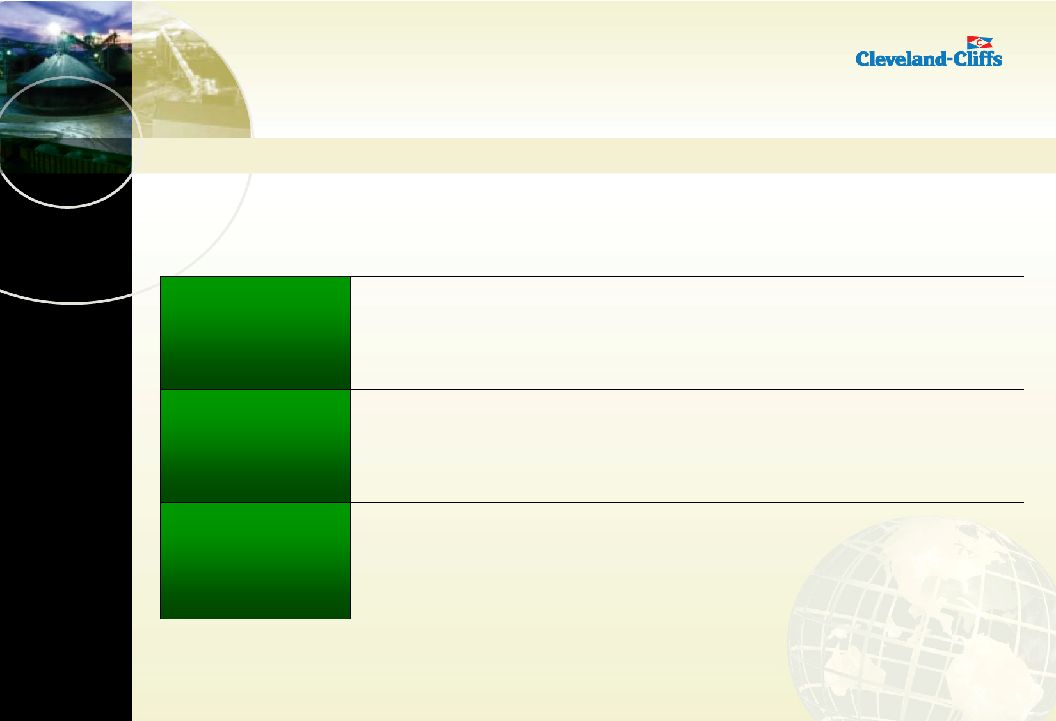 11 TARGET MARKETS: SEABORNE MET. COAL AND DOMESTIC THERMAL COAL Good fit with current operations Historically holds a cost advantage over natural gas Stable pricing over the long term Good fit with Cliffs' operational competencies Opportunity to serve high-growth emerging markets from low-risk Australian production base Business Environment Supply base is continuing to become more concentrated with currently over 55% market share for the top-5 players and growing Industry is concentrated with nearly 50% market share of top-3 players Supply Dynamics Steady growth of coal-based power generation Very large market - 12 times the value of the U.S. iron ore market Attractive exposure to growing emerging- market steel production Steady growth of coal-based power generation 2-5% average annual growth of markets served by Australia Demand Growth Domestic Thermal Coal (US) Seaborne Met Coal (Australia) Strategy |
 12 CLIFFS’ CUSTOMER BASE |
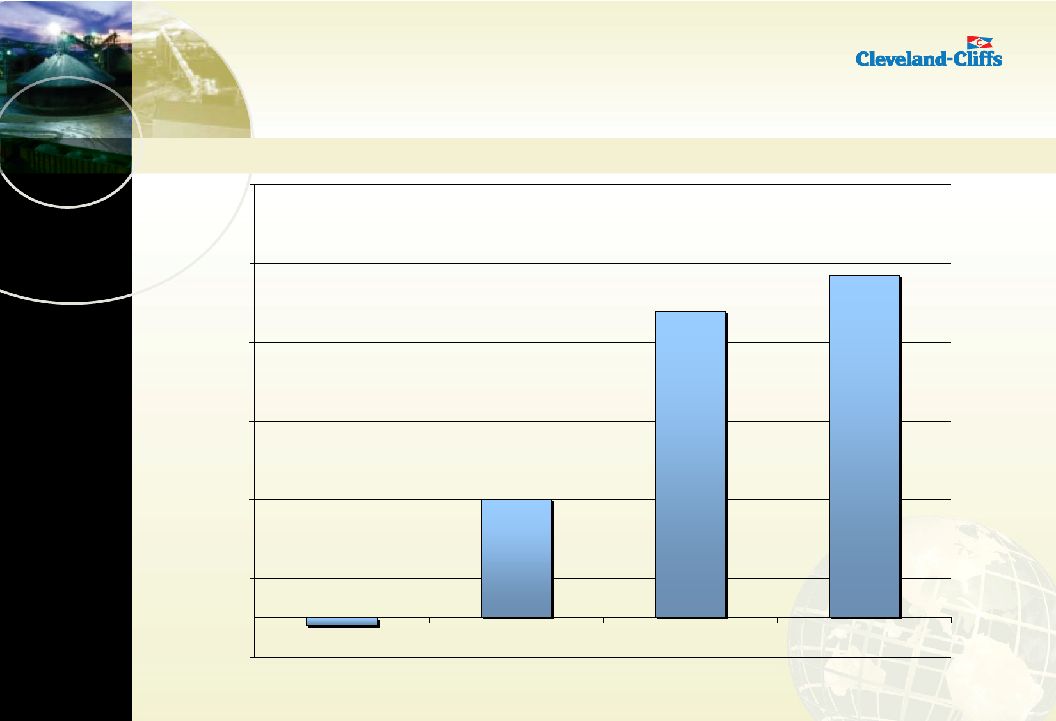
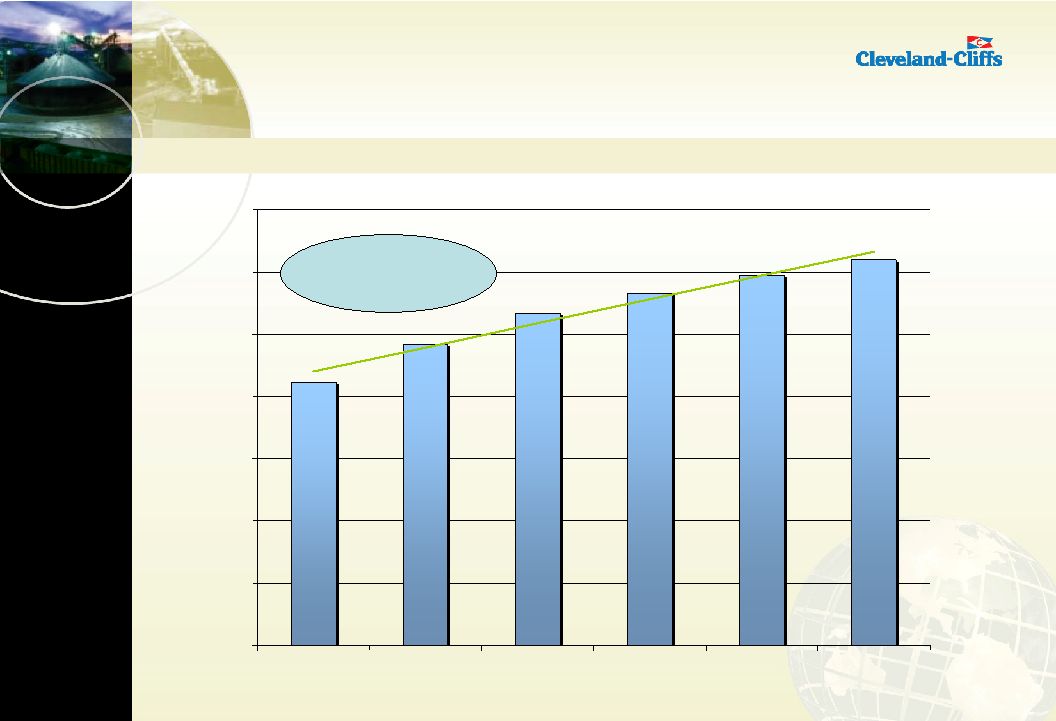 13 847 968 1,067 1,130 1,190 1,240 0 200 400 600 800 1,000 1,200 1,400 2000 2003 2004 2005 2006E 2007E GLOBAL STEEL PRODUCTION 5-Year CAGR = 8% Cliffs’ Customer Base Millions of Tonnes (Production) |
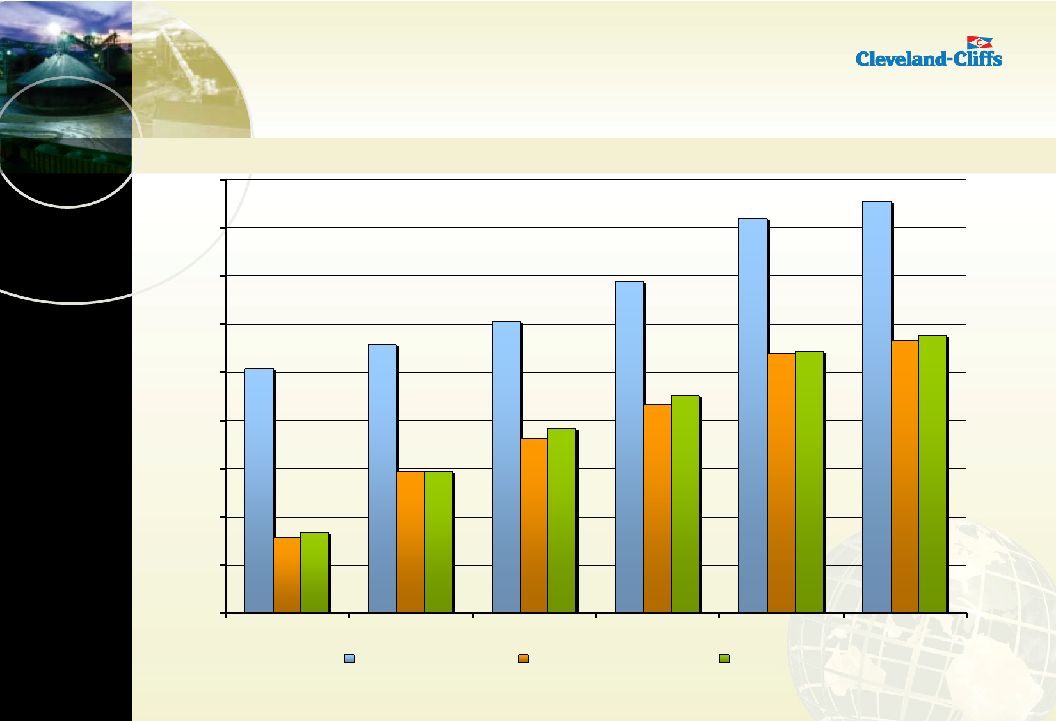
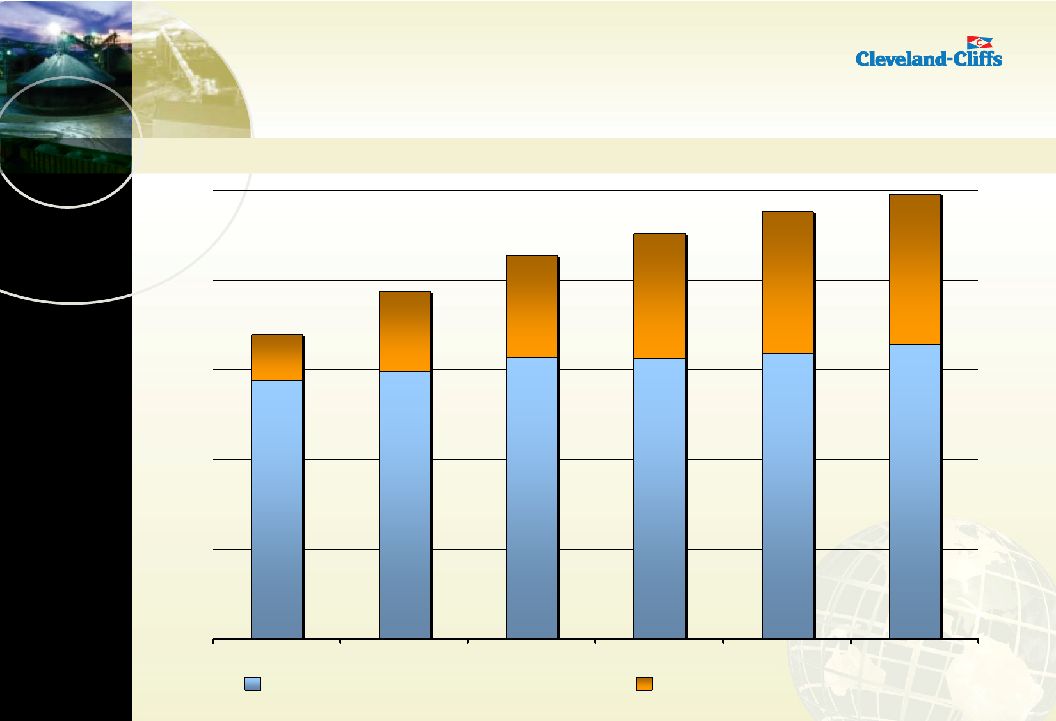 14 820 795 780 784 747 720 420 395 350 221 127 283 0 250 500 750 1,000 1,250 2007E 2006E 2005 2004 2003 2000 Rest of World (5-YR CAGR 3%) China (5-YR CAGR 27%) CHINA’S IMPACT ON THE WORLD STEEL INDUSTRY Millions of Tonnes (Production) 847 968 1,067 1,130 1,240 1,190 Cliffs’ Customer Base |
 15 OUR INDUSTRY |
 16 GLOBAL IRON ORE INDUSTRY PROFILE • Very few steel producers have vertically integrated into iron ore
• 1.5 billion metric tons of iron ore production capacity • Limited new discovery of large iron ore deposits • Pricing is negotiated and set annually among the largest buyers and
sellers – 2007 settlements • 9.5% increase for lump and fines ore • 5.3% increase for pellets • Approximately 80% fines, lump and concentrates • About 20% pellets (for blast furnaces and direct-reduction
plants) Our Industry |
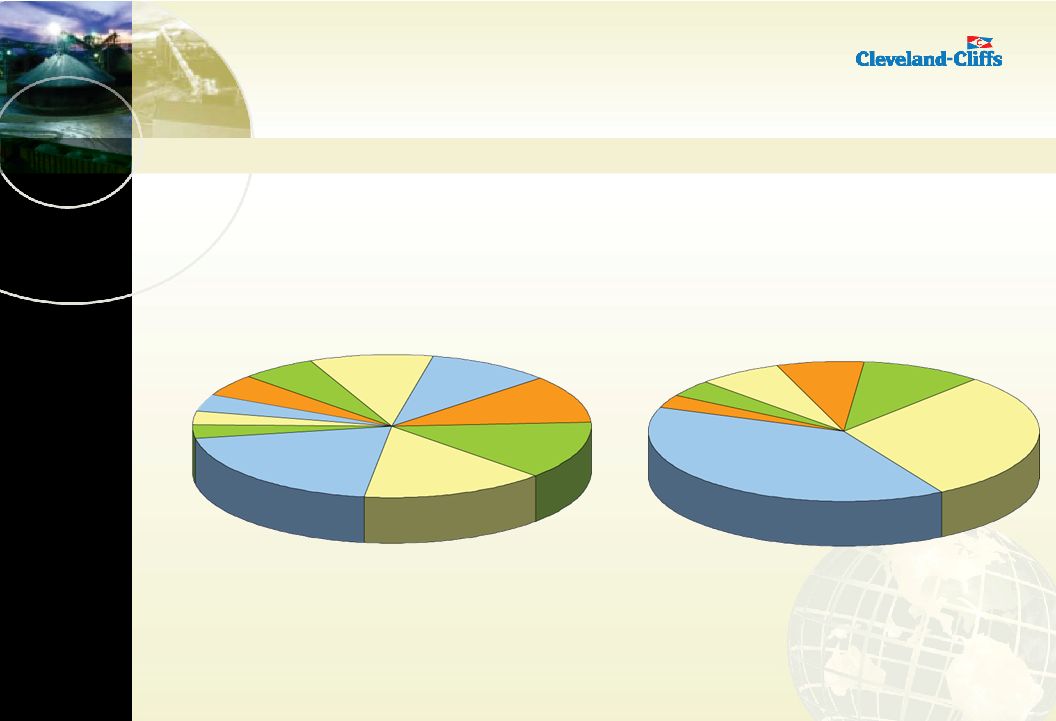
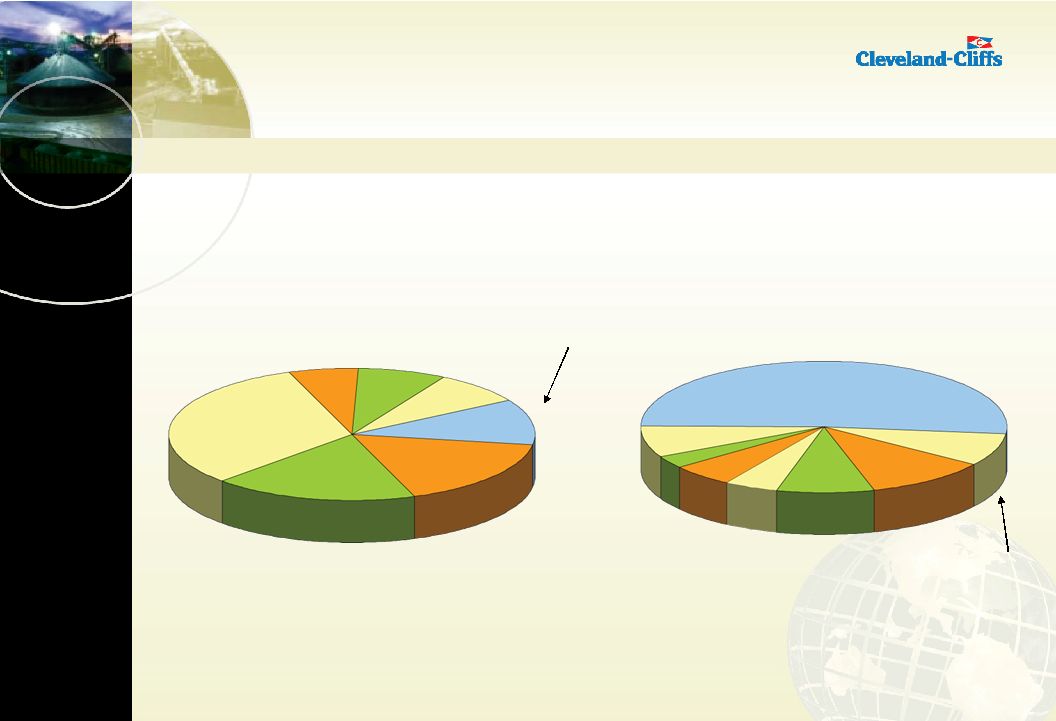 17 Consumers by Country IRON ORE PRODUCERS AND CONSUMERS Producers by Country 2006 World Production: 1,755 million tonnes Commonwealth of Independent States 11% China 32% North America 6% India 8% Other 8% Australia 17% Brazil 18% China 51% Japan 8% Middle East & Africa 3% North America 5% South America 5% Commonwealth of Independent States 9% Europe 11% Other Asia & Oceania 8% Our Industry |
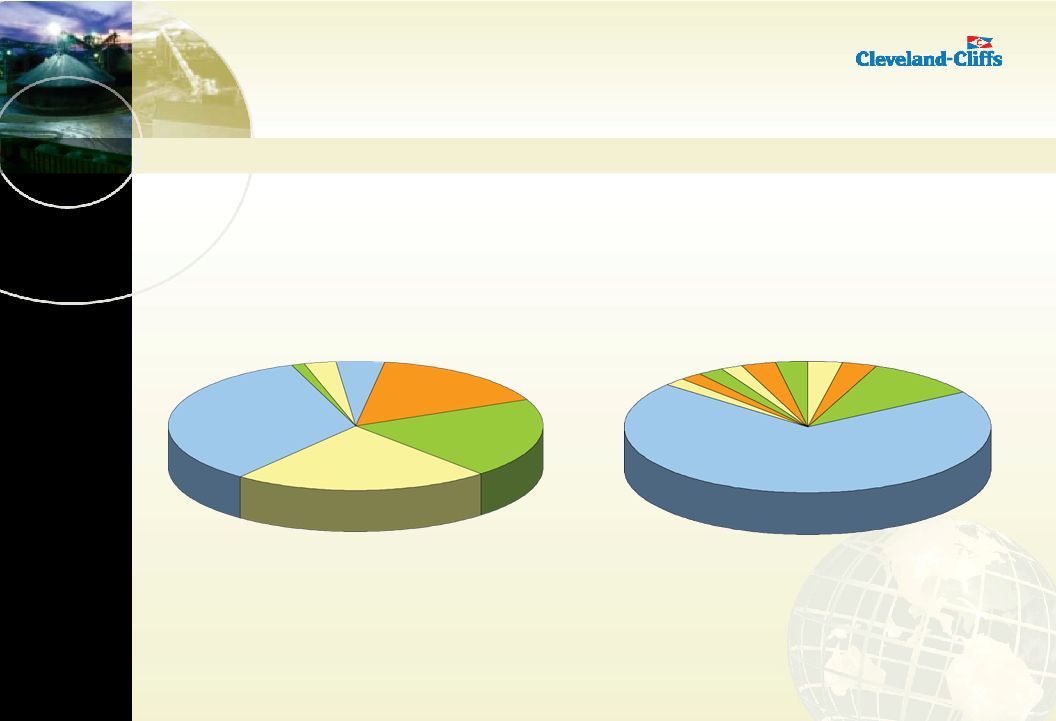 18 IRON ORE PRODUCERS AND CONSUMERS Producers by Company Consumers by Company Corus 2% Arcelor Mittal 10% Other 70% Thyssenkrupp 2% US Steel 2% Nucor 2% Boasteel 3% POSCO 3% JFE 3% Nippon 3% BHP 15% CVRD 35% Other 19% Cliffs 1% LKAB 3% Kumba 4% Rio Tinto 23% Concentration vs Fragmentation Largest Iron Ore Producers vs Top 100 Steel Mills Our Industry |
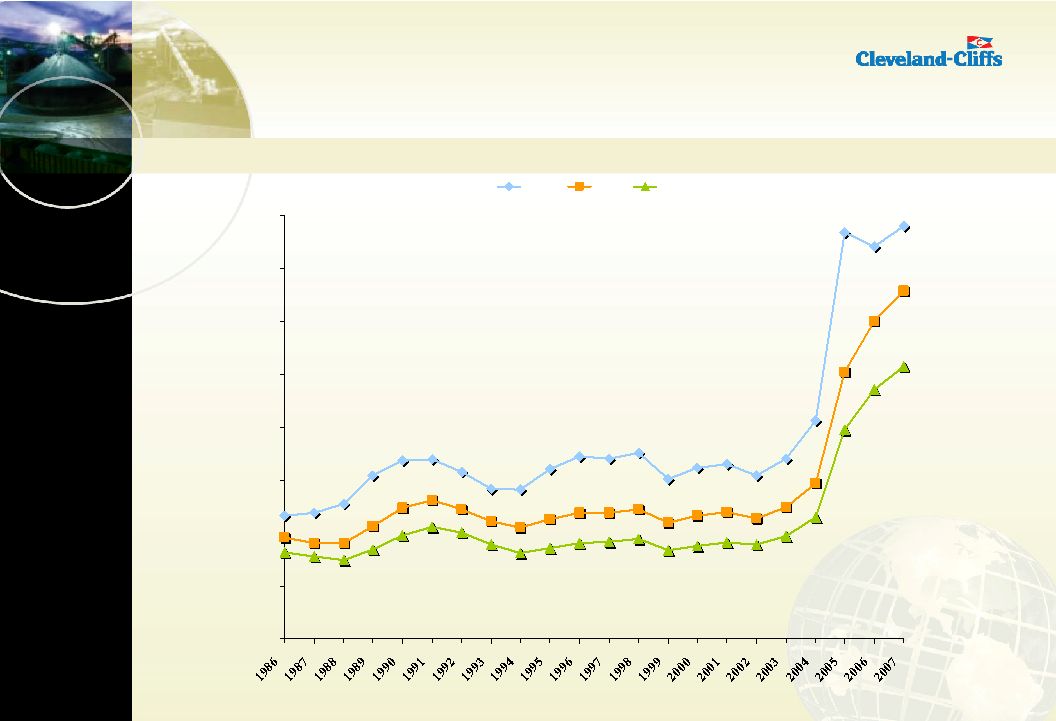 19 $0 $10 $20 $30 $40 $50 $60 $70 $80 Pellets Lump Fines GLOBAL IRON ORE HISTORIC MARKET PRICES Pellet Prices $DMT Based on Eastern Canadian Pellet Price With 64% Iron
Content Lump and Fines $DMT for Australian Iron Ore Shipments to
Japan Source: TEX Report, Cleveland-Cliffs +86% +5.3% +19% +71.5% -3% +9.5% +71.5% +19% +9.5% Our Industry |
 20 CLIFFS PROFILE |
 21 Early 1950s High-grade ore exhausted in North America; enriching leaner ore becomes a
necessity Late 1990s/Early 2000s Transitions from primarily mine manager to merchant mining company Late 1950s Iron ore pellets become steel industry’s preferred feedstock 2005 Acquires Portman Limited, then Australia’s 3rd-largest iron ore miner 2006 Joseph Carrabba named CEO Reorganized into business-unit structure 2007 Planned expansions: Latin America Diversify into coking coal CLIFFS’ KEY EVENTS Cliffs’ Profile |
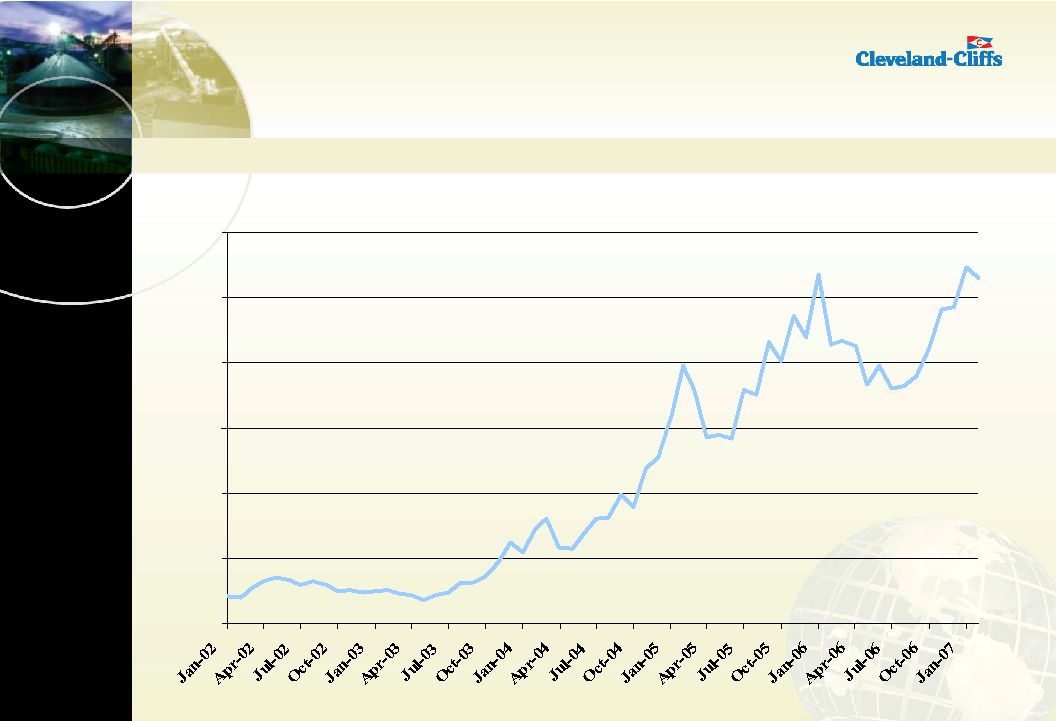 22 CLIFFS STOCK PERFORMANCE Cleveland-Cliffs’ Stock Price: January 1, 2002 – February 1, 2007 (Adjusted for dividends and stock splits) $0 $10 $20 $30 $40 $50 $60 |
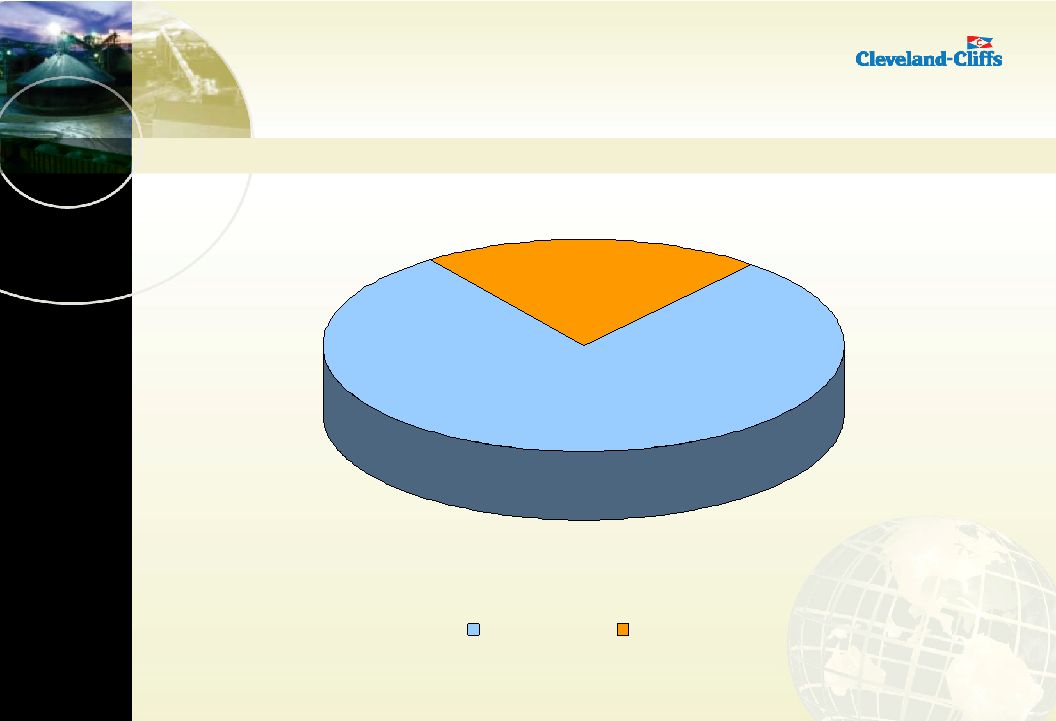 23 CLIFFS’ SALES BY SEGMENT 21% 79% North America Austalia Cliffs’ Profile |
 24 0 5 10 15 20 25 30 35 40 45 2001 2002 2003 2004 2005* 2006* Managed Production Cliffs' Equity Production Cliffs' Sales *Reflects Cliffs’ Portman ownership as of 3/31/2005, and includes minority interest.
Managed production does not include Portman’s 50%
joint-venture interest in the Cockatoo Island operation. CLIFFS’ CONSOLIDATED PRODUCTION AND SALES (Million Gross Tons) Cliffs’ Profile |
 25 CLIFFS’ PROFILE NORTH AMERICA |
 26 CLIFFS’ PROFILE NORTH AMERICA • Largest supplier of iron ore pellets to the integrated steel industry
in North America • Cliffs led the consolidation of the North American iron ore industry and obtained a larger share of the market • Virtually 100% of current North American iron ore production is committed to long-term sales agreements North America |
 27 NORTH AMERICAN INTEGRATED STEEL North America 2001 Market Participants 2006 Market Participants US Steel 20% Bethlehem 15% Other 13% LTV 11% National 10% Stelco 10% Ispat 6% Weirton 5% Algoma 4% Rouge 3% Dofasco 3% Mittal 39% US Steel 30% Stelco 10% AK Steel 7% Other 7% Algoma 4% Severstal 3% |
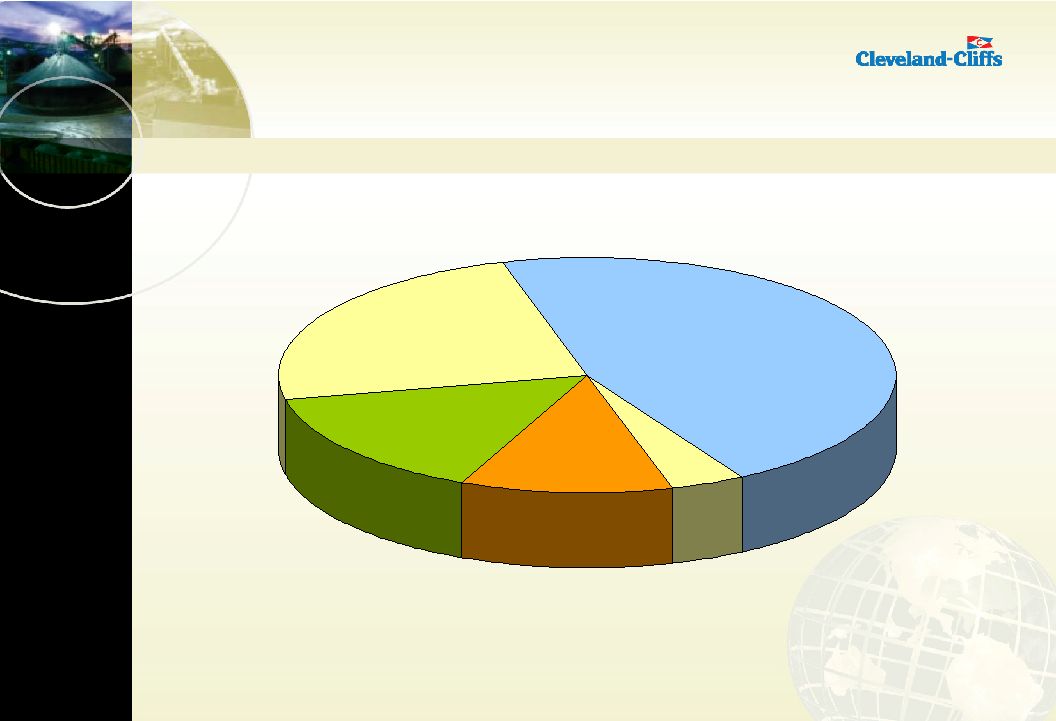 28 4% 11% 15% 24% 46% US Steel Quebec Cartier Mining Company Minorca (Mittal) Cliffs Managed Iron Ore Company of Canada NORTH AMERICAN PELLET PRODUCERS North America |
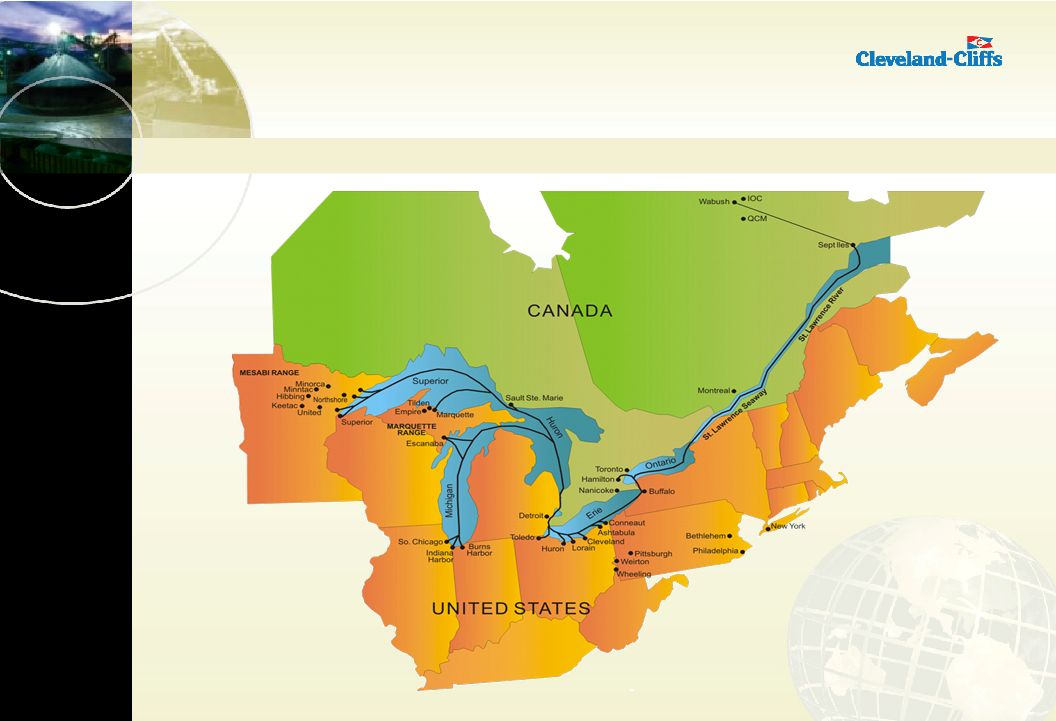 29 CLIFFS’ IRON ORE SHIPPING ROUTES North America |
 30 CLIFFS’ PROFILE ASIA-PACIFIC |
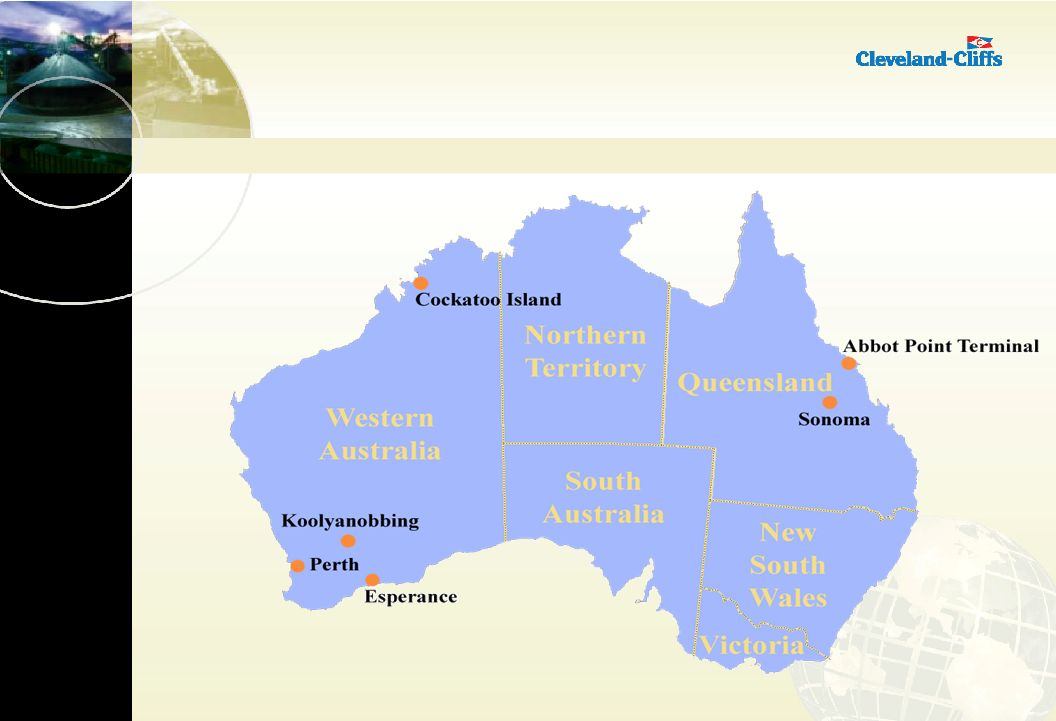 31 CLIFFS ASIA-PACIFIC Asia-Pacific |
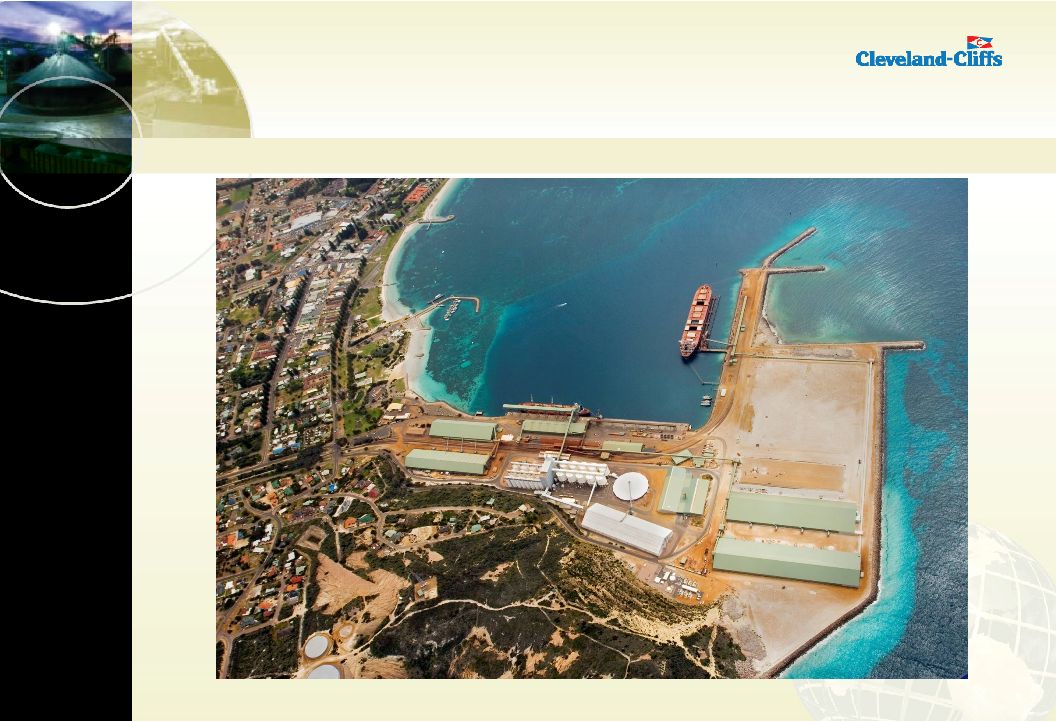 32 PORTMAN PORT OPERATIONS, ESPERANCE Asia-Pacific |
 33 GLOBAL MARKET GROWTH PORTMAN • Provided immediate presence in Australia and Asia • When acquired by Cliffs, Portman Limited was Australia’s third-largest iron ore producer • Access to fastest growing steel markets and relationships where Cliffs’ iron ore competencies can be levered • Capacity increased from 6 million to 8 million tonnes in 2006 • Portman has 89 million tonnes of proved reserves and an active exploration program • Production contracted for next three years • Customers in China (73%) and Japan (27%) Asia-Pacific |
 34 ASIA-PACIFIC MARKET GROWTH SONOMA COAL PROJECT • Partnered with QCoal for a 45% interest in the Sonoma Project • At the northern limit of Queensland’s Bowen Basin coalfields
• Initial production two million tonnes beginning in late 2007 • Production increasing to between three million and four million tonnes in 2008 • JORC Resource estimate of 97 million tonnes • Moves by rail to the Abbot Point Bulk Coal Terminal for export • Oversight by Cliffs Asia-Pacific unit in Perth • Cliffs’ investment ~ $109 million Asia-Pacific |
 35 CLIFFS’ PROFILE LATIN AMERICA |
 36 • Regional office opened February 1, 2007, in Rio de Janeiro staffed by two ex-pats • Active business development program evaluating numerous deposits • Amapá provides an attractive opportunity in Latin America and, over time, is anticipated to serve as a platform for further expanding Cliffs’ presence in the region LATIN AMERICA Latin America |
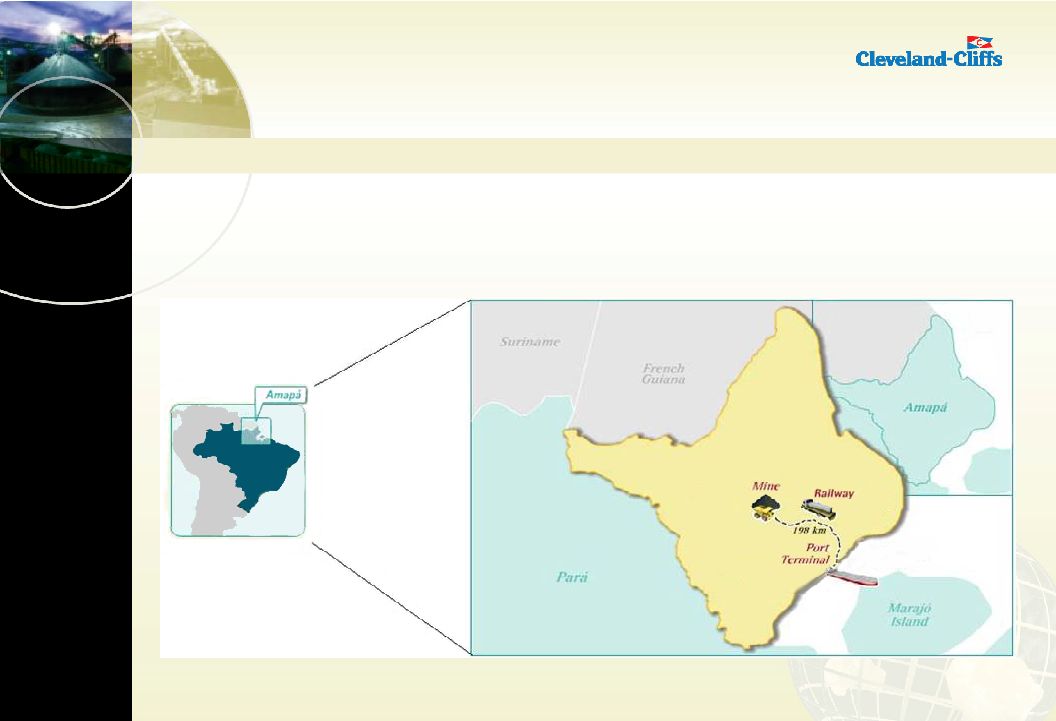 37 AMAPÁ PROJECT • Signed share purchase agreement with MMX Mineração e Metálicos SA for the purchase of 100% of the shares of Centennial Asset Amapá Participações SA Latin America |
 38 • Centennial Amapá owns 30% of the Amapá Project, a Brazilian iron ore project on the banks of the Amazon – Iron ore deposit – 192-kilometer railway – 71 hectares of real estate • Cliffs would purchase 100% of the shares of Centennial Amapá
for $133 million • Anticipated ~ $275 million in future capital • Expected to produce 6.5 million tonnes of iron ore concentrate annually once fully operational • Due diligence ongoing AMAPÁ PROJECT Latin America |
 39 FINANCIALS |
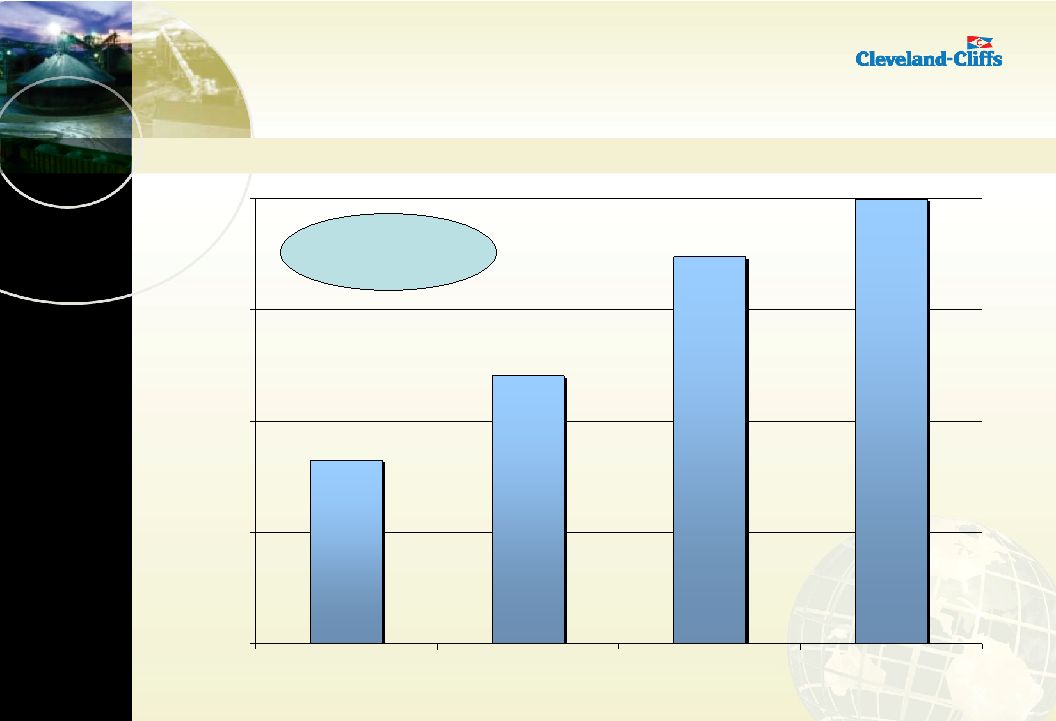 40 Financials CLIFFS’ REVENUES (In Billions) $0.8 $1.2 $1.7 $2.0 $0.0 $0.5 $1.0 $1.5 $2.0 2003 2004 2005 2006 3-Year CAGR = 34% |
 41 Financials CLIFFS’ SALES MARGIN (In Millions) ($9.9) $149.5 $389.0 $435.8 ($50) $50 $150 $250 $350 $450 $550 2003 2004 2005 2006 |
 42 FINANCIAL RESULTS Product Sales and Service Revenue Operating Income Net Income EPS (Diluted) Cash and Marketable Securities Debt Book Net Worth 2 Equity Market Cap 2 Full Year Ended: 1 Includes after-tax gain on sale of ISG stock and the reversal of a
deferred tax asset valuation allowance totaling $213
million 2 Includes convertible preferred stock (All figures in millions) 1,740 357 278 4.99 203 Nil 824 2,482 1,988 388 294 5.46 352 Nil 932 2,529 1,203 118 324 5.90 400 Nil 597 1,393 Dec. 2006 2006 2005 2004 Dec. 2005 Dec. 2004 $ $ $ $ $ $ $ $ $ $ $ $ $ $ $ $ $ $ $ $ $ At December 31, 1 Financials 1 |
 43 SUMMARY |
 44 VISION OF CLIFFS - 2015 Summary Growth and Diversification • Revenues doubled • 50% of revenues from outside of North America • Up to 25% of revenues from outside of iron ore Operational Excellence • MSHA frequency rate below 2.00 • Net savings of $5.00 per ton of iron ore production Global Execution Metrics • Global corporate development, externally recognized as Cliffs expertise • Globally scalable operations • Significant share of management from outside United States Shareholder Returns • Average annual return of 12% • Balanced shareholder returns –Dividends –Share repurchases –Capital appreciation Combined into a vision of a new Cleveland-Cliffs Growth and Diversification Shareholder Returns Global Execution Operational Excellence |
 45 BMO CAPITAL MARKETS 2007 GLOBAL RESOURCES CONFERENCE February 27, 2007 JOSEPH CARRABBA President and Chief Executive Officer LAURIE BRLAS Senior Vice President—CFO and
Treasurer |