00007640652024FYfalsehttp://fasb.org/us-gaap/2024#OtherLiabilitiesCurrenthttp://fasb.org/us-gaap/2024#OtherLiabilitiesCurrenthttp://fasb.org/us-gaap/2024#AccountsPayableCurrenthttp://fasb.org/us-gaap/2024#AccountsPayableCurrenthttp://fasb.org/us-gaap/2024#PropertyPlantAndEquipmentNethttp://fasb.org/us-gaap/2024#PropertyPlantAndEquipmentNetImplemented236648508516031295P1Yhttp://fasb.org/us-gaap/2024#PropertyPlantAndEquipmentNethttp://fasb.org/us-gaap/2024#PropertyPlantAndEquipmentNethttp://fasb.org/us-gaap/2024#OtherAssetsNoncurrenthttp://fasb.org/us-gaap/2024#OtherAssetsNoncurrenthttp://fasb.org/us-gaap/2024#OtherLiabilitiesCurrenthttp://fasb.org/us-gaap/2024#OtherLiabilitiesCurrenthttp://fasb.org/us-gaap/2024#OtherLiabilitiesCurrenthttp://fasb.org/us-gaap/2024#OtherLiabilitiesCurrenthttp://fasb.org/us-gaap/2024#OtherLiabilitiesNoncurrenthttp://fasb.org/us-gaap/2024#OtherLiabilitiesNoncurrenthttp://fasb.org/us-gaap/2024#OtherLiabilitiesNoncurrenthttp://fasb.org/us-gaap/2024#OtherLiabilitiesNoncurrenthttp://fasb.org/us-gaap/2024#OtherLiabilitieshttp://fasb.org/us-gaap/2024#OtherLiabilitieshttp://fasb.org/us-gaap/2024#OtherLiabilitiesCurrenthttp://fasb.org/us-gaap/2024#OtherLiabilitiesCurrenthttp://fasb.org/us-gaap/2024#OtherLiabilitiesNoncurrenthttp://fasb.org/us-gaap/2024#OtherLiabilitiesNoncurrenthttp://fasb.org/us-gaap/2024#OtherLiabilitiesCurrenthttp://fasb.org/us-gaap/2024#OtherLiabilitiesCurrenthttp://fasb.org/us-gaap/2024#OtherLiabilitiesCurrenthttp://fasb.org/us-gaap/2024#OtherLiabilitiesCurrenthttp://fasb.org/us-gaap/2024#OtherLiabilitiesNoncurrenthttp://fasb.org/us-gaap/2024#OtherLiabilitiesNoncurrentiso4217:USDxbrli:sharesiso4217:USDxbrli:sharesclf:employeeiso4217:CADxbrli:sharesxbrli:pureclf:segmentiso4217:CADclf:Daysclf:dayclf:MMBtuutr:MWh00007640652024-01-012024-12-3100007640652024-06-3000007640652025-02-2500007640652024-12-3100007640652023-12-3100007640652023-01-012023-12-3100007640652022-01-012022-12-310000764065clf:StelcoHoldingsIncMember2024-01-012024-12-310000764065clf:StelcoHoldingsIncMember2023-01-012023-12-310000764065clf:StelcoHoldingsIncMember2022-01-012022-12-310000764065clf:FerrousProcessingAndTradingMember2024-01-012024-12-310000764065clf:FerrousProcessingAndTradingMember2023-01-012023-12-310000764065clf:FerrousProcessingAndTradingMember2022-01-012022-12-3100007640652022-12-3100007640652021-12-310000764065us-gaap:CommonStockMember2021-12-310000764065us-gaap:AdditionalPaidInCapitalMember2021-12-310000764065us-gaap:RetainedEarningsMember2021-12-310000764065us-gaap:TreasuryStockCommonMember2021-12-310000764065us-gaap:AccumulatedOtherComprehensiveIncomeMember2021-12-310000764065us-gaap:NoncontrollingInterestMember2021-12-310000764065us-gaap:RetainedEarningsMember2022-01-012022-12-310000764065us-gaap:AccumulatedOtherComprehensiveIncomeMember2022-01-012022-12-310000764065us-gaap:NoncontrollingInterestMember2022-01-012022-12-310000764065us-gaap:CommonStockMember2022-01-012022-12-310000764065us-gaap:AdditionalPaidInCapitalMember2022-01-012022-12-310000764065us-gaap:TreasuryStockCommonMember2022-01-012022-12-310000764065us-gaap:CommonStockMember2022-12-310000764065us-gaap:AdditionalPaidInCapitalMember2022-12-310000764065us-gaap:RetainedEarningsMember2022-12-310000764065us-gaap:TreasuryStockCommonMember2022-12-310000764065us-gaap:AccumulatedOtherComprehensiveIncomeMember2022-12-310000764065us-gaap:NoncontrollingInterestMember2022-12-310000764065us-gaap:RetainedEarningsMember2023-01-012023-12-310000764065us-gaap:AccumulatedOtherComprehensiveIncomeMember2023-01-012023-12-310000764065us-gaap:NoncontrollingInterestMember2023-01-012023-12-310000764065us-gaap:CommonStockMember2023-01-012023-12-310000764065us-gaap:AdditionalPaidInCapitalMember2023-01-012023-12-310000764065us-gaap:TreasuryStockCommonMember2023-01-012023-12-310000764065us-gaap:CommonStockMember2023-12-310000764065us-gaap:AdditionalPaidInCapitalMember2023-12-310000764065us-gaap:RetainedEarningsMember2023-12-310000764065us-gaap:TreasuryStockCommonMember2023-12-310000764065us-gaap:AccumulatedOtherComprehensiveIncomeMember2023-12-310000764065us-gaap:NoncontrollingInterestMember2023-12-310000764065us-gaap:RetainedEarningsMember2024-01-012024-12-310000764065us-gaap:AccumulatedOtherComprehensiveIncomeMember2024-01-012024-12-310000764065us-gaap:NoncontrollingInterestMember2024-01-012024-12-310000764065clf:StelcoHoldingsIncMemberus-gaap:CommonStockMember2024-01-012024-12-310000764065clf:StelcoHoldingsIncMemberus-gaap:AdditionalPaidInCapitalMember2024-01-012024-12-310000764065clf:StelcoHoldingsIncMemberus-gaap:TreasuryStockCommonMember2024-01-012024-12-310000764065us-gaap:CommonStockMember2024-01-012024-12-310000764065us-gaap:AdditionalPaidInCapitalMember2024-01-012024-12-310000764065us-gaap:TreasuryStockCommonMember2024-01-012024-12-310000764065us-gaap:CommonStockMember2024-12-310000764065us-gaap:AdditionalPaidInCapitalMember2024-12-310000764065us-gaap:RetainedEarningsMember2024-12-310000764065us-gaap:TreasuryStockCommonMember2024-12-310000764065us-gaap:AccumulatedOtherComprehensiveIncomeMember2024-12-310000764065us-gaap:NoncontrollingInterestMember2024-12-310000764065clf:StelcoHoldingsIncMemberclf:StelcoHoldingsIncMember2024-11-010000764065clf:StelcoHoldingsIncMember2024-11-012024-11-010000764065us-gaap:OtherNoncurrentAssetsMember2024-12-310000764065us-gaap:OtherNoncurrentAssetsMember2023-12-310000764065srt:MinimumMemberus-gaap:LandImprovementsMember2024-12-310000764065srt:MaximumMemberus-gaap:LandImprovementsMember2024-12-310000764065srt:MinimumMemberus-gaap:BuildingMember2024-12-310000764065srt:MaximumMemberus-gaap:BuildingMember2024-12-310000764065srt:MinimumMemberus-gaap:EquipmentMember2024-12-310000764065srt:MaximumMemberus-gaap:EquipmentMember2024-12-310000764065us-gaap:OtherCurrentLiabilitiesMember2024-12-310000764065us-gaap:OtherCurrentLiabilitiesMember2023-12-310000764065us-gaap:AccountsPayableMember2024-12-310000764065us-gaap:AccountsPayableMember2023-12-310000764065us-gaap:OtherCurrentLiabilitiesMember2024-01-012024-12-310000764065us-gaap:AccountsPayableMember2024-01-012024-12-310000764065us-gaap:EmployeeSeveranceMember2023-12-310000764065us-gaap:OtherRestructuringMember2023-12-310000764065clf:AssetImpairmentsMember2023-12-310000764065us-gaap:EmployeeSeveranceMember2024-01-012024-12-310000764065us-gaap:OtherRestructuringMember2024-01-012024-12-310000764065clf:AssetImpairmentsMember2024-04-012024-06-300000764065clf:AssetImpairmentsMember2024-01-012024-12-310000764065us-gaap:EmployeeSeveranceMember2024-12-310000764065us-gaap:OtherRestructuringMember2024-12-310000764065clf:AssetImpairmentsMember2024-12-310000764065us-gaap:OtherPostretirementBenefitPlansDefinedBenefitMember2024-01-012024-12-310000764065us-gaap:OtherOperatingIncomeExpenseMember2024-01-012024-12-310000764065clf:StelcoHoldingsIncMember2024-11-010000764065clf:StelcoHoldingsIncMember2021-11-182021-11-180000764065clf:StelcoHoldingsIncMemberus-gaap:CustomerRelationshipsMember2024-11-012024-11-010000764065clf:StelcoHoldingsIncMemberus-gaap:TrademarksAndTradeNamesMember2024-11-012024-11-010000764065clf:StelcoHoldingsIncMemberus-gaap:FairValueAdjustmentToInventoryMember2024-01-012024-12-310000764065clf:StelcoHoldingsIncMemberus-gaap:FairValueAdjustmentToInventoryMember2023-01-012023-12-310000764065clf:StelcoHoldingsIncMemberus-gaap:AcquisitionRelatedCostsMember2024-01-012024-12-310000764065clf:StelcoHoldingsIncMemberus-gaap:AcquisitionRelatedCostsMember2023-01-012023-12-310000764065clf:AutomotiveMemberclf:SteelmakingMember2024-01-012024-12-310000764065clf:AutomotiveMemberclf:SteelmakingMember2023-01-012023-12-310000764065clf:AutomotiveMemberclf:SteelmakingMember2022-01-012022-12-310000764065clf:InfrastructureAndManufacturingMemberclf:SteelmakingMember2024-01-012024-12-310000764065clf:InfrastructureAndManufacturingMemberclf:SteelmakingMember2023-01-012023-12-310000764065clf:InfrastructureAndManufacturingMemberclf:SteelmakingMember2022-01-012022-12-310000764065clf:DistributorsAndConvertersMemberclf:SteelmakingMember2024-01-012024-12-310000764065clf:DistributorsAndConvertersMemberclf:SteelmakingMember2023-01-012023-12-310000764065clf:DistributorsAndConvertersMemberclf:SteelmakingMember2022-01-012022-12-310000764065clf:SteelProducersMemberclf:SteelmakingMember2024-01-012024-12-310000764065clf:SteelProducersMemberclf:SteelmakingMember2023-01-012023-12-310000764065clf:SteelProducersMemberclf:SteelmakingMember2022-01-012022-12-310000764065clf:ThirdPartyMemberclf:SteelmakingMember2024-01-012024-12-310000764065clf:ThirdPartyMemberclf:SteelmakingMember2023-01-012023-12-310000764065clf:ThirdPartyMemberclf:SteelmakingMember2022-01-012022-12-310000764065clf:AutomotiveMemberclf:OtherBusinessesMember2024-01-012024-12-310000764065clf:AutomotiveMemberclf:OtherBusinessesMember2023-01-012023-12-310000764065clf:AutomotiveMemberclf:OtherBusinessesMember2022-01-012022-12-310000764065clf:InfrastructureAndManufacturingMemberclf:OtherBusinessesMember2024-01-012024-12-310000764065clf:InfrastructureAndManufacturingMemberclf:OtherBusinessesMember2023-01-012023-12-310000764065clf:InfrastructureAndManufacturingMemberclf:OtherBusinessesMember2022-01-012022-12-310000764065clf:DistributorsAndConvertersMemberclf:OtherBusinessesMember2024-01-012024-12-310000764065clf:DistributorsAndConvertersMemberclf:OtherBusinessesMember2023-01-012023-12-310000764065clf:DistributorsAndConvertersMemberclf:OtherBusinessesMember2022-01-012022-12-310000764065clf:OtherBusinessesMember2024-01-012024-12-310000764065clf:OtherBusinessesMember2023-01-012023-12-310000764065clf:OtherBusinessesMember2022-01-012022-12-310000764065clf:HotRolledSteelMemberclf:SteelmakingMember2024-01-012024-12-310000764065clf:HotRolledSteelMemberclf:SteelmakingMember2023-01-012023-12-310000764065clf:HotRolledSteelMemberclf:SteelmakingMember2022-01-012022-12-310000764065clf:ColdRolledSteelMemberclf:SteelmakingMember2024-01-012024-12-310000764065clf:ColdRolledSteelMemberclf:SteelmakingMember2023-01-012023-12-310000764065clf:ColdRolledSteelMemberclf:SteelmakingMember2022-01-012022-12-310000764065clf:CoatedSteelMemberclf:SteelmakingMember2024-01-012024-12-310000764065clf:CoatedSteelMemberclf:SteelmakingMember2023-01-012023-12-310000764065clf:CoatedSteelMemberclf:SteelmakingMember2022-01-012022-12-310000764065clf:StainlessAndElectricalSteelMemberclf:SteelmakingMember2024-01-012024-12-310000764065clf:StainlessAndElectricalSteelMemberclf:SteelmakingMember2023-01-012023-12-310000764065clf:StainlessAndElectricalSteelMemberclf:SteelmakingMember2022-01-012022-12-310000764065clf:PlateMemberclf:SteelmakingMember2024-01-012024-12-310000764065clf:PlateMemberclf:SteelmakingMember2023-01-012023-12-310000764065clf:PlateMemberclf:SteelmakingMember2022-01-012022-12-310000764065clf:OtherSteelProductsMemberclf:SteelmakingMember2024-01-012024-12-310000764065clf:OtherSteelProductsMemberclf:SteelmakingMember2023-01-012023-12-310000764065clf:OtherSteelProductsMemberclf:SteelmakingMember2022-01-012022-12-310000764065clf:OtherMemberclf:SteelmakingMember2024-01-012024-12-310000764065clf:OtherMemberclf:SteelmakingMember2023-01-012023-12-310000764065clf:OtherMemberclf:SteelmakingMember2022-01-012022-12-310000764065clf:OtherMemberclf:OtherBusinessesMember2024-01-012024-12-310000764065clf:OtherMemberclf:OtherBusinessesMember2023-01-012023-12-310000764065clf:OtherMemberclf:OtherBusinessesMember2022-01-012022-12-310000764065clf:SteelmakingMember2024-01-012024-12-310000764065clf:EliminationsMember2024-01-012024-12-310000764065clf:EBITDACalculationMember2024-01-012024-12-310000764065clf:AdjustedEBITDACalculationMember2024-01-012024-12-310000764065clf:SteelmakingMember2024-12-310000764065clf:OtherBusinessesMember2024-12-310000764065clf:EliminationsMember2024-12-310000764065clf:SteelmakingMember2023-01-012023-12-310000764065clf:EliminationsMember2023-01-012023-12-310000764065clf:EBITDACalculationMember2023-01-012023-12-310000764065clf:SteelmakingMember2023-12-310000764065clf:OtherBusinessesMember2023-12-310000764065clf:EliminationsMember2023-12-310000764065clf:SteelmakingMember2022-01-012022-12-310000764065clf:EliminationsMember2022-01-012022-12-310000764065clf:EBITDACalculationMember2022-01-012022-12-310000764065clf:AdjustedEBITDACalculationMember2022-01-012022-12-310000764065clf:SteelmakingMember2022-12-310000764065clf:OtherBusinessesMember2022-12-310000764065clf:EliminationsMember2022-12-310000764065country:US2024-01-012024-12-310000764065country:US2023-01-012023-12-310000764065country:US2022-01-012022-12-310000764065country:CA2024-01-012024-12-310000764065country:CA2023-01-012023-12-310000764065country:CA2022-01-012022-12-310000764065clf:OtherCountriesMember2024-01-012024-12-310000764065clf:OtherCountriesMember2023-01-012023-12-310000764065clf:OtherCountriesMember2022-01-012022-12-310000764065country:US2024-12-310000764065country:US2023-12-310000764065country:US2022-12-310000764065country:CA2024-12-310000764065country:CA2023-12-310000764065country:CA2022-12-310000764065clf:OtherCountriesMember2024-12-310000764065clf:OtherCountriesMember2023-12-310000764065clf:OtherCountriesMember2022-12-310000764065clf:LandlandimprovementsandmineralrightsMember2024-12-310000764065clf:LandlandimprovementsandmineralrightsMember2023-12-310000764065us-gaap:BuildingMember2024-12-310000764065us-gaap:BuildingMember2023-12-310000764065us-gaap:MachineryAndEquipmentMember2024-12-310000764065us-gaap:MachineryAndEquipmentMember2023-12-310000764065us-gaap:OtherCapitalizedPropertyPlantAndEquipmentMember2024-12-310000764065us-gaap:OtherCapitalizedPropertyPlantAndEquipmentMember2023-12-310000764065us-gaap:ConstructionInProgressMember2024-12-310000764065us-gaap:ConstructionInProgressMember2023-12-310000764065clf:MiddletownMember2023-01-012023-12-310000764065clf:IndianaHarborMember2023-01-012023-12-310000764065us-gaap:CustomerRelationshipsMember2024-12-310000764065us-gaap:CustomerRelationshipsMember2023-12-310000764065us-gaap:TechnologyBasedIntangibleAssetsMember2024-12-310000764065us-gaap:TechnologyBasedIntangibleAssetsMember2023-12-310000764065us-gaap:TradeNamesMember2024-12-310000764065us-gaap:TradeNamesMember2023-12-310000764065clf:MiningPermitsMember2024-12-310000764065clf:MiningPermitsMember2023-12-310000764065clf:SupplierRelationshipsMember2024-12-310000764065clf:SupplierRelationshipsMember2023-12-310000764065clf:A67502026SeniorSecuredNotesMemberclf:ClevelandCliffsInc.Member2024-12-310000764065clf:A67502026SeniorSecuredNotesMemberclf:ClevelandCliffsInc.Member2023-12-310000764065clf:A70002027SeniorNotesMemberclf:ClevelandCliffsInc.Member2024-12-310000764065clf:A70002027SeniorNotesMemberclf:ClevelandCliffsInc.Member2023-12-310000764065clf:A70002027AKSeniorNotesMemberclf:AKSteelMember2024-12-310000764065clf:A70002027AKSeniorNotesMemberclf:AKSteelMember2023-12-310000764065clf:A5.8752027SeniorNotesMemberclf:ClevelandCliffsInc.Member2024-12-310000764065clf:A5.8752027SeniorNotesMemberclf:ClevelandCliffsInc.Member2023-12-310000764065clf:A46252029SeniorNotesMemberclf:ClevelandCliffsInc.Member2024-12-310000764065clf:A46252029SeniorNotesMemberclf:ClevelandCliffsInc.Member2023-12-310000764065clf:A6.8752029SeniorNotesMemberclf:ClevelandCliffsInc.Member2024-10-220000764065clf:A6.8752029SeniorNotesMemberclf:ClevelandCliffsInc.Member2023-12-310000764065clf:A67502030SeniorNotesMemberclf:ClevelandCliffsInc.Member2024-12-310000764065clf:A67502030SeniorNotesMemberclf:ClevelandCliffsInc.Member2023-12-310000764065clf:A48752031SeniorNotesMemberclf:ClevelandCliffsInc.Member2024-12-310000764065clf:A48752031SeniorNotesMemberclf:ClevelandCliffsInc.Member2023-12-310000764065clf:A7.0002032SeniorNotesMemberclf:ClevelandCliffsInc.Member2024-12-310000764065clf:A7.0002032SeniorNotesMemberclf:ClevelandCliffsInc.Member2023-12-310000764065clf:A7.3752033SeniorNotesMemberclf:ClevelandCliffsInc.Member2024-10-220000764065clf:A7.3752033SeniorNotesMemberclf:ClevelandCliffsInc.Member2023-12-310000764065clf:A62502040SeniorNotesMemberclf:ClevelandCliffsInc.Member2024-12-310000764065clf:A62502040SeniorNotesMemberclf:ClevelandCliffsInc.Member2023-12-310000764065us-gaap:RevolvingCreditFacilityMemberclf:ClevelandCliffsInc.Member2024-12-310000764065us-gaap:RevolvingCreditFacilityMemberclf:ClevelandCliffsInc.Member2023-12-310000764065clf:A7.0002032SeniorNotesMemberclf:ClevelandCliffsInc.Member2024-03-180000764065clf:A7.0002032SeniorNotesMemberclf:ClevelandCliffsInc.Member2024-08-160000764065clf:A7.0002032SeniorNotesMemberclf:ClevelandCliffsInc.Member2024-08-162024-08-160000764065clf:A7.0002032SeniorNotesMemberclf:ClevelandCliffsInc.Membersrt:MinimumMember2024-01-012024-12-310000764065clf:A7.0002032SeniorNotesMemberclf:ClevelandCliffsInc.Memberus-gaap:DebtInstrumentRedemptionPeriodOneMember2024-01-012024-12-310000764065clf:A7.0002032SeniorNotesMemberclf:ClevelandCliffsInc.Memberclf:DebtInstrumentRedemptionPeriodOneUponEquityIssuanceMember2024-01-012024-12-310000764065clf:A7.0002032SeniorNotesMemberclf:ClevelandCliffsInc.Memberus-gaap:DebtInstrumentRedemptionPeriodTwoMember2024-01-012024-12-310000764065clf:A7.0002032SeniorNotesMemberclf:ClevelandCliffsInc.Memberus-gaap:DebtInstrumentRedemptionPeriodThreeMember2024-01-012024-12-310000764065clf:A7.0002032SeniorNotesMemberclf:ClevelandCliffsInc.Member2024-01-012024-12-310000764065clf:A6.8752029SeniorNotesMemberclf:ClevelandCliffsInc.Memberus-gaap:DebtInstrumentRedemptionPeriodOneMember2024-01-012024-12-310000764065clf:A6.8752029SeniorNotesMemberclf:ClevelandCliffsInc.Memberclf:DebtInstrumentRedemptionPeriodOneUponEquityIssuanceMember2024-01-012024-12-310000764065clf:A6.8752029SeniorNotesMemberclf:ClevelandCliffsInc.Memberus-gaap:DebtInstrumentRedemptionPeriodTwoMember2024-01-012024-12-310000764065clf:A6.8752029SeniorNotesMemberclf:ClevelandCliffsInc.Member2024-01-012024-12-310000764065clf:A7.3752033SeniorNotesMemberclf:ClevelandCliffsInc.Membersrt:MinimumMember2024-01-012024-12-310000764065clf:A7.3752033SeniorNotesMemberclf:ClevelandCliffsInc.Memberus-gaap:DebtInstrumentRedemptionPeriodOneMember2024-01-012024-12-310000764065clf:A7.3752033SeniorNotesMemberclf:ClevelandCliffsInc.Memberclf:DebtInstrumentRedemptionPeriodOneUponEquityIssuanceMember2024-01-012024-12-310000764065clf:A7.3752033SeniorNotesMemberclf:ClevelandCliffsInc.Memberus-gaap:DebtInstrumentRedemptionPeriodTwoMember2024-01-012024-12-310000764065clf:A7.3752033SeniorNotesMemberclf:ClevelandCliffsInc.Member2024-01-012024-12-310000764065clf:A70002027SeniorNotesMemberclf:ClevelandCliffsInc.Memberus-gaap:DebtInstrumentRedemptionPeriodOneMember2024-01-012024-12-310000764065clf:A5.8752027SeniorNotesMemberclf:ClevelandCliffsInc.Memberus-gaap:DebtInstrumentRedemptionPeriodOneMember2024-01-012024-12-310000764065clf:A46252029SeniorNotesMemberclf:ClevelandCliffsInc.Memberus-gaap:DebtInstrumentRedemptionPeriodTwoMember2024-01-012024-12-310000764065clf:A46252029SeniorNotesMemberclf:ClevelandCliffsInc.Memberus-gaap:DebtInstrumentRedemptionPeriodThreeMember2024-01-012024-12-310000764065clf:A67502030SeniorNotesMemberclf:ClevelandCliffsInc.Memberus-gaap:DebtInstrumentRedemptionPeriodOneMember2024-01-012024-12-310000764065clf:A67502030SeniorNotesMemberclf:ClevelandCliffsInc.Memberclf:DebtInstrumentRedemptionPeriodOneUponEquityIssuanceMember2024-01-012024-12-310000764065clf:A67502030SeniorNotesMemberclf:ClevelandCliffsInc.Memberus-gaap:DebtInstrumentRedemptionPeriodTwoMember2024-01-012024-12-310000764065clf:A67502030SeniorNotesMemberclf:ClevelandCliffsInc.Memberus-gaap:DebtInstrumentRedemptionPeriodThreeMember2024-01-012024-12-310000764065clf:A48752031SeniorNotesMemberclf:ClevelandCliffsInc.Memberclf:DebtInstrumentRedemptionPeriodOneUponEquityIssuanceMember2024-01-012024-12-310000764065clf:A48752031SeniorNotesMemberclf:ClevelandCliffsInc.Memberus-gaap:DebtInstrumentRedemptionPeriodTwoMember2024-01-012024-12-310000764065clf:A48752031SeniorNotesMemberclf:ClevelandCliffsInc.Memberus-gaap:DebtInstrumentRedemptionPeriodThreeMember2024-01-012024-12-310000764065clf:A48752031SeniorNotesMemberclf:ClevelandCliffsInc.Memberus-gaap:DebtInstrumentRedemptionPeriodFourMember2024-01-012024-12-310000764065clf:A62502040SeniorNotesMemberclf:ClevelandCliffsInc.Membersrt:MinimumMember2024-01-012024-12-310000764065clf:A62502040SeniorNotesMemberclf:ClevelandCliffsInc.Membersrt:MaximumMember2024-01-012024-12-310000764065clf:A62502040SeniorNotesMemberclf:ClevelandCliffsInc.Memberus-gaap:DebtInstrumentRedemptionPeriodOneMember2024-01-012024-12-310000764065clf:A62502040SeniorNotesMemberclf:ClevelandCliffsInc.Memberus-gaap:DebtInstrumentRedemptionPeriodTwoMember2024-01-012024-12-310000764065us-gaap:UnsecuredDebtMemberclf:ClevelandCliffsInc.Member2024-01-012024-12-310000764065clf:A70002027AKSeniorNotesMemberclf:AKSteelMemberus-gaap:DebtInstrumentRedemptionPeriodTwoMember2024-01-012024-12-310000764065us-gaap:RevolvingCreditFacilityMemberus-gaap:LineOfCreditMember2024-09-130000764065us-gaap:RevolvingCreditFacilityMemberus-gaap:LineOfCreditMember2024-01-012024-12-310000764065us-gaap:RevolvingCreditFacilityMember2024-12-310000764065us-gaap:LetterOfCreditMember2024-12-310000764065clf:A67502026SeniorSecuredNotesMemberclf:ClevelandCliffsInc.Member2024-03-182024-03-180000764065clf:A67502026SeniorSecuredNotesMemberclf:ClevelandCliffsInc.Member2024-04-032024-04-030000764065us-gaap:PensionPlansDefinedBenefitMemberclf:StelcoHoldingsIncMember2024-12-310000764065us-gaap:PensionPlansDefinedBenefitMember2023-12-310000764065us-gaap:PensionPlansDefinedBenefitMember2022-12-310000764065us-gaap:OtherPostretirementBenefitPlansDefinedBenefitMember2023-12-310000764065us-gaap:OtherPostretirementBenefitPlansDefinedBenefitMember2022-12-310000764065us-gaap:PensionPlansDefinedBenefitMember2024-01-012024-12-310000764065us-gaap:PensionPlansDefinedBenefitMember2023-01-012023-12-310000764065us-gaap:OtherPostretirementBenefitPlansDefinedBenefitMember2023-01-012023-12-310000764065us-gaap:PensionPlansDefinedBenefitMember2024-12-310000764065us-gaap:OtherPostretirementBenefitPlansDefinedBenefitMember2024-12-310000764065us-gaap:PensionPlansDefinedBenefitMember2022-01-012022-12-310000764065us-gaap:OtherPostretirementBenefitPlansDefinedBenefitMember2022-01-012022-12-310000764065clf:ChangeinAssumptionsforDefinedBenefitPlansDiscountRatesMemberus-gaap:PensionPlansDefinedBenefitMember2024-01-012024-12-310000764065clf:ChangeinAssumptionsforDefinedBenefitPlansDiscountRatesMemberus-gaap:PensionPlansDefinedBenefitMember2023-01-012023-12-310000764065clf:ChangeinAssumptionsforDefinedBenefitPlansDiscountRatesMemberus-gaap:OtherPostretirementBenefitPlansDefinedBenefitMember2024-01-012024-12-310000764065clf:ChangeinAssumptionsforDefinedBenefitPlansDiscountRatesMemberus-gaap:OtherPostretirementBenefitPlansDefinedBenefitMember2023-01-012023-12-310000764065clf:ChangeinAssumptionsforDefinedBenefitPlansDemographicMemberus-gaap:PensionPlansDefinedBenefitMember2024-01-012024-12-310000764065clf:ChangeinAssumptionsforDefinedBenefitPlansDemographicMemberus-gaap:PensionPlansDefinedBenefitMember2023-01-012023-12-310000764065clf:ChangeinAssumptionsforDefinedBenefitPlansDemographicMemberus-gaap:OtherPostretirementBenefitPlansDefinedBenefitMember2024-01-012024-12-310000764065clf:ChangeinAssumptionsforDefinedBenefitPlansDemographicMemberus-gaap:OtherPostretirementBenefitPlansDefinedBenefitMember2023-01-012023-12-310000764065clf:ChangesinAssumptionsforDefinedBenefitPlansMortalityMemberus-gaap:PensionPlansDefinedBenefitMember2024-01-012024-12-310000764065clf:ChangesinAssumptionsforDefinedBenefitPlansMortalityMemberus-gaap:PensionPlansDefinedBenefitMember2023-01-012023-12-310000764065clf:ChangesinAssumptionsforDefinedBenefitPlansMortalityMemberus-gaap:OtherPostretirementBenefitPlansDefinedBenefitMember2024-01-012024-12-310000764065clf:ChangesinAssumptionsforDefinedBenefitPlansMortalityMemberus-gaap:OtherPostretirementBenefitPlansDefinedBenefitMember2023-01-012023-12-310000764065clf:ChangesinAssumptionsforDefinedBenefitPlansPerCapitaClaimsMemberus-gaap:PensionPlansDefinedBenefitMember2024-01-012024-12-310000764065clf:ChangesinAssumptionsforDefinedBenefitPlansPerCapitaClaimsMemberus-gaap:PensionPlansDefinedBenefitMember2023-01-012023-12-310000764065clf:ChangesinAssumptionsforDefinedBenefitPlansPerCapitaClaimsMemberus-gaap:OtherPostretirementBenefitPlansDefinedBenefitMember2024-01-012024-12-310000764065clf:ChangesinAssumptionsforDefinedBenefitPlansPerCapitaClaimsMemberus-gaap:OtherPostretirementBenefitPlansDefinedBenefitMember2023-01-012023-12-310000764065clf:ChangesinAssumptionsforDefinedBenefitPlansOtherActuarialGainLossMemberus-gaap:PensionPlansDefinedBenefitMember2024-01-012024-12-310000764065clf:ChangesinAssumptionsforDefinedBenefitPlansOtherActuarialGainLossMemberus-gaap:PensionPlansDefinedBenefitMember2023-01-012023-12-310000764065clf:ChangesinAssumptionsforDefinedBenefitPlansOtherActuarialGainLossMemberus-gaap:OtherPostretirementBenefitPlansDefinedBenefitMember2024-01-012024-12-310000764065clf:ChangesinAssumptionsforDefinedBenefitPlansOtherActuarialGainLossMemberus-gaap:OtherPostretirementBenefitPlansDefinedBenefitMember2023-01-012023-12-310000764065clf:ChangesinAssumptionsforDefinedBenefitPlansActuarialGainLossMemberus-gaap:PensionPlansDefinedBenefitMember2024-01-012024-12-310000764065clf:ChangesinAssumptionsforDefinedBenefitPlansActuarialGainLossMemberus-gaap:PensionPlansDefinedBenefitMember2023-01-012023-12-310000764065clf:ChangesinAssumptionsforDefinedBenefitPlansActuarialGainLossMemberus-gaap:OtherPostretirementBenefitPlansDefinedBenefitMember2024-01-012024-12-310000764065clf:ChangesinAssumptionsforDefinedBenefitPlansActuarialGainLossMemberus-gaap:OtherPostretirementBenefitPlansDefinedBenefitMember2023-01-012023-12-310000764065clf:VebaTrustMemberus-gaap:OtherPostretirementBenefitPlansDefinedBenefitMember2023-01-012023-12-310000764065clf:DirectPaymentsMemberus-gaap:OtherPostretirementBenefitPlansDefinedBenefitMember2023-01-012023-12-310000764065clf:VebaTrustMemberus-gaap:OtherPostretirementBenefitPlansDefinedBenefitMember2024-01-012024-12-310000764065clf:DirectPaymentsMemberus-gaap:OtherPostretirementBenefitPlansDefinedBenefitMember2024-01-012024-12-310000764065clf:VebaTrustMemberus-gaap:OtherPostretirementBenefitPlansDefinedBenefitMember2024-12-310000764065clf:DirectPaymentsMemberus-gaap:OtherPostretirementBenefitPlansDefinedBenefitMember2024-12-310000764065us-gaap:PensionPlansDefinedBenefitMemberus-gaap:EquitySecuritiesMember2024-12-310000764065us-gaap:PensionPlansDefinedBenefitMemberus-gaap:EquitySecuritiesMember2023-12-310000764065us-gaap:OtherPostretirementBenefitPlansDefinedBenefitMemberus-gaap:EquitySecuritiesMember2024-12-310000764065us-gaap:OtherPostretirementBenefitPlansDefinedBenefitMemberus-gaap:EquitySecuritiesMember2023-12-310000764065us-gaap:PensionPlansDefinedBenefitMemberus-gaap:FixedIncomeInvestmentsMember2024-12-310000764065us-gaap:PensionPlansDefinedBenefitMemberus-gaap:FixedIncomeInvestmentsMember2023-12-310000764065us-gaap:OtherPostretirementBenefitPlansDefinedBenefitMemberus-gaap:FixedIncomeInvestmentsMember2024-12-310000764065us-gaap:OtherPostretirementBenefitPlansDefinedBenefitMemberus-gaap:FixedIncomeInvestmentsMember2023-12-310000764065us-gaap:PensionPlansDefinedBenefitMemberus-gaap:HedgeFundsMember2024-12-310000764065us-gaap:PensionPlansDefinedBenefitMemberus-gaap:HedgeFundsMember2023-12-310000764065us-gaap:OtherPostretirementBenefitPlansDefinedBenefitMemberus-gaap:HedgeFundsMember2024-12-310000764065us-gaap:OtherPostretirementBenefitPlansDefinedBenefitMemberus-gaap:HedgeFundsMember2023-12-310000764065us-gaap:PensionPlansDefinedBenefitMemberus-gaap:PrivateEquityFundsMember2024-12-310000764065us-gaap:PensionPlansDefinedBenefitMemberus-gaap:PrivateEquityFundsMember2023-12-310000764065us-gaap:OtherPostretirementBenefitPlansDefinedBenefitMemberus-gaap:PrivateEquityFundsMember2024-12-310000764065us-gaap:OtherPostretirementBenefitPlansDefinedBenefitMemberus-gaap:PrivateEquityFundsMember2023-12-310000764065us-gaap:PensionPlansDefinedBenefitMemberus-gaap:StructuredFinanceMember2024-12-310000764065us-gaap:PensionPlansDefinedBenefitMemberus-gaap:StructuredFinanceMember2023-12-310000764065us-gaap:OtherPostretirementBenefitPlansDefinedBenefitMemberus-gaap:StructuredFinanceMember2024-12-310000764065us-gaap:OtherPostretirementBenefitPlansDefinedBenefitMemberus-gaap:StructuredFinanceMember2023-12-310000764065us-gaap:PensionPlansDefinedBenefitMemberus-gaap:RealEstateMember2024-12-310000764065us-gaap:PensionPlansDefinedBenefitMemberus-gaap:RealEstateMember2023-12-310000764065us-gaap:OtherPostretirementBenefitPlansDefinedBenefitMemberus-gaap:RealEstateMember2024-12-310000764065us-gaap:OtherPostretirementBenefitPlansDefinedBenefitMemberus-gaap:RealEstateMember2023-12-310000764065us-gaap:FairValueInputsLevel1Memberus-gaap:PensionPlansDefinedBenefitMemberus-gaap:DefinedBenefitPlanEquitySecuritiesUsMember2024-12-310000764065us-gaap:FairValueInputsLevel1Memberus-gaap:PensionPlansDefinedBenefitMemberus-gaap:DefinedBenefitPlanEquitySecuritiesUsMember2023-12-310000764065us-gaap:FairValueInputsLevel2Memberus-gaap:PensionPlansDefinedBenefitMemberus-gaap:DefinedBenefitPlanEquitySecuritiesUsMember2024-12-310000764065us-gaap:FairValueInputsLevel2Memberus-gaap:PensionPlansDefinedBenefitMemberus-gaap:DefinedBenefitPlanEquitySecuritiesUsMember2023-12-310000764065us-gaap:FairValueInputsLevel3Memberus-gaap:PensionPlansDefinedBenefitMemberus-gaap:DefinedBenefitPlanEquitySecuritiesUsMember2024-12-310000764065us-gaap:FairValueInputsLevel3Memberus-gaap:PensionPlansDefinedBenefitMemberus-gaap:DefinedBenefitPlanEquitySecuritiesUsMember2023-12-310000764065us-gaap:FairValueMeasuredAtNetAssetValuePerShareMemberus-gaap:PensionPlansDefinedBenefitMemberus-gaap:DefinedBenefitPlanEquitySecuritiesUsMember2024-12-310000764065us-gaap:FairValueMeasuredAtNetAssetValuePerShareMemberus-gaap:PensionPlansDefinedBenefitMemberus-gaap:DefinedBenefitPlanEquitySecuritiesUsMember2023-12-310000764065us-gaap:PensionPlansDefinedBenefitMemberus-gaap:DefinedBenefitPlanEquitySecuritiesUsMember2024-12-310000764065us-gaap:PensionPlansDefinedBenefitMemberus-gaap:DefinedBenefitPlanEquitySecuritiesUsMember2023-12-310000764065us-gaap:FairValueInputsLevel1Memberus-gaap:PensionPlansDefinedBenefitMemberus-gaap:DefinedBenefitPlanEquitySecuritiesNonUsMember2024-12-310000764065us-gaap:FairValueInputsLevel1Memberus-gaap:PensionPlansDefinedBenefitMemberus-gaap:DefinedBenefitPlanEquitySecuritiesNonUsMember2023-12-310000764065us-gaap:FairValueInputsLevel2Memberus-gaap:PensionPlansDefinedBenefitMemberus-gaap:DefinedBenefitPlanEquitySecuritiesNonUsMember2024-12-310000764065us-gaap:FairValueInputsLevel2Memberus-gaap:PensionPlansDefinedBenefitMemberus-gaap:DefinedBenefitPlanEquitySecuritiesNonUsMember2023-12-310000764065us-gaap:FairValueInputsLevel3Memberus-gaap:PensionPlansDefinedBenefitMemberus-gaap:DefinedBenefitPlanEquitySecuritiesNonUsMember2024-12-310000764065us-gaap:FairValueInputsLevel3Memberus-gaap:PensionPlansDefinedBenefitMemberus-gaap:DefinedBenefitPlanEquitySecuritiesNonUsMember2023-12-310000764065us-gaap:FairValueMeasuredAtNetAssetValuePerShareMemberus-gaap:PensionPlansDefinedBenefitMemberus-gaap:DefinedBenefitPlanEquitySecuritiesNonUsMember2024-12-310000764065us-gaap:FairValueMeasuredAtNetAssetValuePerShareMemberus-gaap:PensionPlansDefinedBenefitMemberus-gaap:DefinedBenefitPlanEquitySecuritiesNonUsMember2023-12-310000764065us-gaap:PensionPlansDefinedBenefitMemberus-gaap:DefinedBenefitPlanEquitySecuritiesNonUsMember2024-12-310000764065us-gaap:PensionPlansDefinedBenefitMemberus-gaap:DefinedBenefitPlanEquitySecuritiesNonUsMember2023-12-310000764065us-gaap:FairValueInputsLevel1Memberus-gaap:PensionPlansDefinedBenefitMemberus-gaap:USGovernmentAgenciesDebtSecuritiesMember2024-12-310000764065us-gaap:FairValueInputsLevel1Memberus-gaap:PensionPlansDefinedBenefitMemberus-gaap:USGovernmentAgenciesDebtSecuritiesMember2023-12-310000764065us-gaap:FairValueInputsLevel2Memberus-gaap:PensionPlansDefinedBenefitMemberus-gaap:USGovernmentAgenciesDebtSecuritiesMember2024-12-310000764065us-gaap:FairValueInputsLevel2Memberus-gaap:PensionPlansDefinedBenefitMemberus-gaap:USGovernmentAgenciesDebtSecuritiesMember2023-12-310000764065us-gaap:FairValueInputsLevel3Memberus-gaap:PensionPlansDefinedBenefitMemberus-gaap:USGovernmentAgenciesDebtSecuritiesMember2024-12-310000764065us-gaap:FairValueInputsLevel3Memberus-gaap:PensionPlansDefinedBenefitMemberus-gaap:USGovernmentAgenciesDebtSecuritiesMember2023-12-310000764065us-gaap:FairValueMeasuredAtNetAssetValuePerShareMemberus-gaap:PensionPlansDefinedBenefitMemberus-gaap:USGovernmentAgenciesDebtSecuritiesMember2024-12-310000764065us-gaap:FairValueMeasuredAtNetAssetValuePerShareMemberus-gaap:PensionPlansDefinedBenefitMemberus-gaap:USGovernmentAgenciesDebtSecuritiesMember2023-12-310000764065us-gaap:PensionPlansDefinedBenefitMemberus-gaap:USGovernmentAgenciesDebtSecuritiesMember2024-12-310000764065us-gaap:PensionPlansDefinedBenefitMemberus-gaap:USGovernmentAgenciesDebtSecuritiesMember2023-12-310000764065us-gaap:FairValueInputsLevel1Memberus-gaap:PensionPlansDefinedBenefitMemberus-gaap:DomesticCorporateDebtSecuritiesMember2024-12-310000764065us-gaap:FairValueInputsLevel1Memberus-gaap:PensionPlansDefinedBenefitMemberus-gaap:DomesticCorporateDebtSecuritiesMember2023-12-310000764065us-gaap:FairValueInputsLevel2Memberus-gaap:PensionPlansDefinedBenefitMemberus-gaap:DomesticCorporateDebtSecuritiesMember2024-12-310000764065us-gaap:FairValueInputsLevel2Memberus-gaap:PensionPlansDefinedBenefitMemberus-gaap:DomesticCorporateDebtSecuritiesMember2023-12-310000764065us-gaap:FairValueInputsLevel3Memberus-gaap:PensionPlansDefinedBenefitMemberus-gaap:DomesticCorporateDebtSecuritiesMember2024-12-310000764065us-gaap:FairValueInputsLevel3Memberus-gaap:PensionPlansDefinedBenefitMemberus-gaap:DomesticCorporateDebtSecuritiesMember2023-12-310000764065us-gaap:FairValueMeasuredAtNetAssetValuePerShareMemberus-gaap:PensionPlansDefinedBenefitMemberus-gaap:DomesticCorporateDebtSecuritiesMember2024-12-310000764065us-gaap:FairValueMeasuredAtNetAssetValuePerShareMemberus-gaap:PensionPlansDefinedBenefitMemberus-gaap:DomesticCorporateDebtSecuritiesMember2023-12-310000764065us-gaap:PensionPlansDefinedBenefitMemberus-gaap:DomesticCorporateDebtSecuritiesMember2024-12-310000764065us-gaap:PensionPlansDefinedBenefitMemberus-gaap:DomesticCorporateDebtSecuritiesMember2023-12-310000764065us-gaap:FairValueInputsLevel1Memberus-gaap:PensionPlansDefinedBenefitMemberclf:NonUSAndOtherBondsMember2024-12-310000764065us-gaap:FairValueInputsLevel1Memberus-gaap:PensionPlansDefinedBenefitMemberclf:NonUSAndOtherBondsMember2023-12-310000764065us-gaap:FairValueInputsLevel2Memberus-gaap:PensionPlansDefinedBenefitMemberclf:NonUSAndOtherBondsMember2024-12-310000764065us-gaap:FairValueInputsLevel2Memberus-gaap:PensionPlansDefinedBenefitMemberclf:NonUSAndOtherBondsMember2023-12-310000764065us-gaap:FairValueInputsLevel3Memberus-gaap:PensionPlansDefinedBenefitMemberclf:NonUSAndOtherBondsMember2024-12-310000764065us-gaap:FairValueInputsLevel3Memberus-gaap:PensionPlansDefinedBenefitMemberclf:NonUSAndOtherBondsMember2023-12-310000764065us-gaap:FairValueMeasuredAtNetAssetValuePerShareMemberus-gaap:PensionPlansDefinedBenefitMemberclf:NonUSAndOtherBondsMember2024-12-310000764065us-gaap:FairValueMeasuredAtNetAssetValuePerShareMemberus-gaap:PensionPlansDefinedBenefitMemberclf:NonUSAndOtherBondsMember2023-12-310000764065us-gaap:PensionPlansDefinedBenefitMemberclf:NonUSAndOtherBondsMember2024-12-310000764065us-gaap:PensionPlansDefinedBenefitMemberclf:NonUSAndOtherBondsMember2023-12-310000764065us-gaap:FairValueInputsLevel1Memberus-gaap:PensionPlansDefinedBenefitMemberus-gaap:HedgeFundsMember2024-12-310000764065us-gaap:FairValueInputsLevel1Memberus-gaap:PensionPlansDefinedBenefitMemberus-gaap:HedgeFundsMember2023-12-310000764065us-gaap:FairValueInputsLevel2Memberus-gaap:PensionPlansDefinedBenefitMemberus-gaap:HedgeFundsMember2024-12-310000764065us-gaap:FairValueInputsLevel2Memberus-gaap:PensionPlansDefinedBenefitMemberus-gaap:HedgeFundsMember2023-12-310000764065us-gaap:FairValueInputsLevel3Memberus-gaap:PensionPlansDefinedBenefitMemberus-gaap:HedgeFundsMember2024-12-310000764065us-gaap:FairValueInputsLevel3Memberus-gaap:PensionPlansDefinedBenefitMemberus-gaap:HedgeFundsMember2023-12-310000764065us-gaap:FairValueMeasuredAtNetAssetValuePerShareMemberus-gaap:PensionPlansDefinedBenefitMemberus-gaap:HedgeFundsMember2024-12-310000764065us-gaap:FairValueMeasuredAtNetAssetValuePerShareMemberus-gaap:PensionPlansDefinedBenefitMemberus-gaap:HedgeFundsMember2023-12-310000764065us-gaap:FairValueInputsLevel1Memberus-gaap:PensionPlansDefinedBenefitMemberus-gaap:PrivateEquityFundsMember2024-12-310000764065us-gaap:FairValueInputsLevel1Memberus-gaap:PensionPlansDefinedBenefitMemberus-gaap:PrivateEquityFundsMember2023-12-310000764065us-gaap:FairValueInputsLevel2Memberus-gaap:PensionPlansDefinedBenefitMemberus-gaap:PrivateEquityFundsMember2024-12-310000764065us-gaap:FairValueInputsLevel2Memberus-gaap:PensionPlansDefinedBenefitMemberus-gaap:PrivateEquityFundsMember2023-12-310000764065us-gaap:FairValueInputsLevel3Memberus-gaap:PensionPlansDefinedBenefitMemberus-gaap:PrivateEquityFundsMember2024-12-310000764065us-gaap:FairValueInputsLevel3Memberus-gaap:PensionPlansDefinedBenefitMemberus-gaap:PrivateEquityFundsMember2023-12-310000764065us-gaap:FairValueMeasuredAtNetAssetValuePerShareMemberus-gaap:PensionPlansDefinedBenefitMemberus-gaap:PrivateEquityFundsMember2024-12-310000764065us-gaap:FairValueMeasuredAtNetAssetValuePerShareMemberus-gaap:PensionPlansDefinedBenefitMemberus-gaap:PrivateEquityFundsMember2023-12-310000764065us-gaap:FairValueInputsLevel1Memberus-gaap:PensionPlansDefinedBenefitMemberclf:StructuredCreditMember2024-12-310000764065us-gaap:FairValueInputsLevel1Memberus-gaap:PensionPlansDefinedBenefitMemberclf:StructuredCreditMember2023-12-310000764065us-gaap:FairValueInputsLevel2Memberus-gaap:PensionPlansDefinedBenefitMemberclf:StructuredCreditMember2024-12-310000764065us-gaap:FairValueInputsLevel2Memberus-gaap:PensionPlansDefinedBenefitMemberclf:StructuredCreditMember2023-12-310000764065us-gaap:FairValueInputsLevel3Memberus-gaap:PensionPlansDefinedBenefitMemberclf:StructuredCreditMember2024-12-310000764065us-gaap:FairValueInputsLevel3Memberus-gaap:PensionPlansDefinedBenefitMemberclf:StructuredCreditMember2023-12-310000764065us-gaap:FairValueMeasuredAtNetAssetValuePerShareMemberus-gaap:PensionPlansDefinedBenefitMemberclf:StructuredCreditMember2024-12-310000764065us-gaap:FairValueMeasuredAtNetAssetValuePerShareMemberus-gaap:PensionPlansDefinedBenefitMemberclf:StructuredCreditMember2023-12-310000764065us-gaap:PensionPlansDefinedBenefitMemberclf:StructuredCreditMember2024-12-310000764065us-gaap:PensionPlansDefinedBenefitMemberclf:StructuredCreditMember2023-12-310000764065us-gaap:FairValueInputsLevel1Memberus-gaap:PensionPlansDefinedBenefitMemberus-gaap:RealEstateMember2024-12-310000764065us-gaap:FairValueInputsLevel1Memberus-gaap:PensionPlansDefinedBenefitMemberus-gaap:RealEstateMember2023-12-310000764065us-gaap:FairValueInputsLevel2Memberus-gaap:PensionPlansDefinedBenefitMemberus-gaap:RealEstateMember2024-12-310000764065us-gaap:FairValueInputsLevel2Memberus-gaap:PensionPlansDefinedBenefitMemberus-gaap:RealEstateMember2023-12-310000764065us-gaap:FairValueInputsLevel3Memberus-gaap:PensionPlansDefinedBenefitMemberus-gaap:RealEstateMember2024-12-310000764065us-gaap:FairValueInputsLevel3Memberus-gaap:PensionPlansDefinedBenefitMemberus-gaap:RealEstateMember2023-12-310000764065us-gaap:FairValueMeasuredAtNetAssetValuePerShareMemberus-gaap:PensionPlansDefinedBenefitMemberus-gaap:RealEstateMember2024-12-310000764065us-gaap:FairValueMeasuredAtNetAssetValuePerShareMemberus-gaap:PensionPlansDefinedBenefitMemberus-gaap:RealEstateMember2023-12-310000764065us-gaap:FairValueInputsLevel1Memberus-gaap:PensionPlansDefinedBenefitMember2024-12-310000764065us-gaap:FairValueInputsLevel1Memberus-gaap:PensionPlansDefinedBenefitMember2023-12-310000764065us-gaap:FairValueInputsLevel2Memberus-gaap:PensionPlansDefinedBenefitMember2024-12-310000764065us-gaap:FairValueInputsLevel2Memberus-gaap:PensionPlansDefinedBenefitMember2023-12-310000764065us-gaap:FairValueInputsLevel3Memberus-gaap:PensionPlansDefinedBenefitMember2024-12-310000764065us-gaap:FairValueInputsLevel3Memberus-gaap:PensionPlansDefinedBenefitMember2023-12-310000764065us-gaap:FairValueMeasuredAtNetAssetValuePerShareMemberus-gaap:PensionPlansDefinedBenefitMember2024-12-310000764065us-gaap:FairValueMeasuredAtNetAssetValuePerShareMemberus-gaap:PensionPlansDefinedBenefitMember2023-12-310000764065us-gaap:FairValueInputsLevel1Memberus-gaap:OtherPostretirementBenefitPlansDefinedBenefitMemberus-gaap:DefinedBenefitPlanEquitySecuritiesUsMember2024-12-310000764065us-gaap:FairValueInputsLevel1Memberus-gaap:OtherPostretirementBenefitPlansDefinedBenefitMemberus-gaap:DefinedBenefitPlanEquitySecuritiesUsMember2023-12-310000764065us-gaap:FairValueInputsLevel2Memberus-gaap:OtherPostretirementBenefitPlansDefinedBenefitMemberus-gaap:DefinedBenefitPlanEquitySecuritiesUsMember2024-12-310000764065us-gaap:FairValueInputsLevel2Memberus-gaap:OtherPostretirementBenefitPlansDefinedBenefitMemberus-gaap:DefinedBenefitPlanEquitySecuritiesUsMember2023-12-310000764065us-gaap:FairValueInputsLevel3Memberus-gaap:OtherPostretirementBenefitPlansDefinedBenefitMemberus-gaap:DefinedBenefitPlanEquitySecuritiesUsMember2024-12-310000764065us-gaap:FairValueInputsLevel3Memberus-gaap:OtherPostretirementBenefitPlansDefinedBenefitMemberus-gaap:DefinedBenefitPlanEquitySecuritiesUsMember2023-12-310000764065us-gaap:FairValueMeasuredAtNetAssetValuePerShareMemberus-gaap:OtherPostretirementBenefitPlansDefinedBenefitMemberus-gaap:DefinedBenefitPlanEquitySecuritiesUsMember2024-12-310000764065us-gaap:FairValueMeasuredAtNetAssetValuePerShareMemberus-gaap:OtherPostretirementBenefitPlansDefinedBenefitMemberus-gaap:DefinedBenefitPlanEquitySecuritiesUsMember2023-12-310000764065us-gaap:OtherPostretirementBenefitPlansDefinedBenefitMemberus-gaap:DefinedBenefitPlanEquitySecuritiesUsMember2024-12-310000764065us-gaap:OtherPostretirementBenefitPlansDefinedBenefitMemberus-gaap:DefinedBenefitPlanEquitySecuritiesUsMember2023-12-310000764065us-gaap:FairValueInputsLevel1Memberus-gaap:OtherPostretirementBenefitPlansDefinedBenefitMemberus-gaap:DefinedBenefitPlanEquitySecuritiesNonUsMember2024-12-310000764065us-gaap:FairValueInputsLevel1Memberus-gaap:OtherPostretirementBenefitPlansDefinedBenefitMemberus-gaap:DefinedBenefitPlanEquitySecuritiesNonUsMember2023-12-310000764065us-gaap:FairValueInputsLevel2Memberus-gaap:OtherPostretirementBenefitPlansDefinedBenefitMemberus-gaap:DefinedBenefitPlanEquitySecuritiesNonUsMember2024-12-310000764065us-gaap:FairValueInputsLevel2Memberus-gaap:OtherPostretirementBenefitPlansDefinedBenefitMemberus-gaap:DefinedBenefitPlanEquitySecuritiesNonUsMember2023-12-310000764065us-gaap:FairValueInputsLevel3Memberus-gaap:OtherPostretirementBenefitPlansDefinedBenefitMemberus-gaap:DefinedBenefitPlanEquitySecuritiesNonUsMember2024-12-310000764065us-gaap:FairValueInputsLevel3Memberus-gaap:OtherPostretirementBenefitPlansDefinedBenefitMemberus-gaap:DefinedBenefitPlanEquitySecuritiesNonUsMember2023-12-310000764065us-gaap:FairValueMeasuredAtNetAssetValuePerShareMemberus-gaap:OtherPostretirementBenefitPlansDefinedBenefitMemberus-gaap:DefinedBenefitPlanEquitySecuritiesNonUsMember2024-12-310000764065us-gaap:FairValueMeasuredAtNetAssetValuePerShareMemberus-gaap:OtherPostretirementBenefitPlansDefinedBenefitMemberus-gaap:DefinedBenefitPlanEquitySecuritiesNonUsMember2023-12-310000764065us-gaap:OtherPostretirementBenefitPlansDefinedBenefitMemberus-gaap:DefinedBenefitPlanEquitySecuritiesNonUsMember2024-12-310000764065us-gaap:OtherPostretirementBenefitPlansDefinedBenefitMemberus-gaap:DefinedBenefitPlanEquitySecuritiesNonUsMember2023-12-310000764065us-gaap:FairValueInputsLevel1Memberus-gaap:OtherPostretirementBenefitPlansDefinedBenefitMemberus-gaap:USGovernmentAgenciesDebtSecuritiesMember2024-12-310000764065us-gaap:FairValueInputsLevel1Memberus-gaap:OtherPostretirementBenefitPlansDefinedBenefitMemberus-gaap:USGovernmentAgenciesDebtSecuritiesMember2023-12-310000764065us-gaap:FairValueInputsLevel2Memberus-gaap:OtherPostretirementBenefitPlansDefinedBenefitMemberus-gaap:USGovernmentAgenciesDebtSecuritiesMember2024-12-310000764065us-gaap:FairValueInputsLevel2Memberus-gaap:OtherPostretirementBenefitPlansDefinedBenefitMemberus-gaap:USGovernmentAgenciesDebtSecuritiesMember2023-12-310000764065us-gaap:FairValueInputsLevel3Memberus-gaap:OtherPostretirementBenefitPlansDefinedBenefitMemberus-gaap:USGovernmentAgenciesDebtSecuritiesMember2024-12-310000764065us-gaap:FairValueInputsLevel3Memberus-gaap:OtherPostretirementBenefitPlansDefinedBenefitMemberus-gaap:USGovernmentAgenciesDebtSecuritiesMember2023-12-310000764065us-gaap:FairValueMeasuredAtNetAssetValuePerShareMemberus-gaap:OtherPostretirementBenefitPlansDefinedBenefitMemberus-gaap:USGovernmentAgenciesDebtSecuritiesMember2024-12-310000764065us-gaap:FairValueMeasuredAtNetAssetValuePerShareMemberus-gaap:OtherPostretirementBenefitPlansDefinedBenefitMemberus-gaap:USGovernmentAgenciesDebtSecuritiesMember2023-12-310000764065us-gaap:OtherPostretirementBenefitPlansDefinedBenefitMemberus-gaap:USGovernmentAgenciesDebtSecuritiesMember2024-12-310000764065us-gaap:OtherPostretirementBenefitPlansDefinedBenefitMemberus-gaap:USGovernmentAgenciesDebtSecuritiesMember2023-12-310000764065us-gaap:FairValueInputsLevel1Memberus-gaap:OtherPostretirementBenefitPlansDefinedBenefitMemberus-gaap:DomesticCorporateDebtSecuritiesMember2024-12-310000764065us-gaap:FairValueInputsLevel1Memberus-gaap:OtherPostretirementBenefitPlansDefinedBenefitMemberus-gaap:DomesticCorporateDebtSecuritiesMember2023-12-310000764065us-gaap:FairValueInputsLevel2Memberus-gaap:OtherPostretirementBenefitPlansDefinedBenefitMemberus-gaap:DomesticCorporateDebtSecuritiesMember2024-12-310000764065us-gaap:FairValueInputsLevel2Memberus-gaap:OtherPostretirementBenefitPlansDefinedBenefitMemberus-gaap:DomesticCorporateDebtSecuritiesMember2023-12-310000764065us-gaap:FairValueInputsLevel3Memberus-gaap:OtherPostretirementBenefitPlansDefinedBenefitMemberus-gaap:DomesticCorporateDebtSecuritiesMember2024-12-310000764065us-gaap:FairValueInputsLevel3Memberus-gaap:OtherPostretirementBenefitPlansDefinedBenefitMemberus-gaap:DomesticCorporateDebtSecuritiesMember2023-12-310000764065us-gaap:FairValueMeasuredAtNetAssetValuePerShareMemberus-gaap:OtherPostretirementBenefitPlansDefinedBenefitMemberus-gaap:DomesticCorporateDebtSecuritiesMember2024-12-310000764065us-gaap:FairValueMeasuredAtNetAssetValuePerShareMemberus-gaap:OtherPostretirementBenefitPlansDefinedBenefitMemberus-gaap:DomesticCorporateDebtSecuritiesMember2023-12-310000764065us-gaap:OtherPostretirementBenefitPlansDefinedBenefitMemberus-gaap:DomesticCorporateDebtSecuritiesMember2024-12-310000764065us-gaap:OtherPostretirementBenefitPlansDefinedBenefitMemberus-gaap:DomesticCorporateDebtSecuritiesMember2023-12-310000764065us-gaap:FairValueInputsLevel1Memberus-gaap:OtherPostretirementBenefitPlansDefinedBenefitMemberus-gaap:ForeignCorporateDebtSecuritiesMember2024-12-310000764065us-gaap:FairValueInputsLevel1Memberus-gaap:OtherPostretirementBenefitPlansDefinedBenefitMemberus-gaap:ForeignCorporateDebtSecuritiesMember2023-12-310000764065us-gaap:FairValueInputsLevel2Memberus-gaap:OtherPostretirementBenefitPlansDefinedBenefitMemberus-gaap:ForeignCorporateDebtSecuritiesMember2024-12-310000764065us-gaap:FairValueInputsLevel2Memberus-gaap:OtherPostretirementBenefitPlansDefinedBenefitMemberus-gaap:ForeignCorporateDebtSecuritiesMember2023-12-310000764065us-gaap:FairValueInputsLevel3Memberus-gaap:OtherPostretirementBenefitPlansDefinedBenefitMemberus-gaap:ForeignCorporateDebtSecuritiesMember2024-12-310000764065us-gaap:FairValueInputsLevel3Memberus-gaap:OtherPostretirementBenefitPlansDefinedBenefitMemberus-gaap:ForeignCorporateDebtSecuritiesMember2023-12-310000764065us-gaap:FairValueMeasuredAtNetAssetValuePerShareMemberus-gaap:OtherPostretirementBenefitPlansDefinedBenefitMemberus-gaap:ForeignCorporateDebtSecuritiesMember2024-12-310000764065us-gaap:FairValueMeasuredAtNetAssetValuePerShareMemberus-gaap:OtherPostretirementBenefitPlansDefinedBenefitMemberus-gaap:ForeignCorporateDebtSecuritiesMember2023-12-310000764065us-gaap:OtherPostretirementBenefitPlansDefinedBenefitMemberus-gaap:ForeignCorporateDebtSecuritiesMember2024-12-310000764065us-gaap:OtherPostretirementBenefitPlansDefinedBenefitMemberus-gaap:ForeignCorporateDebtSecuritiesMember2023-12-310000764065us-gaap:FairValueInputsLevel1Memberus-gaap:OtherPostretirementBenefitPlansDefinedBenefitMemberus-gaap:HedgeFundsMember2024-12-310000764065us-gaap:FairValueInputsLevel1Memberus-gaap:OtherPostretirementBenefitPlansDefinedBenefitMemberus-gaap:HedgeFundsMember2023-12-310000764065us-gaap:FairValueInputsLevel2Memberus-gaap:OtherPostretirementBenefitPlansDefinedBenefitMemberus-gaap:HedgeFundsMember2024-12-310000764065us-gaap:FairValueInputsLevel2Memberus-gaap:OtherPostretirementBenefitPlansDefinedBenefitMemberus-gaap:HedgeFundsMember2023-12-310000764065us-gaap:FairValueInputsLevel3Memberus-gaap:OtherPostretirementBenefitPlansDefinedBenefitMemberus-gaap:HedgeFundsMember2024-12-310000764065us-gaap:FairValueInputsLevel3Memberus-gaap:OtherPostretirementBenefitPlansDefinedBenefitMemberus-gaap:HedgeFundsMember2023-12-310000764065us-gaap:FairValueMeasuredAtNetAssetValuePerShareMemberus-gaap:OtherPostretirementBenefitPlansDefinedBenefitMemberus-gaap:HedgeFundsMember2024-12-310000764065us-gaap:FairValueMeasuredAtNetAssetValuePerShareMemberus-gaap:OtherPostretirementBenefitPlansDefinedBenefitMemberus-gaap:HedgeFundsMember2023-12-310000764065us-gaap:FairValueInputsLevel1Memberus-gaap:OtherPostretirementBenefitPlansDefinedBenefitMemberclf:StructuredCreditMember2024-12-310000764065us-gaap:FairValueInputsLevel1Memberus-gaap:OtherPostretirementBenefitPlansDefinedBenefitMemberclf:StructuredCreditMember2023-12-310000764065us-gaap:FairValueInputsLevel2Memberus-gaap:OtherPostretirementBenefitPlansDefinedBenefitMemberclf:StructuredCreditMember2024-12-310000764065us-gaap:FairValueInputsLevel2Memberus-gaap:OtherPostretirementBenefitPlansDefinedBenefitMemberclf:StructuredCreditMember2023-12-310000764065us-gaap:FairValueInputsLevel3Memberus-gaap:OtherPostretirementBenefitPlansDefinedBenefitMemberclf:StructuredCreditMember2024-12-310000764065us-gaap:FairValueInputsLevel3Memberus-gaap:OtherPostretirementBenefitPlansDefinedBenefitMemberclf:StructuredCreditMember2023-12-310000764065us-gaap:FairValueMeasuredAtNetAssetValuePerShareMemberus-gaap:OtherPostretirementBenefitPlansDefinedBenefitMemberclf:StructuredCreditMember2024-12-310000764065us-gaap:FairValueMeasuredAtNetAssetValuePerShareMemberus-gaap:OtherPostretirementBenefitPlansDefinedBenefitMemberclf:StructuredCreditMember2023-12-310000764065us-gaap:OtherPostretirementBenefitPlansDefinedBenefitMemberclf:StructuredCreditMember2024-12-310000764065us-gaap:OtherPostretirementBenefitPlansDefinedBenefitMemberclf:StructuredCreditMember2023-12-310000764065us-gaap:FairValueInputsLevel1Memberus-gaap:OtherPostretirementBenefitPlansDefinedBenefitMemberus-gaap:RealEstateMember2024-12-310000764065us-gaap:FairValueInputsLevel1Memberus-gaap:OtherPostretirementBenefitPlansDefinedBenefitMemberus-gaap:RealEstateMember2023-12-310000764065us-gaap:FairValueInputsLevel2Memberus-gaap:OtherPostretirementBenefitPlansDefinedBenefitMemberus-gaap:RealEstateMember2024-12-310000764065us-gaap:FairValueInputsLevel2Memberus-gaap:OtherPostretirementBenefitPlansDefinedBenefitMemberus-gaap:RealEstateMember2023-12-310000764065us-gaap:FairValueInputsLevel3Memberus-gaap:OtherPostretirementBenefitPlansDefinedBenefitMemberus-gaap:RealEstateMember2024-12-310000764065us-gaap:FairValueInputsLevel3Memberus-gaap:OtherPostretirementBenefitPlansDefinedBenefitMemberus-gaap:RealEstateMember2023-12-310000764065us-gaap:FairValueMeasuredAtNetAssetValuePerShareMemberus-gaap:OtherPostretirementBenefitPlansDefinedBenefitMemberus-gaap:RealEstateMember2024-12-310000764065us-gaap:FairValueMeasuredAtNetAssetValuePerShareMemberus-gaap:OtherPostretirementBenefitPlansDefinedBenefitMemberus-gaap:RealEstateMember2023-12-310000764065us-gaap:FairValueInputsLevel1Memberus-gaap:OtherPostretirementBenefitPlansDefinedBenefitMember2024-12-310000764065us-gaap:FairValueInputsLevel1Memberus-gaap:OtherPostretirementBenefitPlansDefinedBenefitMember2023-12-310000764065us-gaap:FairValueInputsLevel2Memberus-gaap:OtherPostretirementBenefitPlansDefinedBenefitMember2024-12-310000764065us-gaap:FairValueInputsLevel2Memberus-gaap:OtherPostretirementBenefitPlansDefinedBenefitMember2023-12-310000764065us-gaap:FairValueInputsLevel3Memberus-gaap:OtherPostretirementBenefitPlansDefinedBenefitMember2024-12-310000764065us-gaap:FairValueInputsLevel3Memberus-gaap:OtherPostretirementBenefitPlansDefinedBenefitMember2023-12-310000764065us-gaap:FairValueMeasuredAtNetAssetValuePerShareMemberus-gaap:OtherPostretirementBenefitPlansDefinedBenefitMember2024-12-310000764065us-gaap:FairValueMeasuredAtNetAssetValuePerShareMemberus-gaap:OtherPostretirementBenefitPlansDefinedBenefitMember2023-12-310000764065us-gaap:FairValueInputsLevel3Memberus-gaap:PensionPlansDefinedBenefitMember2022-12-310000764065us-gaap:FairValueInputsLevel3Memberus-gaap:OtherPostretirementBenefitPlansDefinedBenefitMemberus-gaap:TrustForBenefitOfEmployeesMember2023-12-310000764065us-gaap:FairValueInputsLevel3Memberus-gaap:OtherPostretirementBenefitPlansDefinedBenefitMemberus-gaap:TrustForBenefitOfEmployeesMember2022-12-310000764065us-gaap:FairValueInputsLevel3Memberus-gaap:PensionPlansDefinedBenefitMember2024-01-012024-12-310000764065us-gaap:FairValueInputsLevel3Memberus-gaap:PensionPlansDefinedBenefitMember2023-01-012023-12-310000764065us-gaap:FairValueInputsLevel3Memberus-gaap:OtherPostretirementBenefitPlansDefinedBenefitMemberus-gaap:TrustForBenefitOfEmployeesMember2024-01-012024-12-310000764065us-gaap:FairValueInputsLevel3Memberus-gaap:OtherPostretirementBenefitPlansDefinedBenefitMemberus-gaap:TrustForBenefitOfEmployeesMember2023-01-012023-12-310000764065us-gaap:FairValueInputsLevel3Memberus-gaap:OtherPostretirementBenefitPlansDefinedBenefitMemberus-gaap:TrustForBenefitOfEmployeesMember2024-12-310000764065clf:SteelworkersPensionTrustMember2024-01-012024-12-310000764065clf:SteelworkersPensionTrustMember2023-01-012023-12-310000764065clf:SteelworkersPensionTrustMember2022-01-012022-12-310000764065clf:IAMNationalPensionFundsNationalPensionPlanMember2024-01-012024-12-310000764065clf:IAMNationalPensionFundsNationalPensionPlanMember2023-01-012023-12-310000764065clf:IAMNationalPensionFundsNationalPensionPlanMember2022-01-012022-12-310000764065us-gaap:RetirementPlanNameOtherMember2024-01-012024-12-310000764065us-gaap:RetirementPlanNameOtherMember2023-01-012023-12-310000764065us-gaap:RetirementPlanNameOtherMember2022-01-012022-12-310000764065clf:SteelworkersPensionTrustMember2023-12-310000764065clf:A2021EquityPlanMember2024-12-310000764065us-gaap:CostOfSalesMember2024-01-012024-12-310000764065us-gaap:CostOfSalesMember2023-01-012023-12-310000764065us-gaap:CostOfSalesMember2022-01-012022-12-310000764065us-gaap:SellingGeneralAndAdministrativeExpensesMember2024-01-012024-12-310000764065us-gaap:SellingGeneralAndAdministrativeExpensesMember2023-01-012023-12-310000764065us-gaap:SellingGeneralAndAdministrativeExpensesMember2022-01-012022-12-310000764065us-gaap:StockCompensationPlanMember2024-01-012024-12-310000764065us-gaap:StockCompensationPlanMember2023-01-012023-12-310000764065us-gaap:StockCompensationPlanMember2022-01-012022-12-310000764065us-gaap:PerformanceSharesMember2023-12-310000764065us-gaap:PerformanceSharesMember2022-12-310000764065us-gaap:PerformanceSharesMember2021-12-310000764065us-gaap:PerformanceSharesMember2024-01-012024-12-310000764065us-gaap:PerformanceSharesMember2023-01-012023-12-310000764065us-gaap:PerformanceSharesMember2022-01-012022-12-310000764065us-gaap:PerformanceSharesMember2024-12-310000764065us-gaap:PerformanceSharesMembersrt:MinimumMember2024-01-012024-12-310000764065us-gaap:PerformanceSharesMembersrt:MaximumMember2024-01-012024-12-310000764065us-gaap:RestrictedStockUnitsRSUMember2023-12-310000764065us-gaap:RestrictedStockUnitsRSUMember2022-12-310000764065us-gaap:RestrictedStockUnitsRSUMember2021-12-310000764065us-gaap:RestrictedStockUnitsRSUMember2024-01-012024-12-310000764065us-gaap:RestrictedStockUnitsRSUMember2023-01-012023-12-310000764065us-gaap:RestrictedStockUnitsRSUMember2022-01-012022-12-310000764065us-gaap:RestrictedStockUnitsRSUMember2024-12-310000764065us-gaap:EmployeeStockOptionMembersrt:MinimumMember2024-01-012024-12-310000764065us-gaap:EmployeeStockOptionMembersrt:MaximumMember2024-01-012024-12-310000764065us-gaap:ShareBasedPaymentArrangementNonemployeeMemberclf:DirectorsPlanMemberus-gaap:RestrictedStockUnitsRSUMembersrt:DirectorMember2022-12-310000764065clf:IncludedinincometaxexpensebenefitMember2024-01-012024-12-310000764065clf:IncludedinincometaxexpensebenefitMember2023-01-012023-12-310000764065clf:IncludedinincometaxexpensebenefitMember2022-01-012022-12-310000764065us-gaap:ForeignCountryMember2024-12-310000764065us-gaap:ForeignCountryMember2023-12-310000764065us-gaap:StateAndLocalJurisdictionMember2024-12-310000764065us-gaap:StateAndLocalJurisdictionMember2023-12-310000764065us-gaap:ForeignCountryMember2023-01-012023-12-310000764065us-gaap:OtherNoncurrentLiabilitiesMember2024-12-310000764065us-gaap:OtherNoncurrentLiabilitiesMember2023-12-310000764065us-gaap:OtherLiabilitiesMember2024-12-310000764065us-gaap:OperatingSegmentsMember2024-12-310000764065us-gaap:OperatingSegmentsMember2023-12-310000764065us-gaap:FairValueInputsLevel1Memberus-gaap:CarryingReportedAmountFairValueDisclosureMemberus-gaap:SeniorNotesMember2024-12-310000764065us-gaap:FairValueInputsLevel1Memberus-gaap:EstimateOfFairValueFairValueDisclosureMemberus-gaap:SeniorNotesMember2024-12-310000764065us-gaap:FairValueInputsLevel1Memberus-gaap:CarryingReportedAmountFairValueDisclosureMemberus-gaap:SeniorNotesMember2023-12-310000764065us-gaap:FairValueInputsLevel1Memberus-gaap:EstimateOfFairValueFairValueDisclosureMemberus-gaap:SeniorNotesMember2023-12-310000764065us-gaap:FairValueInputsLevel2Memberus-gaap:RevolvingCreditFacilityMemberus-gaap:CarryingReportedAmountFairValueDisclosureMemberus-gaap:LineOfCreditMember2024-12-310000764065us-gaap:FairValueInputsLevel2Memberus-gaap:RevolvingCreditFacilityMemberus-gaap:EstimateOfFairValueFairValueDisclosureMemberus-gaap:LineOfCreditMember2024-12-310000764065us-gaap:FairValueInputsLevel2Memberus-gaap:RevolvingCreditFacilityMemberus-gaap:CarryingReportedAmountFairValueDisclosureMemberus-gaap:LineOfCreditMember2023-12-310000764065us-gaap:FairValueInputsLevel2Memberus-gaap:RevolvingCreditFacilityMemberus-gaap:EstimateOfFairValueFairValueDisclosureMemberus-gaap:LineOfCreditMember2023-12-310000764065us-gaap:CarryingReportedAmountFairValueDisclosureMember2024-12-310000764065us-gaap:EstimateOfFairValueFairValueDisclosureMember2024-12-310000764065us-gaap:CarryingReportedAmountFairValueDisclosureMember2023-12-310000764065us-gaap:EstimateOfFairValueFairValueDisclosureMember2023-12-310000764065us-gaap:CommitmentsMember2023-12-310000764065us-gaap:CommitmentsMember2024-01-012024-12-310000764065us-gaap:CommitmentsMember2024-12-310000764065us-gaap:CommodityOptionMember2024-12-310000764065us-gaap:CommodityOptionMember2023-12-310000764065us-gaap:CommodityOptionMember2024-01-012024-12-310000764065srt:NaturalGasPerThousandCubicFeetMemberus-gaap:CommodityContractMember2024-12-310000764065srt:NaturalGasPerThousandCubicFeetMemberus-gaap:CommodityContractMember2023-12-310000764065us-gaap:ElectricityMemberus-gaap:CommodityContractMember2024-12-310000764065us-gaap:ElectricityMemberus-gaap:CommodityContractMember2023-12-310000764065us-gaap:OtherCurrentAssetsMember2024-12-310000764065us-gaap:OtherCurrentAssetsMember2023-12-310000764065us-gaap:NondesignatedMember2024-01-012024-12-3100007640652022-02-1000007640652024-04-220000764065us-gaap:SeriesAPreferredStockMember2024-12-310000764065us-gaap:SeriesBPreferredStockMember2024-12-310000764065us-gaap:AccumulatedForeignCurrencyAdjustmentIncludingPortionAttributableToNoncontrollingInterestMember2023-12-310000764065us-gaap:AccumulatedForeignCurrencyAdjustmentIncludingPortionAttributableToNoncontrollingInterestMember2022-12-310000764065us-gaap:AccumulatedForeignCurrencyAdjustmentIncludingPortionAttributableToNoncontrollingInterestMember2021-12-310000764065us-gaap:AccumulatedForeignCurrencyAdjustmentIncludingPortionAttributableToNoncontrollingInterestMember2024-01-012024-12-310000764065us-gaap:AccumulatedForeignCurrencyAdjustmentIncludingPortionAttributableToNoncontrollingInterestMember2023-01-012023-12-310000764065us-gaap:AccumulatedForeignCurrencyAdjustmentIncludingPortionAttributableToNoncontrollingInterestMember2022-01-012022-12-310000764065us-gaap:AccumulatedForeignCurrencyAdjustmentIncludingPortionAttributableToNoncontrollingInterestMember2024-12-310000764065us-gaap:AccumulatedGainLossCashFlowHedgeIncludingNoncontrollingInterestMember2023-12-310000764065us-gaap:AccumulatedGainLossCashFlowHedgeIncludingNoncontrollingInterestMember2022-12-310000764065us-gaap:AccumulatedGainLossCashFlowHedgeIncludingNoncontrollingInterestMember2021-12-310000764065us-gaap:AccumulatedGainLossCashFlowHedgeIncludingNoncontrollingInterestMember2024-01-012024-12-310000764065us-gaap:AccumulatedGainLossCashFlowHedgeIncludingNoncontrollingInterestMember2023-01-012023-12-310000764065us-gaap:AccumulatedGainLossCashFlowHedgeIncludingNoncontrollingInterestMember2022-01-012022-12-310000764065us-gaap:AccumulatedGainLossCashFlowHedgeIncludingNoncontrollingInterestMember2024-12-310000764065us-gaap:AccumulatedDefinedBenefitPlansAdjustmentIncludingPortionAttributableToNoncontrollingInterestMember2023-12-310000764065us-gaap:AccumulatedDefinedBenefitPlansAdjustmentIncludingPortionAttributableToNoncontrollingInterestMember2022-12-310000764065us-gaap:AccumulatedDefinedBenefitPlansAdjustmentIncludingPortionAttributableToNoncontrollingInterestMember2021-12-310000764065us-gaap:AccumulatedDefinedBenefitPlansAdjustmentIncludingPortionAttributableToNoncontrollingInterestMember2024-01-012024-12-310000764065us-gaap:AccumulatedDefinedBenefitPlansAdjustmentIncludingPortionAttributableToNoncontrollingInterestMember2023-01-012023-12-310000764065us-gaap:AccumulatedDefinedBenefitPlansAdjustmentIncludingPortionAttributableToNoncontrollingInterestMember2022-01-012022-12-310000764065us-gaap:AccumulatedDefinedBenefitPlansAdjustmentIncludingPortionAttributableToNoncontrollingInterestMember2024-12-310000764065clf:SunCokeMiddletownMemberus-gaap:VariableInterestEntityPrimaryBeneficiaryMember2023-01-012023-12-310000764065clf:SunCokeMiddletownMemberus-gaap:VariableInterestEntityPrimaryBeneficiaryMember2024-01-012024-12-310000764065clf:SunCokeMiddletownMemberus-gaap:VariableInterestEntityPrimaryBeneficiaryMember2024-12-310000764065clf:SunCokeMiddletownMemberus-gaap:VariableInterestEntityPrimaryBeneficiaryMember2023-12-310000764065us-gaap:StockCompensationPlanMember2024-01-012024-12-310000764065us-gaap:StockCompensationPlanMember2023-01-012023-12-310000764065us-gaap:StockCompensationPlanMember2022-01-012022-12-310000764065us-gaap:SuretyBondMember2024-12-310000764065clf:SeniorNotesDue2031Memberus-gaap:SeniorNotesMemberus-gaap:SubsequentEventMember2025-02-0600007640652024-10-012024-12-31
UNITED STATES
SECURITIES AND EXCHANGE COMMISSION
Washington, D.C. 20549
FORM 10-K
| | | | | | | | | | | |
| ☒ | ANNUAL REPORT PURSUANT TO SECTION 13 OR 15(d) OF THE SECURITIES EXCHANGE ACT OF 1934 | |
For the fiscal year ended December 31, 2024
OR
| | | | | | | | | | | |
| ☐ | TRANSITION REPORT PURSUANT TO SECTION 13 OR 15(d) OF THE SECURITIES EXCHANGE ACT OF 1934 | |
For the transition period from to
Commission File Number: 1-8944
CLEVELAND-CLIFFS INC.
(Exact name of registrant as specified in its charter)
| | | | | | | | | | | | | | | | | | | | |
| Ohio | | 34-1464672 | |
| (State or Other Jurisdiction of
Incorporation or Organization) | | (I.R.S. Employer
Identification No.) | |
| | | | | | |
| 200 Public Square, | Cleveland, | Ohio | | 44114-2315 | |
| (Address of Principal Executive Offices) | | (Zip Code) | |
Registrant’s telephone number, including area code: (216) 694-5700
Securities registered pursuant to Section 12(b) of the Act:
| | | | | | | | | | | | | | |
| Title of each class | | Trading Symbol(s) | | Name of each exchange on which registered |
| Common Shares, par value $0.125 per share | | CLF | | New York Stock Exchange |
Securities registered pursuant to section 12(g) of the Act: NONE
Indicate by check mark if the registrant is a well-known seasoned issuer, as defined in Rule 405 of the Securities Act. Yes ☒ No ☐
Indicate by check mark if the registrant is not required to file reports pursuant to Section 13 or Section 15(d) of the Act. Yes ☐ No ☒
Indicate by check mark whether the registrant (1) has filed all reports required to be filed by Section 13 or 15(d) of the Securities Exchange Act of 1934 during the preceding 12 months (or for such shorter period that the registrant was required to file such reports), and (2) has been subject to such filing requirements for the past 90 days. Yes ☒ No ☐
Indicate by check mark whether the registrant has submitted electronically every Interactive Data File required to be submitted pursuant to Rule 405 of Regulation S-T (§232.405 of this chapter) during the preceding 12 months (or for such shorter period that the registrant was required to submit such files). Yes ☒ No ☐
Indicate by check mark whether the registrant is a large accelerated filer, an accelerated filer, a non-accelerated filer, a smaller reporting company, or an emerging growth company. See the definitions of “large accelerated filer,” “accelerated filer,” “smaller reporting company,” and "emerging growth company" in Rule 12b-2 of the Exchange Act.
| | | | | | | | | | | |
| Large accelerated filer | ☒ | Accelerated filer | ☐ |
| Non-accelerated filer | ☐ | Smaller reporting company | ☐ |
| | Emerging growth company | ☐ |
If an emerging growth company, indicate by check mark if the registrant has elected not to use the extended transition period for complying with any new or revised financial accounting standards provided pursuant to Section 13(a) of the Exchange Act. ☐
Indicate by check mark whether the registrant has filed a report on and attestation to its management’s assessment of the effectiveness of its internal control over financial reporting under Section 404(b) of the Sarbanes-Oxley Act (15 U.S.C. 7262(b)) by the registered public accounting firm that prepared or issued its audit report. ☒
If securities are registered pursuant to Section 12(b) of the Act, indicate by check mark whether the financial statements of the registrant included in the filing reflect the correction of an error to previously issued financial statements. ☐
Indicate by check mark whether any of those error corrections are restatements that required a recovery analysis of incentive-based compensation received by any of the registrant's executive officers during the relevant recovery period pursuant to §240.10D-1(b). ☐
Indicate by check mark whether the registrant is a shell company (as defined in Rule 12b-2 of the Act). Yes ☐ No ☒
As of June 28, 2024, the aggregate market value of the voting and non-voting common shares held by non-affiliates of the registrant, based on the closing price of $15.39 per share as reported on the New York Stock Exchange — Composite Index, was $7,077,318,531 (excluded from this figure are the voting shares beneficially owned by the registrant’s directors and executive officers).
The number of shares outstanding of the registrant’s common shares, par value $0.125 per share, was 494,481,275 as of February 25, 2025.
DOCUMENTS INCORPORATED BY REFERENCE
Portions of the registrant’s proxy statement for its 2025 annual meeting of shareholders are incorporated by reference into Part III.
TABLE OF CONTENTS
| | | | | | | | | | | | | | | | | |
| | | | | |
| | | Page Number |
| | | | | |
| DEFINITIONS | | | |
| | | |
| PART I | | | |
| ITEM 1. | BUSINESS | | | |
| | Information About Our Executive Officers | | | |
| ITEM 1A. | RISK FACTORS | | | |
| ITEM 1B. | UNRESOLVED STAFF COMMENTS | | | |
| ITEM 1C. | CYBERSECURITY | | | |
| ITEM 2. | PROPERTIES | | | |
| ITEM 3. | LEGAL PROCEEDINGS | | | |
| ITEM 4. | MINE SAFETY DISCLOSURES | | | |
| | | | | |
| PART II | | | |
| ITEM 5. | MARKET FOR REGISTRANT'S COMMON EQUITY, RELATED STOCKHOLDER MATTERS AND ISSUER PURCHASES OF EQUITY SECURITIES | | | |
| ITEM 6. | [Reserved] | | | |
| ITEM 7. | MANAGEMENT'S DISCUSSION AND ANALYSIS OF FINANCIAL CONDITION AND RESULTS OF OPERATIONS | | | |
| ITEM 7A. | QUANTITATIVE AND QUALITATIVE DISCLOSURES ABOUT MARKET RISK | | | |
| ITEM 8. | FINANCIAL STATEMENTS AND SUPPLEMENTARY DATA | | | |
| ITEM 9. | CHANGES IN AND DISAGREEMENTS WITH ACCOUNTANTS ON ACCOUNTING AND FINANCIAL DISCLOSURE | | | |
| ITEM 9A. | CONTROLS AND PROCEDURES | | | |
| ITEM 9B. | OTHER INFORMATION | | | |
| ITEM 9C. | DISCLOSURE REGARDING FOREIGN JURISDICTIONS THAT PREVENT INSPECTIONS | | | |
| | | |
PART III | | | |
| ITEM 10. | DIRECTORS, EXECUTIVE OFFICERS AND CORPORATE GOVERNANCE | | | |
| ITEM 11. | EXECUTIVE COMPENSATION | | | |
| ITEM 12. | SECURITY OWNERSHIP OF CERTAIN BENEFICIAL OWNERS AND MANAGEMENT AND RELATED STOCKHOLDER MATTERS | | | |
| ITEM 13. | CERTAIN RELATIONSHIPS AND RELATED TRANSACTIONS, AND DIRECTOR INDEPENDENCE | | | |
| ITEM 14. | PRINCIPAL ACCOUNTANT FEES AND SERVICES | | | |
| | | | | |
| PART IV | | | |
| ITEM 15. | EXHIBITS AND FINANCIAL STATEMENT SCHEDULES | | | |
| ITEM 16. | FORM 10-K SUMMARY | | | |
| | | |
| SIGNATURES | | | |
DEFINITIONS
The following abbreviations or acronyms are used in the text. References in this report to the “Company,” “we,” “us,” “our,” "Cleveland-Cliffs" and “Cliffs” are to Cleveland-Cliffs Inc. and subsidiaries, collectively. References to “$” is to United States currency, unless otherwise stated.
| | | | | | | | |
| Abbreviation or acronym | | Term |
| 2021 Equity Plan | | Cleveland-Cliffs Inc. 2021 Equity and Incentive Compensation Plan |
| A&R 2015 Equity Plan | | Cliffs Natural Resources Inc. Amended and Restated 2015 Equity and Incentive Compensation Plan |
| ABL Facility | | Asset-Based Revolving Credit Agreement, dated as of March 13, 2020, among Cleveland-Cliffs Inc., the lenders party thereto from time to time and Bank of America, N.A., as administrative agent, as amended as of March 27, 2020, December 9, 2020, December 17, 2021, June 9, 2023, July 31, 2024, and September 13, 2024, and as may be further amended from time to time |
| Adjusted EBITDA | | EBITDA, excluding certain items such as EBITDA of noncontrolling interests, Weirton indefinite idle, arbitration decision, acquisition-related costs, changes in fair value of derivatives, net, loss on extinguishment of debt, amortization of inventory step-up, loss on currency exchange, loss on disposal of assets, goodwill impairment, and other, net |
| AG | | Autogenous grinding |
| AHSS | | Advanced high-strength steel |
| AK Steel | | AK Steel Holding Corporation (n/k/a Cleveland-Cliffs Steel Holding Corporation) and its consolidated subsidiaries, including AK Steel Corporation (n/k/a Cleveland-Cliffs Steel Corporation), its direct, wholly owned subsidiary, collectively, unless stated otherwise or the context indicates otherwise |
| AM USA Transaction | | The acquisition of substantially all of the operations of the former ArcelorMittal USA LLC, its subsidiaries and certain affiliates, collectively, consummated on December 9, 2020 |
| AOCI | | Accumulated other comprehensive income (loss) |
| Arrangement Agreement | | Arrangement Agreement, by and between Stelco Holdings Inc., 13421422 Canada Inc. and Cleveland-Cliffs Inc., dated July 14, 2024, in respect of the Stelco Acquisition |
| ASC | | Accounting Standards Codification |
| ASU | | Accounting Standards Update |
| Board | | The Board of Directors of Cleveland-Cliffs Inc. |
| BOF | | Basic oxygen furnace |
| CERCLA | | Comprehensive Environmental Response, Compensation and Liability Act of 1980 |
| CHIPS Act | | Creating Helpful Incentives to Produce Semiconductors and Science Act of 2022 |
| Clean Water Act | | Federal Water Pollution Control Act |
| CN | | Canadian National Railway Company |
| CODM | | Chief Operating Decision Maker |
| Compensation Committee | | Compensation and Organization Committee of the Board |
CO2e | | Carbon dioxide equivalent |
| Directors’ Plan | | Cleveland-Cliffs Inc. 2021 Nonemployee Directors’ Compensation Plan |
| Dodd-Frank Act | | Dodd-Frank Wall Street Reform and Consumer Protection Act |
| DOE | | U.S. Department of Energy |
| DR-grade | | Direct reduction-grade |
| EAF | | Electric arc furnace |
| EBITDA | | Earnings before interest, taxes, depreciation and amortization |
| Empire | | Iron ore mining property owned by Empire Iron Mining Partnership, an indirect, wholly owned subsidiary of Cliffs |
| EPA | | U.S. Environmental Protection Agency |
| EPS | | Earnings per share |
| ERISA | | Employee Retirement Income Security Act of 1974, as amended |
| EV | | Electric vehicle |
| Exchange Act | | Securities Exchange Act of 1934, as amended |
| FASB | | Financial Accounting Standards Board |
| Fe | | Iron |
| FeT | | Total iron |
| FPT | | Ferrous Processing and Trading Company, including certain related entities |
| GAAP | | Accounting principles generally accepted in the United States |
| | | | | | | | |
| Abbreviation or acronym | | Term |
| GHG | | Greenhouse gas |
| GOES | | Grain oriented electrical steel |
| HAP | | Hazardous air pollutant |
| HBI | | Hot briquetted iron |
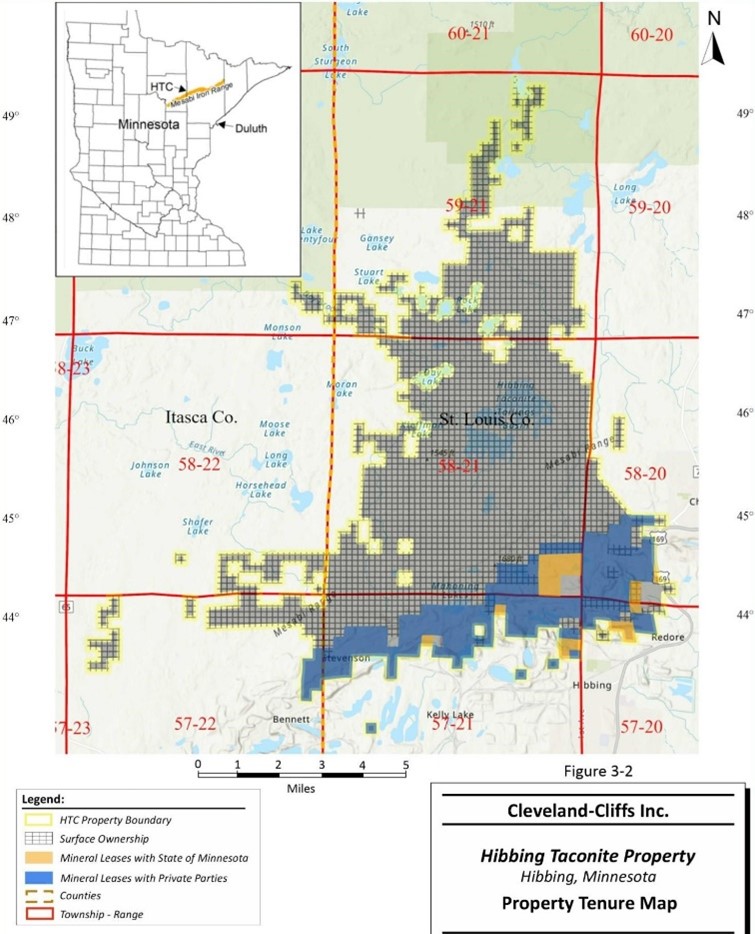
| Hibbing | | Iron ore mining property owned by Hibbing Taconite Company, an unincorporated joint venture between subsidiaries of Cliffs and U. S. Steel |
| HRC | | Hot-rolled coil steel |
| HVAC | | Heating, ventilation and air conditioning equipment |
| IAM | | International Association of Machinists and Aerospace Workers |
| Inflation Reduction Act | | Inflation Reduction Act of 2022 |
| Infrastructure and Jobs Act | | Infrastructure Investment and Jobs Act of 2021 |
| IRC | | U.S. Internal Revenue Code of 1986, as amended |
| ISO | | International Organization for Standardization |
| IT | | Information technology |
| JSW Steel | | JSW Steel (USA) Inc. and JSW Steel USA Ohio, Inc., collectively |
| LIFO | | Last-in, first-out |
| LoM | | Life-of-mine |
| Long ton (lt) | | 2,240 pounds |
| Metric ton (mt) | | 2,205 pounds |
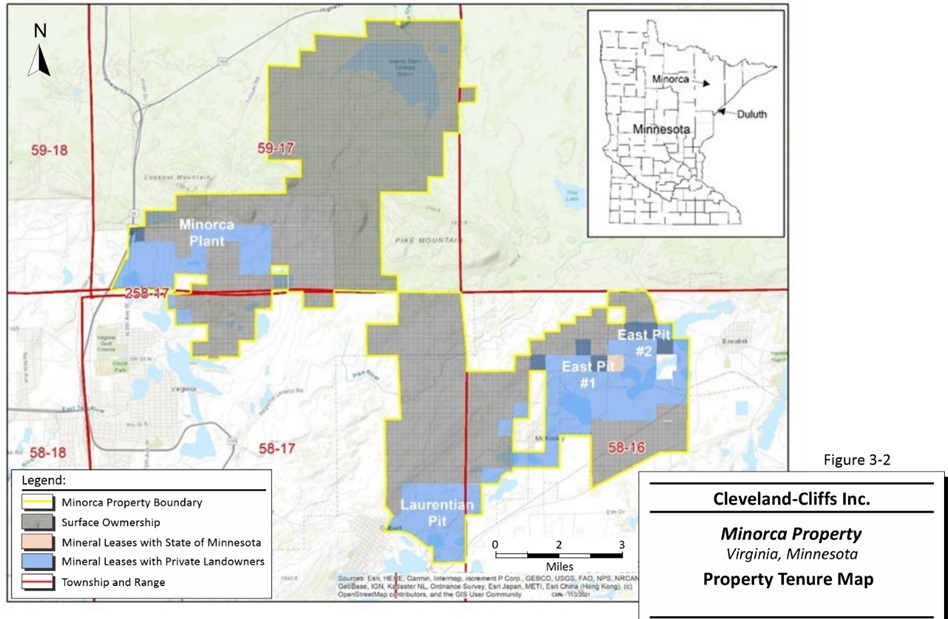
| Minorca | | Iron ore mining property owned by Cleveland-Cliffs Minorca Mine Inc., an indirect, wholly owned subsidiary of Cliffs |
| MMBtu | | Million British Thermal Units |
| MPCA | | Minnesota Pollution Control Agency |
| MSHA | | Mine Safety and Health Administration of the U.S. Department of Labor |
| NAV | | Net asset value |
| Net ton (nt) | | 2,000 pounds |
| NOL | | Net operating loss |
| NOES | | Non-oriented electrical steel |
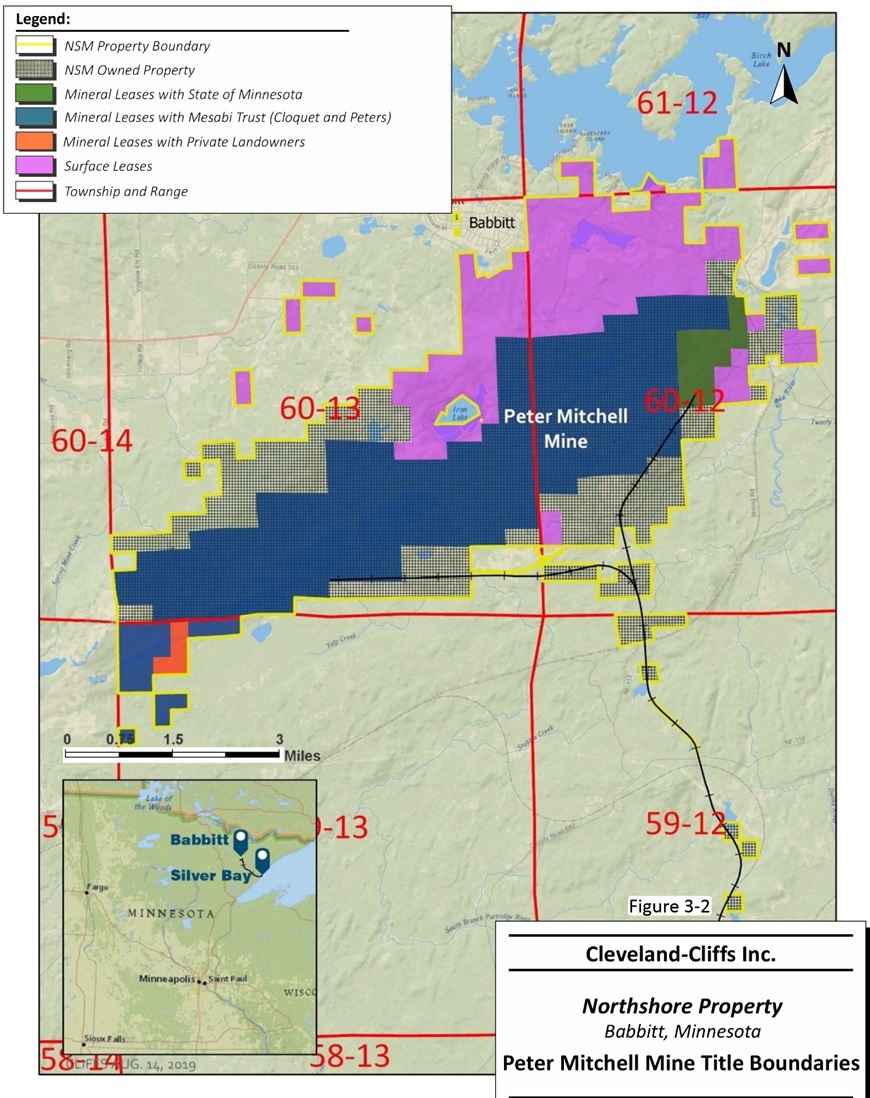
| Northshore | | Iron ore mining property owned by Northshore Mining Company, a direct, wholly owned subsidiary of Cliffs |
| NPDES | | National Pollutant Discharge Elimination System, authorized by the Clean Water Act |
| OCED | | Office of Clean Energy Demonstrations of the DOE |
| OPEB | | Other postretirement benefits |
| OSHA | | Occupational Safety and Health Administration of the U.S. Department of Labor |
| Platts 62% price | | Platts IODEX 62% Fe Fines CFR North China |
| QA/QC | | Quality assurance/quality control |
| QP | | Qualified person, within the meaning set forth in Item 1300 of Regulation S-K |
| RCRA | | Resource Conservation and Recovery Act |
| S&P | | Standard & Poor's |
| SEC | | U.S. Securities and Exchange Commission |
| Section 232 | | Section 232 of the Trade Expansion Act of 1962 (as amended by the Trade Act of 1974) |
| Securities Act | | Securities Act of 1933, as amended |
| SLR | | SLR Consulting US LLC (f/k/a SLR International Corporation) |
SO2 | | Sulfur dioxide |
| SOFR | | Secured Overnight Financing Rate |
| Stelco | | Stelco Holdings Inc., a Canadian corporation, and its consolidated subsidiaries, collectively, unless stated otherwise or the context indicates otherwise, which continues as Stelco Inc. following the amalgamation of Stelco Holdings Inc., Stelco Inc. and 13421422 Canada Inc. effective November 8, 2024 |
| Stelco Acquisition | | The acquisition of all of the outstanding common shares of Stelco Holdings Inc. by the Company, as provided for in the Arrangement Agreement |
| STRIPS | | Separate Trading of Registered Interest and Principal of Securities |
| SunCoke Middletown | | Middletown Coke Company, LLC, a subsidiary of SunCoke Energy, Inc. |
| | | | | | | | |
| Abbreviation or acronym | | Term |
| Tilden | | Iron ore mining property owned by Tilden Mining Company L.C., an indirect, wholly owned subsidiary of Cliffs |
| TMDL | | Total maximum daily load |
| Tooling and Stamping | | Cleveland-Cliffs Tooling and Stamping Holdings LLC, an indirect, wholly owned subsidiary of Cliffs, together with its subsidiaries |
| Topic 805 | | ASC Topic 805, Business Combinations |
| TSR | | Total shareholder return |
| Tubular Components | | Cleveland-Cliffs Tubular Components LLC, an indirect, wholly owned subsidiary of Cliffs |
| U. S. Steel | | United States Steel Corporation and its subsidiaries, collectively, unless stated otherwise or the context indicates otherwise |
| UAW | | United Auto Workers |
| United Taconite | | Iron ore mining property owned by United Taconite LLC, an indirect, wholly owned subsidiary of Cliffs |
| USMCA | | United States-Mexico-Canada Agreement |
| USW | | United Steelworkers |
| VEBA | | Voluntary employee benefit association trusts |
| VIE | | Variable interest entity |
| WLT | | Wet long ton |
PART I
INTRODUCTION
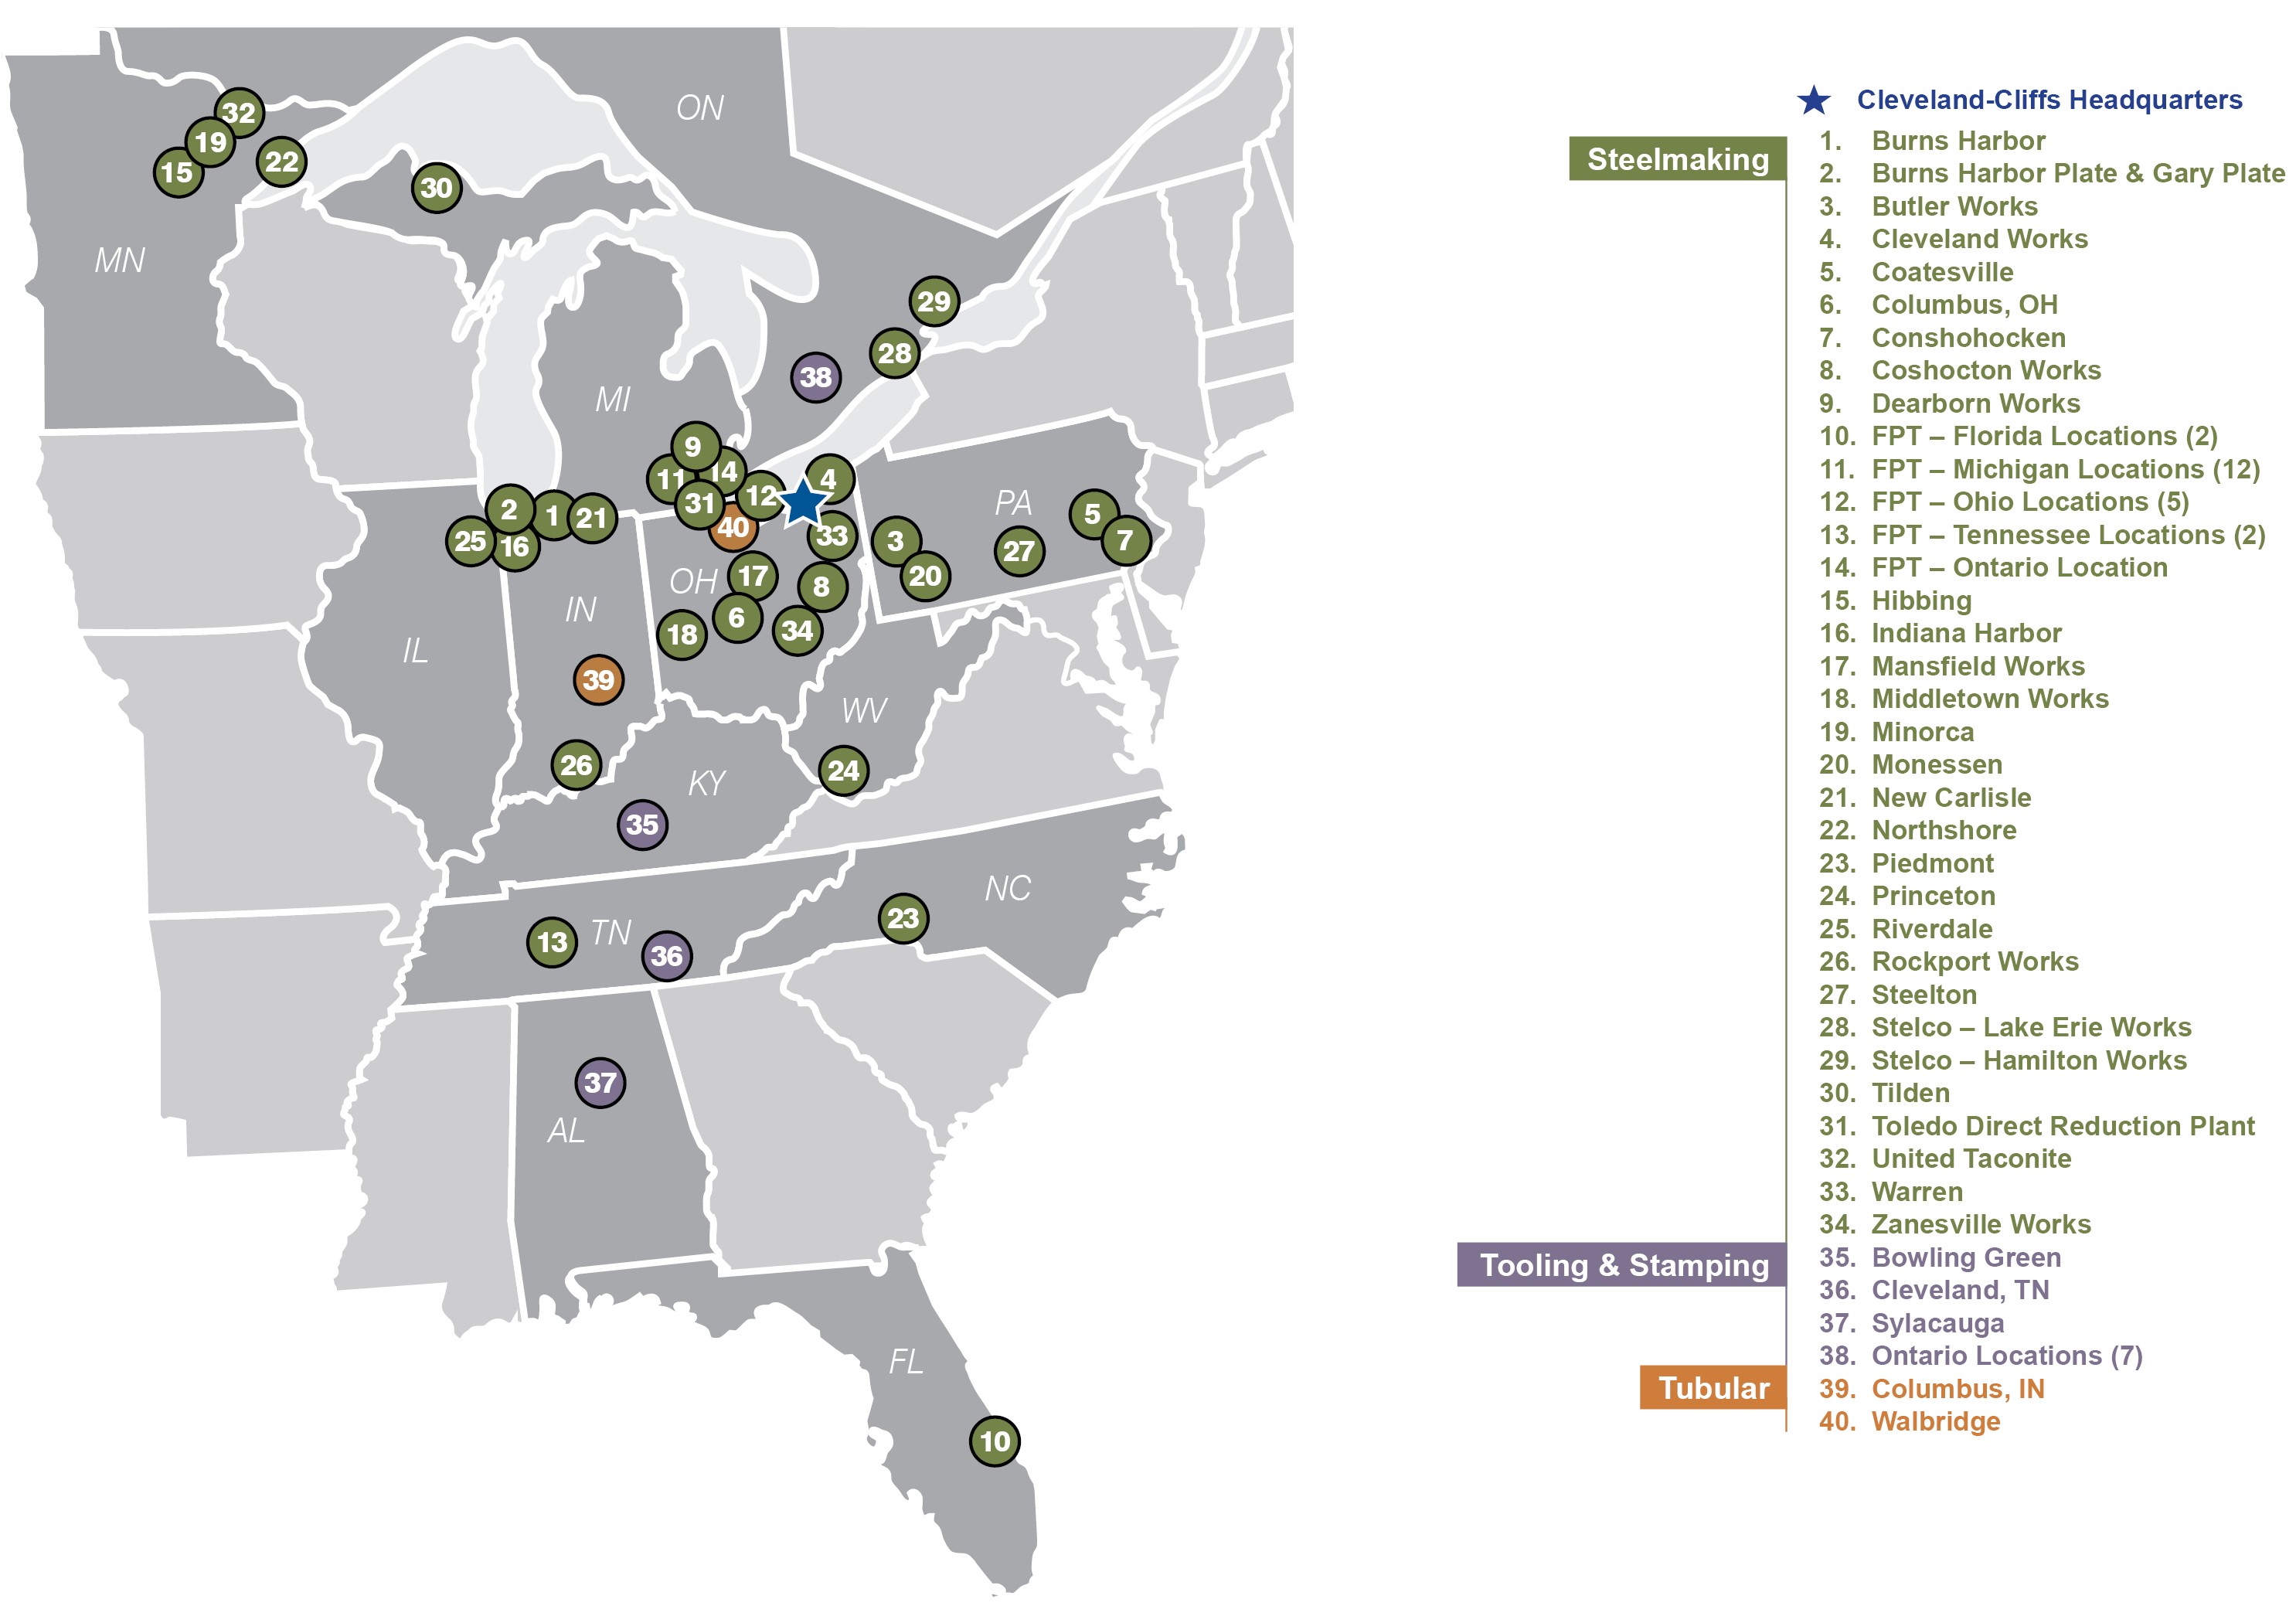
We are a leading North America-based steel producer with focus on value-added sheet products, particularly for the automotive industry. We are vertically integrated from the mining of iron ore, production of pellets and direct reduced iron, and processing of ferrous scrap through primary steelmaking and downstream finishing, stamping, tooling and tubing. Headquartered in Cleveland, Ohio, we employ approximately 30,000 people across our operations in the United States and Canada.
COMPETITIVE STRENGTHS
As a leading North America-based steel producer, we benefit from having the size and scale necessary in a competitive, capital intensive business. Our sizeable operating footprint provides us with the operational leverage and flexibility to achieve competitive margins throughout the business cycle. We also have a unique vertically integrated profile from mined raw materials, direct reduced iron, and ferrous scrap to primary steelmaking and downstream finishing, stamping, tooling and tubing. This positioning gives us more predictable costs throughout our supply chain and more control over both our manufacturing inputs and our end-product destination.
One of our most critical strengths that differentiates us from others in our industry is a unique and powerful partnership with our unionized workforce, particularly the USW. With over 20,000 employees subject to collective bargaining agreements, our strong and productive labor relationships are key to our long-term success and allow us to work together in achieving our goals. A clear example of the strength of our relationship is how we partner together to fight against dumped and illegally subsidized imported steel products. Our deep alignment with our represented employees is also recognized by our political leaders, who often publicly support us as a significant employer of a unionized workforce with a track record of working to maintain and increase middle class jobs.
Our primary competitive strength lies within our automotive steel business. We are a leading supplier of automotive-grade steel in the U.S. Compared to other steel end markets, automotive steel is generally higher quality, more operationally and technologically intensive to produce, and requires significantly more devotion to customer service than other steel end markets. This dedication to service and the infrastructure in place to meet our automotive customers’ demanding needs took decades to develop. We have continued to invest capital and resources to meet the requirements needed to serve the automotive industry and intend to maintain our position as an industry leader going forward.
Due to its demanding nature, the automotive steel business typically generates higher through-the-cycle margins, making it a desirable end market. Demand for our automotive-grade steel is expected to be healthy in the coming years as a result of a low unemployment rate, declining interest rates and the replacement of older vehicles.
Our footprint provides us with a competitive advantage in supplying automotive and other highly demanding end markets, as we are able to produce a wide range of high-quality products. Our integrated facilities utilize domestic and primarily internally sourced iron ore as the primary feedstock, which allows us to produce a high-quality product with low residual content. We also possess the breadth and depth of customer service, technical support, and research and development necessary to supply the demanding needs of the automotive industry.
Since becoming a steel company in 2020, we have dedicated significant resources to maintain and upgrade our facilities and equipment. The quality of our assets gives us a unique advantage in product offerings and operational efficiencies. After elevated spend in 2022 to perform overdue maintenance work at the facilities acquired as part of our 2020 acquisitions, we resumed normalized levels of maintenance capital and operating expenses in 2023, which continued throughout 2024. The necessary resources that we have invested in our footprint are expected to keep our assets at an automotive-grade level of quality and reliability for years to come.
Our utilization of fixed price contracts provides us a competitive advantage, as the steel industry is often viewed as volatile and subject to the market price of steel. Our fixed price contracts mitigate pricing volatility through the cycle.
Our ability to source our primary feedstock domestically and primarily internally is a competitive strength. This model reduces our exposure to volatile pricing and unreliable global sourcing. The ongoing conflict between Russia and Ukraine, along with other global tensions, and the new administration's focus on U.S. manufactured products, has displayed the importance of our North American-centric footprint, as our competitors who primarily operate EAF facilities rely on imported pig iron to produce flat-rolled steel, the supply of which has been disrupted. The best example is our legacy business of producing iron ore pellets. By internally sourcing the vast majority of our iron ore pellet requirements, our primary steelmaking raw material feedstock can be secured at a stable and predictable cost and not be subject to as many factors outside of our control.
We believe we offer the most comprehensive flat-rolled steel product selection in the industry, along with several complementary products and services. A sampling of our offering includes advanced high-strength steel, hot-dipped galvanized, aluminized, galvalume, electrogalvanized, galvanneal, HRC, cold-rolled coil, plate, GOES, NOES, stainless steels, tool and die, stamped components, rail, slab and cast ingot. Across the quality spectrum and the supply chain, our customers can frequently find the solutions they need from our product selection.
We are a leading producer of electrical steels referred to as GOES and NOES in the U.S., which we believe will be critical for the modernization of the electrical grid and the infrastructure needed to allow for increased EV adoption, both of which require electrical steels. Distribution transformers are critical to the maintenance and expansion of America’s electric grid. Transformers are in short supply, and that shortage stifles economic growth across the country. The shortage will continue to be exacerbated by the widespread adoption of Artificial Intelligence in virtually all sectors of the economy, which will exponentially increase the consumption of electricity in the U.S. and worldwide. Because of these industry dynamics and our current customer base, our electrical steel business is expected to continue to achieve strong profitability in the coming years.
We are the first and the only producer of HBI in the Great Lakes region. From our Toledo, Ohio facility, we produce a high-quality, low-cost and low-carbon intensive HBI product that can be used in our blast furnaces as a productivity enhancer, or in our BOFs and EAFs as a premium scrap alternative. We use HBI to stretch our hot metal production, lowering carbon intensity and reliance on coke. With increasing tightness in the scrap and metallics markets combined with our own internal needs, we expect our Toledo direct reduction plant to support healthy margins for us going forward.
STRATEGY
MAXIMIZE OUR COMMERCIAL STRENGTHS
We offer a full suite of flat steel products encompassing effectively all of our customers' needs. We are a leading supplier to the automotive sector, where our portfolio of high-end products delivers a broad range of differentiated solutions for this highly sought after customer base.
Our unique capabilities, driven by our portfolio of assets and technical expertise, give us an advantage in our flat-rolled product offering. We offer products that have superior formability, surface quality, strength and corrosion resistance for the automotive industry. In addition, our state-of-the-art Research and Innovation Center in Middletown, Ohio gives us the ability to collaborate with our customers and create new products and develop new and efficient steel manufacturing processes.
During 2022, we introduced our MOTOR-MAX® product line of NOES for high frequency motors and generators. During 2023, we introduced our C-STAR™ protection design, which was developed for the purpose of providing EV battery protection for improved safety purposes and can be used in any type of light vehicle. These unique product offerings and customer service capabilities enable us to remain a leading steel supplier to the automotive industry.
OPTIMIZE OUR FULLY-INTEGRATED STEELMAKING FOOTPRINT
We are a fully-integrated steel enterprise with an expansive footprint providing the ability to achieve healthy margins for flat-rolled steel throughout the business cycle. Our focus remains on realizing our inherent cost advantage in flat-rolled steel while also lowering carbon emissions. The combination of our ferrous raw materials, including iron ore, scrap and HBI, allows us to do so relative to peers who must rely on more unpredictable and unreliable raw material sourcing strategies.
We have ample access to scrap along with internally sourced iron ore pellets and HBI. Our ability to optimize use of these raw materials in our blast furnaces and BOFs ultimately boosts liquid steel output, reduces coke needs and lowers carbon emissions from our operations.
The necessary resources that we have invested in our footprint are expected to keep our assets at an automotive-grade level of quality and reliability for years to come, positioning us to benefit from operating efficiencies and improved capabilities in the coming years.
PURSUE VALUE-ENHANCING MERGERS AND ACQUISITIONS
We have a proven track record of successfully identifying undervalued assets and completing value-enhancing transactions through mergers and acquisitions. With our proven ability to integrate acquired assets and capture synergies, along with our powerful partnership with our union and non-union employees, we are confident in our ability to identify and execute value-enhancing mergers and acquisitions.
On November 1, 2024, we completed the Stelco Acquisition. The Stelco Acquisition confirms our commitment and leadership in integrated steel production in North America and strengthens our cost position by incorporating one of the lowest cost flat-rolled steelmaking assets in North America within our footprint. The Stelco Acquisition expands our existing presence in Canada and diversifies our customer base across service centers, construction and other industrial end markets with higher volumes of spot sales. As a result of the Stelco Acquisition, our exposure to the North American spot market has doubled, giving us further insight into spot market dynamics and diversifying our customer base toward spot customers.
Going forward, we will continue to be opportunistic in our pursuit of assets that would grow our business and offer opportunities to generate significant synergies. Our strong partnership with our union-represented employees was crucial in prior mergers and acquisitions as well as with the Stelco Acquisition. We remain the only domestic steel company in recent years to successfully acquire steel producing assets with USW-represented employees, which we view as a testament to the trust and mutual respect that we have developed with our union workforce.
EXPLORE ATTRACTIVE DOWNSTREAM OPPORTUNITIES
On July 22, 2024, we announced our investment plan for our new electrical distribution transformer production plant near our indefinitely idled Weirton, West Virginia facility. We intend to invest approximately $150 million to repurpose a warehouse to commence production of distribution transformers used in electric power distribution. We expect to receive $50 million in support
from the West Virginia Economic Development Authority in relation to the project, which reduces our net capital investment to approximately $100 million. Our planned Weirton distribution transformer production plant benefits from the ability to use existing building assets, infrastructure and re-employment opportunities for members of the workforce that were previously employed at our indefinitely idled Weirton tinplate mill.
This project is also expected to increase demand for American-made GOES produced at our Butler Works steel mill as well as for our carbon and stainless steel products used in the manufacturing of distribution transformers. We believe that distribution transformers are critical to America’s electrical infrastructure maintenance and expansion, and we are strategically positioning ourselves to benefit from a market that is undersupplied in the U.S. and currently experiencing extended lead times with a strong demand outlook. This project is expected to be completed in the first half of 2026.
ADVANCE OUR PARTICIPATION IN THE ENERGY TRANSITION
We are seeking to expand our customer base with the EV market. As this market grows, it will require more advanced steel applications to meet the needs of EV producers and consumers. These features include the already existing sophisticated steel supply for internal combustion engine vehicle parts, along with the added need for steel-based battery enclosures and reinforcement in EVs. With our unique technical capabilities and leadership in the automotive industry, we believe we are positioned better than any other North American steelmaker to supply the steel and parts necessary to fill these needs.
We also have the right products to meet the growing demand for renewable energy as well as for the modernization of the U.S. electrical grid. We offer plate products that can be used in windmills, which we estimate contain 130 tons of steel per megawatt of electricity. In addition, panels for solar power are heavy consumers of galvanized steel, where we are a leading producer. We estimate solar panels consume 40 tons of steel per megawatt of electricity.
We are currently a leading producer of electrical steel in the U.S., which can facilitate the modernization of the U.S. electrical grid. Along with charging networks, electrical steels are also needed in the motors of EVs.
ENHANCE OUR ENVIRONMENTAL SUSTAINABILITY
We remain committed to operating our business in a more environmentally responsible manner. In May 2024, we announced our commitment to achieve new GHG emissions reduction targets after we successfully achieved our prior commitment set in 2021 to reduce Scope 1 (direct emissions) and Scope 2 (indirect emissions from purchased electricity or other forms of energy) GHG emissions by 25% by 2030, relative to 2017 levels, well ahead of our 2030 target year. Our new goals set forth below, relative to 2023 levels, are all supported by ongoing and planned technological developments with respect to our ironmaking and steelmaking practices:
▪A target to reduce Scope 1 and 2 GHG emissions intensity per metric ton of crude steel by 30% by 2035;
▪A target to reduce material upstream Scope 3 GHG emissions intensity per metric ton of crude steel by 20% by 2035; and
▪A long-term target aligned with the Paris Agreement’s 1.5 degrees Celsius scenario to reduce Scope 1, 2 and material upstream 3 emissions intensity per metric ton of crude steel to near net zero by 2050.
Additionally, we have made significant progress in reducing our emissions on a per ton basis. Since 2020, we have reduced our average Scope 1 and 2 emissions of integrated mills from 1.82 to 1.54 metric tons of CO2e per metric ton of crude steel produced in 2023, which is 28% lower than the global industry average.
Our future GHG emissions reductions are expected to be primarily driven by the use of direct reduced iron in electric melting furnaces, direct reduced iron in blast furnaces, the stretching of hot metal with additional scrap, enhancing efficiency of blast furnaces, implementing hydrogen use where possible, evaluating carbon capture and utilization technologies, procuring more clean energy, electrification of process equipment and operating with higher energy efficiency.
In March 2024, we were selected by the DOE's OCED for award negotiations to receive up to $575 million in total funding for two projects to accelerate industrial decarbonization initiatives. These fully obligated cooperative agreements provide up to a $500 million federal investment to replace our existing blast furnace at Middletown Works with a 2.5 million ton per annum hydrogen-ready direct reduced iron plant and two 120 megawatt electric melting furnaces to feed molten iron to the existing infrastructure already on site, including the BOF, caster, hot strip mill and various finishing facilities. The project is designed so that Middletown Works would maintain its existing raw steel production capacity of approximately 3 million net tons per year and would no longer use coke for iron production. We expect that the process would significantly reduce steel slab costs and dramatically reduce carbon emissions intensity with no adverse impact to product quality or capability and would make Middletown Works the most advanced, lowest GHG emitting integrated iron and steel facility in the world. This project will also sustain and slightly increase over 2,500 American manufacturing jobs that support the domestic steel industry. Following negotiations, in the third quarter of 2024, the OCED approved $19.1 million in spending to begin Phase 1 of the Middletown project, with the release of the remaining funding being subject to meeting certain project milestones for each project phase. The Middletown project is expected to be completed during 2029.
Additionally, we would receive up to $75 million for our Butler Works facility to replace two existing natural gas fired high temperature slab reheat furnaces with four electrified induction slab reheat furnaces, to bring optimum efficiency to our production of electrical steel. This project would reduce slab reheat energy use by over 70%, lower carbon emissions, and improve slab quality. This project will also support approximately 1,500 union employees dedicated to the domestic production of electrical steel, a strategic component of the nation’s electrical supply system. Following negotiations, in the third quarter of 2024, the OCED approved spending of $38 million to begin Phase 1 of the Butler project, with the remaining spending approvals contingent on
meeting progress milestones at the end of each project phase. The Butler project is expected to be completed by 2029. As a result of both of these projects, we would anticipate generating in excess of $500 million in annual cost savings and yield improvements.
In October 2023, the DOE announced its intention to award funding under the Infrastructure and Jobs Act for seven regional hydrogen hubs, including the Midwest Alliance for Clean Hydrogen. This hub, covering Illinois, Indiana and Michigan, was selected for $1 billion in funding and is near our two largest steel plants, Indiana Harbor and Burns Harbor. In January 2024, we commissioned a pipeline and successfully completed a hydrogen injection trial at our Indiana Harbor blast furnace #7. This follows an initial similar trial of hydrogen at our blast furnace in Middletown earlier in 2023. The use of hydrogen within our blast furnaces, when economically available in sufficient amounts, is expected to partially reduce coke rate and displace the release of CO2 with H2O, reducing our overall emissions.
IMPROVE FINANCIAL FLEXIBILITY
Given the cyclicality of our business, it is important to us to be in the financial position to easily withstand economic cycles and be opportunistic when attractive strategic opportunities arise. Since becoming a steel company in 2020, we have demonstrated our ability to generate healthy free cash flow and use it to reduce substantial amounts of debt, return capital to shareholders through share repurchases and make investments to both improve and grow our business.
We have a track record of demonstrating that we can quickly deleverage our balance sheet and have also historically shown our ability to take advantage of volatility in the debt markets and repurchase notes at a discount. We expect to generate healthy free cash flow in the coming years and intend to utilize it to deleverage our balance sheet following the closing of the Stelco Acquisition. We also maintain a long maturity runway with our outstanding debt, with our nearest maturities coming in 2027, which supports our flexibility to navigate varied economic environments for extended periods of time.
BUSINESS OPERATIONS
We have a vertically integrated portfolio, which begins at the mining stage and goes all the way through the manufacturing of steel products, including stamping, tooling and tubing. We have the unique advantage as a steel producer of being fully or partially self-sufficient with our production of raw materials for steel manufacturing, which includes iron ore pellets, HBI, scrap and coking coal. We are organized into four operating segments based on the differentiated products – Steelmaking, Tubular, Tooling and Stamping, and European Operations. We primarily operate through one reportable segment – the Steelmaking segment.
Our primary steel producing and finishing facilities are located across Illinois, Indiana, Michigan, Ohio, Pennsylvania, and Ontario. We operate eight blast furnaces and five EAFs with the configured capability of producing approximately 23.0 million net tons of raw steel annually. Raw steel is generally cast into slabs and finished based on customer specifications. Finishing is completed on site at our integrated operations or at one of our standalone finishing facilities.
Ferrous raw materials for the production of steel are primarily internally sourced from our iron ore mines in Michigan and Minnesota, our direct reduction plant in Ohio and our scrap facilities in Michigan, Ohio, Tennessee, Florida and Ontario. We also operate a coal mining complex in West Virginia and produce coke from our facilities in Indiana, Ohio, Pennsylvania and Ontario.
Our Other Businesses primarily includes the Tubular and Tooling and Stamping operating segments that provide customer solutions with carbon and stainless steel tubing products, advanced-engineered solutions, tool design and build, hot- and cold-stamped steel components and complex assemblies.
Refer to Part I – Item 2. Properties for additional information.
PRODUCTS AND MARKETS
| | | | | | | | |
| 2024 Product Mix (By Revenue) | | Primary Products |
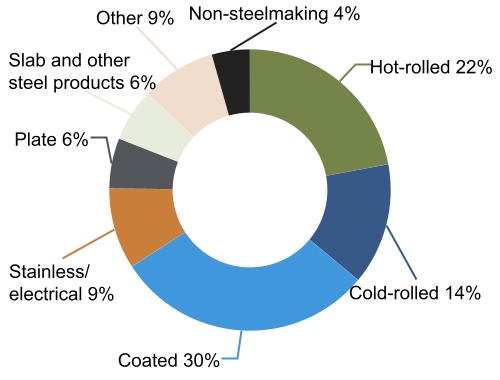
| | | | | | | | | | | |
| ◦HOT-ROLLED | ◦STAINLESS AND ELECTRICAL | ◦OTHER |
| ◦COLD-ROLLED | ◦Scrap |
| ◦COATED | ◦GOES | ◦Iron Ore |
| ◦Aluminized | ◦NOES | ◦HBI |
| ◦Electrogalvanized | ◦Auto Chrome | ◦Coal |
| ◦Galvalume | ◦PLATE | ◦Coke |
| ◦Galvanneal | ◦SLAB AND OTHER STEEL PRODUCTS | ◦NON-STEELMAKING |
| ◦Hot-dipped Galvanized | ◦Stamped Components |
| | ◦Slab | ◦Tool and Die |
| | ◦Rail | ◦Tubing |
| | ◦Blooms | |
| | ◦Cast Ingots | |
As a fully integrated steel enterprise, we have a comprehensive portfolio of steel solutions. We primarily sell our products to customers in four broad market categories. The following table presents the percentage of our revenues to each of these markets during the year:
| | | | | | | | | | | | | | | | | | | | |
| Market | | Primary Products Sold to End Market | | 2024 | | 2023 |
| Direct automotive | | Cold-rolled, galvanized, aluminized, NOES and stainless | | 32 | % | | 36 | % |
| Infrastructure and manufacturing | | Hot-rolled, cold-rolled, galvanized, plate, GOES, stainless and rail | | 27 | % | | 26 | % |
| Distributors and converters | | All grades of steel | | 28 | % | | 25 | % |
| Steel producers | | Slab, scrap, iron ore, HBI, coal and coke | | 13 | % | | 13 | % |
The change in percentages of revenues to each market in 2024, compared to 2023, was driven primarily by the decrease in volumes for our fixed price contracts to the direct automotive market and improved diversification across end markets as a result of the Stelco Acquisition.
We sell our products principally to customers in North America. As a result of the Stelco Acquisition, we now sell approximately 30-35% of our flat-rolled steel shipments under fixed price contracts. These contracts are typically one year in duration and expire at various times throughout the year. Some of these contracts have a surcharge mechanism that passes through certain changes in input costs. The remaining portion of our flat-rolled steel shipments are sold based on the spot market at prevailing market prices or under contracts that involve variable pricing that is tied to an independently published steel index.
AUTOMOTIVE MARKET
We specialize in manufacturing difficult-to-produce and high-quality steel products with demanding delivery performance and first-class customer technical support. Through our collaborative relationships with automotive producers, we develop breakthrough steel solutions that help our customers meet their product requirements. The quality of our steel is appealing to end users because of its strength, surface quality and formability. EAF producers’ equipment is designed to utilize scrap as their main feedstock, which often contains high residual or impure content, limiting their product capabilities. The exacting requirements for servicing the automotive market generally allows for higher selling prices for products sold to that market than for the commodity types of steel sold to other markets.
The largest end user for our steel products is the automotive industry in North America, which makes light vehicle production a key driver of demand. During 2024, North American light vehicle production was 15.5 million units, down from 15.7 million units in 2023. North American light vehicle production in 2025 and beyond is expected to remain above 15 million units annually. Additionally, the average age of light vehicles on the road in the U.S. is at an all-time high of 12.6 years, which should support demand as older vehicles need to be replaced. We also expect that a declining interest rate environment would increase demand for vehicles in the U.S. as buyers have been cautious due to elevated interest rates. As a leading supplier of automotive-grade steel in North America, we expect to benefit from healthy vehicle production levels over the coming years.
Furthermore, during 2024, consumer demand for sport utility vehicles, trucks and crossovers continued to increase, while demand for smaller sedans and compact cars declined. We benefit from intentionally targeting larger vehicle platforms to take advantage of consumer preferences, and we have focused on and have been successful in supplying sizeable portions of numerous large vehicle platforms. As a result, a significant portion of the automotive steel that we sell is used to produce these popular larger vehicles. In addition to benefiting from our exposure to consumers’ strong demand for larger vehicles, these vehicles also typically contain a higher volume of steel than smaller sedans and compact cars, providing us the opportunity to sell a higher volume of our steel products.
Automotive manufacturers continue to explore opportunities to develop vehicles that are lighter in weight. We collaborate with our automotive customers and their suppliers to develop innovative solutions using our developments in light weighting, efficiency, and material strength and formability across our extensive product portfolio, in combination with our automotive stamping and tube-making capabilities. During 2023, we introduced an all steel battery box design utilizing various grades of AHSS for improved use for lower GHG emissions, to maintain light-weighting targets, and to gain cost benefits when compared to using alternative materials. We believe we offer steel products that are stronger, less expensive, have competitive weight savings, are easier to repair and are more environmentally friendly than alternative materials.
Automotive manufacturers have also been increasing their development of EVs in order to meet the growing customer adoption of EVs. Many motors used in EVs being sold in the U.S. today are imported from foreign suppliers, but more local sourcing and manufacturing of motors is expected to occur in the future. As a leading producer in North America of high-efficiency NOES, which is a critical component of EV motors, we are positioned to potentially benefit from the growth of EVs going forward. We believe our strong foundation in electrical steels and long-standing relationships with automotive manufacturers and their suppliers will provide us with an advantage in this market as it continues to grow and mature. Likewise, the growing customer adoption of EVs may also increase demand for improvements in the electric grid to support higher demand for more extensive battery charging infrastructure, which our GOES could support.
The majority of our sales to the automotive market are under annual fixed price contracts.
INFRASTRUCTURE AND MANUFACTURING MARKET
We sell a variety of our steel products, including hot-rolled, cold-rolled, galvanized, plate, stainless, electrical and rail, to the infrastructure and manufacturing market. This market includes sales to manufacturers of HVAC, appliances, power transmission
and distribution transformers, storage tanks, ships, railcars, wind towers, machinery parts, heavy equipment, military armor and railway lines. Domestic construction activity and the replacement of aging infrastructure directly affect sales of steel to this market. Federal legislation, including the Infrastructure and Jobs Act, the CHIPS Act and the Inflation Reduction Act, is expected to elevate demand for steel products related to renewable energy, as well as the modernization of the U.S. electrical grid. Our plate products can be used in windmills, which we estimate contain 130 metric tons of steel per megawatt of electrical generating capacity. Additionally, we estimate solar panels consume 40 metric tons of steel per megawatt of electrical generating capacity.
Sales to this end market are made under a combination of annual fixed price contracts, index-linked pricing arrangements and spot sales.
DISTRIBUTORS AND CONVERTERS MARKET
Virtually all of the grades of steel we produce are sold to the steel distributors and converters market. This market generally represents downstream steel service centers, which source various types of steel from us and fabricate it according to their customers' needs. Our steel is typically sold to this market on a spot basis or under contracts linked to steel pricing indices. Demand and pricing for this market can be highly dependent on a variety of factors, including global and domestic commodity steel production capacity, demand for manufactured goods, the price of scrap, the relative health of the global economy, the import and export levels of other steel producing nations, service center inventory management, the provisions of international trade agreements and fluctuations in international currencies.
The price for domestic HRC, the most significant index in driving the revenues and profitability of our Steelmaking segment, averaged $772 per net ton for 2024, compared to $906 per net ton in 2023. The significant decline was a result of weaker than anticipated light vehicle production, the lowest domestic steel demand environment in 15 years, excluding the COVID-impacted year of 2020, and elevated import levels.
STEEL PRODUCERS MARKET
The steel producers market represents third-party sales to other steel producers, including those who operate blast furnaces and EAFs. It includes any sales of raw materials and semi-finished and finished goods, including iron ore pellets, coal, coke, HBI, scrap, slab and other steel products.
FPT is one of the largest processors of prime scrap in the U.S. Our scrap presence has developed further since acquiring FPT as we have leveraged our long-standing flat-rolled automotive and other customer relationships into recycling partnerships. Our steelmaking operations consume a large portion of the ferrous scrap processed by FPT. We also have third-party sales of ferrous and non-ferrous scrap.
The price of busheling scrap, a necessary input for flat-rolled steel production in EAFs in the U.S., averaged $429 per long ton during 2024, a 12% decrease from the prior year, but remained well above the historical ten-year average of approximately $400 per long ton. We expect the price of busheling scrap to remain elevated above historical averages in the coming years due to the continued decline of prime scrap generation and the growth of EAF capacity in the U.S., along with a push for expanded scrap use globally.
Third-party slab sales are also a large component of sales to this market, which are primarily made under a long-term supply agreement that was initiated in connection with the closing of the AM USA Transaction.
Production from our iron ore mines is predominantly consumed by our steelmaking operations. During 2024 and 2023, we sold 2 million and 4 million long tons of iron ore products, respectively, to third parties from our share of production from our iron ore mines. The merchant portion of our iron ore pellet production is sold pursuant to long-term supply agreements or through spot contracts.
APPLIED TECHNOLOGY, RESEARCH AND DEVELOPMENT
The utilization of our research and development capabilities has allowed us to introduce new steel products to the marketplace. Our research and development activities provide us the ability to offer a broad range of steel products, improve existing products and processes and develop new ones. As part of our underlying strategy to maintain and improve our product, service and technical capabilities, research and innovation spend totaled $27 million and $30 million in 2024 and 2023, respectively.
As a leading supplier of steel to the automotive industry in North America, it is important that we maintain our world-class research and development team to expand our capabilities and bring new steel products to the marketplace. Our ongoing efforts begin at our state-of-the-art Research and Innovation Center in Middletown, Ohio, where we collaborate with our automotive customers and their suppliers to develop products that meet their needs. We have a customer technical support team that is dedicated to understanding customers’ current and long-term requirements and translating them into product designs. The dedication and resources we allocate toward our research and development help us maintain our extensive product offering and provide our automotive customers with solutions to meet their steel needs. We expect our research and development capabilities to support us in efforts to remain a leading supplier to the automotive industry as automotive manufacturers continue to pursue EVs, lighter weight vehicles and other advancements in vehicle capabilities.
A prime example of our ability to help our customers through research and development can be seen in the support and products we offer automotive manufacturers in their continued development of all types of EVs to meet the growing consumer demand. During 2023, we introduced our C-STAR™ protection design, which was developed for the purpose of providing EV battery protection for improved safety performance and can be used in any type of light vehicle. We also introduced an all-steel battery box design utilizing various grades of AHSS for safety performance and lower GHG emissions, to maintain light-weighting targets,
and to gain cost benefits when compared to using alternative materials. We are also a leading producer in North America of high-efficiency NOES, which is a critical component of EV motors. Our MOTOR-MAX® NOES product line is used for high frequency motors and generators. We believe our strong foundation in electrical steels and long-standing relationships with automotive manufacturers and their suppliers will provide us with an advantage in this market as it continues to grow and mature.
Our ongoing innovation efforts showcase the advanced technical capabilities behind our world-class GOES products, which are essential in transformer production across North America. As the only remaining supplier of GOES in the region, we are committed to enhancing our products and driving reductions in core energy losses of transformers and motors, which is critical for our customers to produce the most efficient transformers globally. This leadership in GOES technology enables us to supply steel for domestically sourced transformers vital for large-scale power generation and electricity distribution.
COMPETITION
Our Steelmaking segment primarily competes with domestic and foreign producers of flat-rolled carbon, plate, stainless, rail and electrical steel, carbon and stainless tubular products, aluminum, carbon fiber, concrete and other materials that may be used as a substitute for flat-rolled steels in manufactured products. Our Tooling and Stamping and Tubular Components businesses both compete against other niche downstream business in highly fragmented markets.
The steel industry is often viewed as volatile and is subject to the market price of steel. Market pricing can be adversely impacted from foreign competition selling steel products into the U.S. at unfair discounts and the oversupply of steel products within the domestic market from both domestic and foreign competition. In many cases, we use fixed price contracts to reduce volatility from market pricing. Our fixed price contracts provide us stability on a large portion of our business when market pricing is volatile.
Price, quality, on-time delivery, customer service, technical expertise, and product innovation are the primary competitive factors in the steel industry and vary in importance according to the product category and customer requirements. Steel producers that sell to the automotive market are required to meet strict and high-quality product specifications that demand strong technical capabilities, investment in capital and other resources to manage inventory, customer service, and research and development. As a leading supplier of steel to the automotive industry in North America, we continue to meet all the requirements needed to serve the automotive industry and maintain our position as an industry leader going forward. Significant capital investments in equipment, technology and other resources that would effectively replicate our processes would be required for certain competitors to meet all the demands required of the automotive industry.
The steel industry has faced competition from aluminum manufacturers (and, to a lesser extent, other materials) as automotive manufacturers attempt to develop vehicles that are lighter in weight. To address automotive manufacturers’ light weighting needs that the aluminum industry is targeting, we have developed AHSS grades that we believe provide weight savings similar to aluminum, while being stronger, less costly, easier to repair, more sustainable and more environmentally friendly. Aluminum penetration has been primarily limited to specific automotive applications, such as outer panels and closures, rather than entire body designs. In addition, our automotive customers who continue to use steel, as opposed to aluminum and other alternative materials, are able to avoid the significant capital expenditures required to re-tool their manufacturing processes to accommodate the use of non-steel materials.
EAFs comprise over 70% of steel production and more than 45% of flat-rolled steel production in the U.S. The primary raw materials used by EAFs include scrap metal and ore based metallics, which have unpredictable and often volatile pricing. Additionally, the availability of these materials can be unreliable, as most of our competitors rely on imported ore based metallics. Due to recently completed and further announced flat-rolled EAF capacity additions in the U.S., and increasing focus on industry decarbonization, we expect the price of scrap to remain elevated over historical averages, providing our integrated footprint a competitive cost advantage. Our integrated facilities utilize domestic and primarily internally sourced iron ore as the primary feedstock, which allows us to produce high-quality products with low residual content. We also possess the breadth and depth of customer service, technical support, and research and development necessary to supply the demanding needs of the automotive industry and other demanding end markets. The additional capacity from domestic EAF competition could displace imports as the U.S. is still the largest net importer of steel in the world, and domestically produced steel is generally more environmentally friendly than imported steel.
Domestic steel producers can face significant competition from foreign producers. In certain instances, these foreign producers are often able to sell products in the U.S. at prices substantially lower than domestic producers. Depending on the country of origin, these reasons may include government subsidies; illegal dumping; lower labor, raw material, energy and regulatory costs; less stringent environmental regulations; less stringent safety requirements; the maintenance of artificially low exchange rates against the U.S. dollar; and preferential trade practices in their home countries. In 2024, finished steel imports increased 4% compared to the prior year as HRC price spreads between the U.S. and other regions were elevated at certain points of the year. Disparity between domestic and foreign steel prices or modifications to trade policies on imported steel by government authorities could directly or indirectly impact import levels in the future. Import levels are also affected to varying degrees by the relative level of steel production in China and other countries, the strength of demand for steel outside the U.S., and the relative strength or weakness of the U.S. dollar against various foreign currencies. Imports of finished steel into the U.S. accounted for 23% of domestic steel market consumption in 2024.
We continue to provide significant pension and healthcare benefits to a greater number of our retirees compared to certain other domestic and foreign steel producers that do not provide such benefits to any or most of their retirees, which impacts our overall cost of production relative to certain other steelmakers. However, we have taken a number of actions to reduce pension and healthcare benefits costs, including proactively renegotiating lower healthcare premiums, negotiating progressive labor agreements, transferring responsibility for healthcare benefits for various groups of retirees to VEBAs, offering voluntary lump-sum
settlements to pension plan participants and lowering retiree benefit costs for salaried employees. These actions have not only reduced some of the risks associated with our pension funding obligations, but more importantly have reduced our risk exposure to performance of the financial markets, which is a principal driver of pension funding requirements. We continue to actively seek opportunities to reduce pension and healthcare benefits costs.
ENVIRONMENTAL MATTERS
Our operations are subject to various laws and regulations governing the protection of human health and the environment. We monitor these laws and regulations, which change over time, to assess whether the changes affect our operations. We actively manage our operations in a manner that is protective of human health and the environment. We implement our environmental programs in accordance with applicable laws, regulations, and permits. We have implemented environmental management systems certified to ISO 14001:2015 standards as part of our environmental program, and 100% of our steelmaking facilities are certified.
In the construction and operation of our facilities, substantial costs have been and will continue to be incurred to comply with regulatory requirements and avoid undue effect on the environment. In 2024, 2023 and 2022, our capital expenditures relating to environmental matters totaled $67 million, $66 million and $133 million, respectively. Our current estimate for capital expenditures for environmental control facilities in 2025 is approximately $100 million for various water treatment, air quality, dust control, tailings management and other miscellaneous environmental projects. Additionally, we expect capital expenditures for environmental control facilities for each of 2026 and 2027 to be generally in line with 2025's estimated spending.
REGULATORY DEVELOPMENTS
Various governmental bodies continually promulgate new or amended laws and regulations that affect us, our customers and our suppliers in many areas, including air emissions and water discharges, waste management and disposal, the classification of materials and products, and other environmental, health and safety matters. Although we believe that our environmental policies and practices are sound and do not expect that the application of current laws, regulations or permits would reasonably be expected to result in a material adverse effect on our business or financial condition (except as noted below), we cannot predict the collective potential adverse impact of the expanding body of laws and regulations. Moreover, because all U.S. and Canadian steel, scrap and mining producers operate under similar environmental regulations, we do not believe that we are more disadvantaged than our competitors within the U.S. and Canada by our need to comply with these regulations. Some foreign competitors may benefit from less stringent environmental requirements in the countries where they produce, resulting in lower compliance costs for them and providing those foreign competitors with a cost advantage on their products.
There are, however, several notable proposed or recently promulgated rulemakings or activities that could have a material adverse impact on our facilities in the future depending on their ultimate outcome: changes to National Emission Standards for Hazardous Air Pollutants in the taconite, integrated iron and steel, and coke sectors; climate change and GHG regulations; changes to the National Ambient Air Quality Standards for particulate matter; changes to ozone regulations; selenium discharge regulation; Minnesota's sulfate wild rice water quality standard; Minnesota's mercury reduction rules; and efforts to reduce SO2 levels at steel plants in Canada.
NESHAPS FOR TACONITE, INTEGRATED IRON AND STEEL, AND COKE CATEGORIES
Under the Clean Air Act, within eight years after promulgating National Emissions Standards for Hazardous Air Pollutants (NESHAPS) in industry-specific categories, the EPA must review the standards to determine whether they continue to protect human health with an ample margin of safety and protect against adverse environmental effects. In addition, the EPA is required to review and revise the standard every eight years to account for improvements in HAP control technology or methods.
The EPA has worked with the taconite, integrated iron and steel, and coke industries for years to collect data in order to recalculate the risk from HAP emissions from each category and to address whether new technologies existed in those sectors. The EPA determined that the risk from the sources in these categories was acceptable. However, in response to a court order, the EPA then issued revisions to the rulemakings for numerous source categories, including taconite and integrated iron and steel.
In January 2024, the EPA finalized amendments to the taconite sector rule that contain new limits for mercury and acid gases (hydrogen chloride and hydrogen fluoride). In March 2024, the EPA finalized amendments to the integrated iron and steel sector rule that contain numerous new emission limits and work practices for blast furnaces, BOF operations, slag processing and sintering operations. In August 2024, the EPA granted partial reconsideration of the final integrated iron and steel sector rule and expressed its intent to issue technical corrections. Lastly, for the coke sector, the EPA finalized new limits and other requirements in May 2024.
We have filed Petitions for Administrative Reconsideration and Stay to the EPA and Petitions for Judicial Review and Stay of each of these rules. If the EPA or the courts uphold any of the rules in their current form, the impact could be material.
CLIMATE CHANGE AND GREENHOUSE GAS REGULATIONS
Continued attention to issues concerning climate change, the role of human activity in affecting climate change, and potential mitigation through regulation and legislation may have a material impact on our customers and suppliers, our operations and financial results in the future. Policymakers are evaluating or developing carbon regulation at all levels of government. Additionally, international treaties or agreements, such as the Paris Agreement, may influence legislative and regulatory decisions in the U.S. and Canada. Potential climate-related regulations and legislation that could impact our business include reporting obligations, such as the climate accountability package enacted in California in late 2023, mandatory carbon reductions, carbon
pricing mechanisms and trade policies, such as the federal and provincial carbon pricing programs in Canada, the European Union's Carbon Border Adjustment Mechanism (which entered into its transitional phase late in 2023), and climate-related procurement and product labeling requirements. The dynamic outlook for these potential regulations limits our ability to quantify the long-term net impacts of potential carbon compliance costs to our operations. In the absence of comprehensive federal carbon legislation, numerous state, regional and federal regulatory initiatives are under development or are becoming effective, thereby creating a disjointed approach to GHG emissions limitations, potential carbon pricing and climate-related procurement activities. We intend to remain active in the discussions related to these legislative and regulatory changes.
Our exposure on this issue includes both the direct and indirect financial risks associated with the regulation of GHG emissions, as well as potential physical risks associated with climate change adaptation. We periodically review the physical risks related to climate change. As an energy-intensive business, we have a broad range of GHG emissions sources, such as iron ore furnaces and kilns, mobile equipment, EAFs and integrated steelmaking facilities, among others. As such, our potential regulatory risks include: (1) the costs associated with on-site emissions levels (direct impacts) or the reduction thereof; and (2) indirect costs passed through to us from energy providers and other suppliers (indirect impacts).
Internationally, mechanisms to require or incentivize emissions reductions are being implemented in various countries, with differing designs and stringency, according to resources, economic structure and politics. However, some foreign competitors outside of the U.S. and Canada may benefit from less stringent climate-related requirements, providing those foreign competitors with a cost advantage on their products.
Due to potential carbon restriction schemes, our businesses and customer base could suffer negative financial impacts over time as a result of increased energy, environmental and other costs to comply with the limitations that could be imposed on GHG emissions. We believe our exposure can be reduced by numerous factors, including engaging with relevant stakeholders and policymakers on potential GHG regulation and legislation; emissions reduction opportunities, such as energy efficiency, industrial electrification of process heating, carbon capture, utilization and sequestration, renewable energy and fuel flexibility, such as hydrogen; and other efficiency-improving material inputs, products and technologies.
CHANGES TO NATIONAL AMBIENT AIR QUALITY STANDARDS FOR PARTICULATE MATTER
In February 2024, the EPA finalized an amendment to the National Ambient Air Quality Standard for particulate matter. The final rule lowers the primary annual fine particulate matter (PM2.5) level from 12 micrograms per cubic meter (ug/m3) of air to 9 ug/m3. This standard became effective in May 2024, potentially impacting air permitting and requiring additional emission reductions for existing operations. The potential changes to air pollution control equipment or operations needed to comply with the new particulate matter standard at our operations are not known at this time, and the potential cost is not estimable but could be material. Many entities appealed the final rule, and a decision is pending.
CHANGES TO OZONE REGULATIONS
In 2023, the EPA finalized new standards under its ozone transport authority for nitrogen oxide (an ozone precursor) on various industries (including the steel and iron ore sectors) that operate in specific states, including numerous states where we operate (Illinois, Indiana, Michigan, Ohio, Pennsylvania and West Virginia). In June 2024, the U.S. Supreme Court granted a stay of the ozone transport rule and further judicial review is expected in 2025.
Our Middletown, Cleveland, Indiana Harbor and Burns Harbor facilities are located in counties designated as not attaining the ozone ambient air quality standard. We are working with the state regulatory agencies to assess if there are any reasonably available and economically feasible emission control technologies for applicable emission sources, including boilers, reheat furnaces and other large fuel combustion sources. The potential changes to air pollution control equipment or operations are not known at this time, and the potential cost is not estimable until the nitrogen oxide regulations are promulgated.
SELENIUM DISCHARGE REGULATION
In Michigan, our Empire and Tilden mines have implemented compliance plans to manage selenium according to applicable permit conditions. Construction of a water treatment system for both facilities is anticipated to begin in 2028, and the system is anticipated to be operational in 2030. As of December 31, 2024, included within our Empire asset retirement obligation is a discounted liability of approximately $138 million, which includes the estimated costs associated with the construction of Empire's portion of the required infrastructure and expected future operating costs of the treatment facilities. Additionally, included within our Tilden future capital plan is approximately $32 million for the construction of Tilden's portion of the required infrastructure. We are continuing to assess and develop potential cost effective and sustainable selenium treatment technologies.
In July 2016, the EPA published new selenium fish tissue limits and lower lentic and lotic water column concentration criteria, which may someday increase the cost for treatment should the Michigan Department of Environment, Great Lakes and Energy adopt these new standards in lieu of the existing limits required by the Great Lakes Water Quality Initiative. Accordingly, we cannot reasonably estimate the timing or long-term impact of these water quality criteria on our business.
MINNESOTA'S SULFATE WILD RICE WATER QUALITY STANDARD
Upon future reissuance of NPDES renewal permits for our mining and pelletizing operations in Minnesota, we might be required to address sulfate concentrations in discharges to certain waterbodies. The impact of these potential obligations is currently not estimable. However, if we are required to significantly reduce sulfate concentrations in any discharges, financial impacts could be material.
MINNESOTA'S MERCURY REDUCTION RULES
In September 2014, Minnesota promulgated the Mercury Air Emissions Reporting and Reduction Rules, mandating mercury air emissions reporting and reductions from certain sources, including taconite facilities. The rules apply to all of our Minnesota iron ore mining and pelletizing operations and required submittal of a Mercury Reduction Plan to the MPCA in 2018. In the Mercury Reduction Plan, facilities evaluated if available control technologies could technically achieve a 72% mercury reduction rate. If available control technologies could not technically achieve a 72% mercury reduction rate, the facilities must propose alternative mercury reduction measures. One of the main tenets agreed upon for evaluating potential mercury reduction technologies during TMDL implementation and 2014 rule development proceedings was that the selected technology must meet the following “Adaptive Management Criteria”: the technology must be technically feasible; must be economically feasible; must not impact pellet quality; and must not cause excessive corrosion in the indurating furnaces or air pollution control equipment.
The Mercury Reduction Plans for our Minnesota facilities were submitted to the MPCA in December 2018. The plans determined that there are currently no proven technologies to cost effectively reduce mercury emissions from taconite furnaces to achieve the targeted 72% reduction rate, while satisfying all Adaptive Management Criteria. This determination was based on detailed engineering analysis and research testing. In January 2023, MPCA responded that certain technologies may be appropriate, and MPCA requested submission of revised Mercury Reduction Plans from the facilities, which are still under development. Potential impacts are not estimable at this time because the revised Mercury Reduction Plans remain under development.
REDUCTION OF SO2 LEVELS AT STEEL PLANTS IN CANADA
A federal pollution prevention notice issued under subsection 56(1) of the Canadian Environmental Protection Act, 1999 requires prescribed persons to prepare and implement pollution prevention plans addressing specified air emissions released from the iron and steel sector, including SO2. The notice applies to all Canadian steel mills, including Stelco, other integrated mills and EAF mills, and requires these mills to prepare and implement plans to achieve specified air emission targets for SO2. In parallel, the provincial Ontario Ministry of the Environment, Conservation and Parks is in the process of developing an integrated steel sector technical standard for several air parameters, including SO2. Discussions are underway with both the federal and provincial regulators to harmonize the timing and required technology to reduce SO2 emissions. Potential impacts of implementation are not estimable at this time, pending details on SO2 reduction requirements by the provincial regulator, but could be material.
OTHER GOVERNMENT LAWS AND REGULATIONS
In addition to environmental laws and regulations, we are subject to various laws and regulations around the world. For example, changes in trade regulations, including tariffs or other import or export restrictions, could lead to lower or more volatile global steel prices, impacting our profitability. In addition, health and safety regulations, including OSHA and MSHA regulations, have necessitated, and may continue to necessitate, increased operating costs or capital investments to promote a safe working environment. We comply with complex foreign and U.S. laws and regulations, which may include the Foreign Corrupt Practices Act and other anti-bribery laws, the European Union’s General Data Protection Regulation and other U.S. and foreign privacy regulations, and transportation and logistics regulations. The laws and regulations noted above, as well as other applicable laws and regulations, or the manner in which they are interpreted or enforced, may require us to make material investments in the form of additional processes, training and capital, among other things. For a discussion of the risks associated with certain applicable laws and regulations, see Part I – Item 1A. Risk Factors.
RAW MATERIALS AND ENERGY
Our steelmaking operations require iron ore, HBI, coke, coal, steel scrap, chrome, nickel, zinc and other alloys as primary raw materials. We also consume natural gas, electricity, industrial gases and diesel fuel at our operations. As a vertically integrated steel company, we are able to internally supply a majority of our ferrous raw materials needed for our steelmaking operations. We also attempt to reduce the risk of future supply shortages and price volatility in other ways. If multi-year contracts are available in the marketplace for those raw materials that we cannot supply internally, we may use these contracts to secure sufficient supply to satisfy our key raw material needs. When multi-year contracts are not available, or are not available on acceptable terms, we purchase the remainder of our raw material needs under annual contracts or conduct spot purchases. We also regularly evaluate alternative sources and substitute materials. Additionally, we may hedge portions of our energy and raw materials purchases to reduce volatility and risk. We believe that we have secured, or will be able to secure, adequate supply to fulfill our raw materials and energy requirements for 2025.
The raw materials needed to produce a ton of steel will fluctuate based upon the specifications of the final steel products, the quality of raw materials and, to a lesser extent, differences among steel production equipment. For example, generally, in our integrated steelmaking facilities, we consume approximately 1.4 net tons of coal to produce one net ton of coke. The process to produce one ton of raw steel (generally defined as a carbon slab) requires approximately 1.4 net tons of iron ore pellets and/or HBI pellet equivalents, 0.3 to 0.4 net tons of coke and 0.3 net tons of steel scrap or scrap substitutes. At normal operating levels, we also consume approximately 5 to 6 MMBtu’s of natural gas per net ton of raw steel produced, prior to rolling, finishing and further processing. Additionally, on average, our EAFs require 1.1 net tons of ferrous scrap, stainless scrap or scrap substitutes to produce one net ton of steel. While these estimated consumption amounts are presented to give a general sense of raw material and energy consumption used in our steel production, substantial variations may occur.
IRON ORE
We own or co-own five active iron ore mines in Minnesota and Michigan. Based on our ownership in these mines, our share of annual rated iron ore production capacity is approximately 29 million long tons, which supplies the vast majority of the iron ore needed for our steelmaking operations. Additionally, Stelco has a multi-year supply agreement to meet its iron ore pellet requirements and is party to an option agreement providing it with the ability to purchase a 25% ownership interest in the MinnTac iron ore mine, located in Mt. Iron, Minnesota, at any time through January 31, 2027. Refer to Part I - Item 2. Properties for additional information regarding our active iron ore mines.
HBI
Our investment into HBI production provides us access, when needed, to clean iron units in order to make advanced steel and stainless products. This access to our own production provides us flexibility and allows us to avoid the risks and carbon footprints of imported iron substitutes. Iron substitutes imported into the U.S. are traditionally sourced from regions of the world that have historically experienced greater political turmoil and have lower pollution standards than the U.S. Our investment demonstrates our raw material strategy in responsibly managing the risks of pricing, availability and overall carbon footprint of our critical inputs. We have an annual capacity of 1.9 million metric tons of HBI.
COKE AND COAL
We own five active cokemaking facilities, three of which are located within our Burns Harbor, Lake Erie and Hamilton facilities. These facilities currently provide more than half of the coke requirements for our steelmaking operations and have an annual rated capacity of 4.0 million net tons. Additionally, we have coke supply agreements with suppliers that provide our remaining requirements. Our purchases of coke are made under annual or multi-year agreements with periodic price adjustments.
We have annual rated metallurgical coal production capacity of 1.8 million net tons from our Princeton mine, which supplies a portion of our metallurgical coal needs. We typically purchase most of our metallurgical coal under annual fixed price agreements. We believe there are adequate external supplies of coke and coal available at competitive market prices to meet our needs. Refer to Part I - Item 2. Properties for additional information.
STEEL SCRAP
We own the assets of FPT, which provides us sourcing and processing capabilities for both prime and obsolete scrap. This access is critical, because prime scrap demand is expected to grow as new flat-rolled EAF capacity has started to come online and is expected to increase in the coming years. FPT includes 22 facilities that are primarily located in the Midwest near our steel facilities. Additionally, our access to scrap furthers our commitment to being an environmentally-friendly, low-carbon intensity steelmaker with a cleaner materials mix as we are able to better optimize productivity at our existing EAFs and BOFs.
The majority of our scrap requirements can be generated or processed from internal sources, including scrap generated at our steel production facilities. We believe that supplies of additional steel scrap to meet the needs of our steelmaking operations are readily available from outside sources at competitive market prices.
OTHER MATERIALS
We believe that supplies of chrome, nickel, zinc and other alloys adequate to meet the needs of our steelmaking operations are readily available from outside sources at competitive market prices.
ENERGY
We consume a large amount of natural gas, electricity, industrial gases and diesel fuel, which are significant costs to our operations. The majority of our energy requirements are purchased from outside sources. Access to long-term, low-cost sources of energy in various forms is critically important to our operations.
Natural gas is procured for our operations utilizing a combination of long-term, annual, quarterly, monthly and spot contracts from various suppliers at market-based pricing. We believe access to low-cost and reliable sources of natural gas is available to meet our operations’ requirements.
We purchase electricity for all of our operations in either regulated or deregulated markets. Due to the distinct nature of the regulated market, we procure electricity through either long-term or annual contracts. In deregulated markets, we purchase the majority of our electricity in the day-ahead market. Some of our operations also use self-generated coke oven gas and/or blast furnace gas to produce electricity, which is an environmentally-friendly practice that also reduces our need to purchase electricity from external sources. Additionally, we closely monitor developments at the state and federal levels that could impact electricity availability or cost and incorporate such changes into our electricity supply strategy in order to maintain reliable, low-cost supply. We also are currently contracting for the increased use of renewable energy to complement our existing supply, which is anticipated to reduce our emissions profile. We believe there is an adequate supply of competitively priced electricity to fulfill our requirements.
We purchase industrial gases and diesel fuel under long-term contracts with various suppliers. We believe we have access to adequate supplies of industrial gases and diesel fuel to meet our needs.
HUMAN CAPITAL
Cliffs has a long, proven history of attracting and retaining exceptional talent. We believe our employee-centric management philosophy is the key to our success.
As of December 31, 2024, we employed approximately 30,000 people, with approximately 90% located within the U.S. Over 70% of our workforce are hourly employees, with the vast majority subject to collective bargaining agreements with various labor unions.
LABOR RELATIONS
Our labor relations philosophy is a cornerstone of our talent strategy. At Cliffs, we know that maintaining strong, positive relationships with labor unions is key to our long-term growth. We recognize and respect the right of our employees to freely associate and collectively bargain, and we do not engage in harassment, intimidation or retaliation for their efforts to bargain collectively.
More than 90% of Cliffs’ hourly workforce is represented by three prominent unions — USW, UAW and IAM. The hardworking union-represented men and women of Cliffs are the lifeblood of our Company. Our employees operate and maintain our facilities and are, ultimately, responsible for safely delivering a quality product internally and to our customers. Therefore, we engage with our unions as business partners, and together we have achieved a number of successes that benefit our business and our people alike.
We are proud to report that we successfully renegotiated all of our open labor agreements during 2024 without any difficulty or disruption. This positive partnership with our unions helps us remain competitive for talent and protects our customers and their supply chains from disruptions due to labor disagreements.
TALENT RETENTION
We believe that our future success largely depends upon our continued ability to attract and retain a highly skilled workforce. We provide our employees with competitive salaries, incentive-based bonus programs that provide above-market compensation opportunities when our Company performs well, development programs that enable continued learning and growth, and a robust benefits package that promotes well-being across all aspects of their lives, including health care, retirement planning and paid time off. In addition to these programs, we have used targeted, equity-based grants with vesting conditions to facilitate retention of key personnel. These tools have enabled us to increase the retention of key personnel, including our corporate and site leadership teams and critical technical talent.
ROBUST EMPLOYEE BENEFITS PROGRAMS
The success of our business is fundamentally connected to the well-being of our people. Accordingly, we are committed to the health, safety and wellness of our employees. We provide our employees and their families with access to a variety of innovative, flexible, and convenient health and wellness programs, including benefits that provide protection and security so they can have peace of mind concerning events that may require time away from work or that impact their financial well-being; that support their physical and mental health by providing tools and resources to help them improve or maintain their health and encourage engagement in healthy behaviors; and that offer choice so they can customize their benefits to meet their needs and the needs of their families.
DIVERSITY, EQUITY AND INCLUSION
We continue to foster a culture of diversity, equity and inclusion at Cliffs. Through our OneCliffs Way of Doing Business (our Code of Business Conduct and Ethics), we outline our Core Values, which include Trust, Respect and Open Communication. To us, this means encouraging and accepting different views and supporting an inclusive workplace. Further, our OneCliffs Way of Doing Business provides that we will not make employment-related decisions nor will we discriminate based on race, color, religion, national origin, age, military or veteran status, disability, sex (including sexual orientation and gender identity), pregnancy, genetic information, ethnicity or any other characteristic protected by applicable law. We strive to make Cliffs a safe place to work for all. Harassment and/or intimidation are not tolerated anywhere in our Company. This allows our employees to develop a career at Cliffs by focusing on the meaningful and challenging work at our Company.
SAFETY
Safe production is our primary core value as we continue to reinforce a zero injury culture at our facilities. We constantly monitor our safety performance and make continuous improvements to effect change. Best practices and incident learnings are shared throughout the Company to ensure each facility can administer the most effective policies and procedures for enhanced workplace safety. Progress toward achieving our objectives is accomplished through a focus on proactive sustainable safety initiatives, and results are measured against established industry and Company benchmarks, including our Company-wide Total Reportable Incident Rate. During 2024, our Total Reportable Incident Rate (including contractors) was 0.9 per 200,000 hours worked.
Refer to Exhibit 95 Mine Safety Disclosures for mine safety information required in accordance with Section 1503(a) of the Dodd-Frank Act.
AVAILABLE INFORMATION
Our headquarters are located at 200 Public Square, Suite 3300, Cleveland, Ohio 44114-2315, and our telephone number is (216) 694-5700. We are subject to the reporting requirements of the Exchange Act and its rules and regulations. The Exchange Act requires us to file reports, proxy statements and other information with the SEC.
The SEC maintains a website that contains reports, proxy statements and other information regarding issuers that file electronically with the SEC. These materials may be obtained electronically by accessing the SEC’s home page at www.sec.gov.
We use our website, www.clevelandcliffs.com, as a channel for routine distribution of important information, including news releases, investor presentations and financial information. We also make available, free of charge on our website, our Annual Reports on Form 10-K, Quarterly Reports on Form 10-Q, Current Reports on Form 8-K and amendments to these reports filed or furnished pursuant to Section 13(a) or 15(d) of the Exchange Act, as soon as reasonably practicable after we electronically file these documents with, or furnish them to, the SEC. In addition, our website allows investors and other interested persons to sign up to receive automatic email alerts when we post news releases and financial information on our website.
We also make available, free of charge, the charters of the Audit Committee, Strategy and Sustainability Committee, Governance and Nominating Committee, and Compensation and Organization Committee, the Corporate Governance Guidelines adopted by our Board of Directors, as well as the Code of Business Conduct and Ethics. These documents are available through our investor relations page on our website at www.clevelandcliffs.com. The SEC filings are available by selecting “Investors” and then “SEC Filings,” and corporate governance materials are available by selecting "Investors" and then “Governance” for the Board Committee Charters, the Corporate Governance Guidelines, and the Code of Business Conduct and Ethics.
References to our website or the SEC’s website do not constitute incorporation by reference of the information contained on such websites, and such information is not part of this Annual Report on Form 10-K.
Copies of the above-referenced information are also available, free of charge, by calling (216) 694-5700 or upon written request to:
Cleveland-Cliffs Inc.
Investor Relations
200 Public Square, Suite 3300
Cleveland, OH 44114-2315
INFORMATION ABOUT OUR EXECUTIVE OFFICERS
Following are the names, ages and positions of the executive officers of the Company as of February 25, 2025. Unless otherwise noted, all positions indicated are or were held with Cleveland-Cliffs Inc.
| | | | | | | | |
| Name | Age | Position(s) Held |
| Lourenco Goncalves | 67 | Chairman, President and Chief Executive Officer (August 2014 – present); and Chairman, President and Chief Executive Officer of Metals USA Holdings Corp., an American manufacturer and processor of steel and other metals (May 2006 – April 2013). |
| Clifford Smith | 65 | Executive Vice President, Chief Operating Officer (April 2024 – present); Executive Vice President & President, Cleveland-Cliffs Steel (September 2021 – April 2024); and Executive Vice President, Chief Operating Officer (January 2019 – September 2021). |
| Keith Koci | 60 | Executive Vice President & President, Cleveland-Cliffs Services (September 2021 – present); Executive Vice President, Chief Financial Officer (February 2019 – September 2021); and Senior Vice President and Chief Financial Officer, Metals USA Holdings Corp. (2013 – February 2019). |
| Celso Goncalves | 37 | Executive Vice President, Chief Financial Officer (September 2021 – present); Senior Vice President, Finance & Treasurer (March 2020 – September 2021); and Vice President, Treasurer (January 2018 – March 2020). |
| Terry Fedor | 60 | Executive Vice President, Operations (October 2022 – present); Executive Vice President, Operations, East (September 2021 – October 2022); Executive Vice President, Chief Operating Officer, Steel Mills (March 2020 – September 2021); and Executive Vice President, Operations (February 2019 – March 2020). |
| Traci Forrester | 53 | Executive Vice President, Environmental & Sustainability (May 2021 – present); Executive Vice President, Business Development (May 2019 – May 2021); and Vice President, Deputy General Counsel & Assistant Secretary (January 2018 – May 2019). |
| James Graham | 59 | Executive Vice President, Chief Legal and Administrative Officer & Secretary (January 2024 – present); Executive Vice President, Human Resources, Chief Legal and Administrative Officer & Secretary (April 2022 – January 2024); and Executive Vice President, Chief Legal Officer & Secretary (November 2014 – April 2022). |
| Kimberly Floriani | 42 | Senior Vice President, Controller & Chief Accounting Officer (August 2021 – present); Vice President, Corporate Controller & Chief Accounting Officer (April 2020 – August 2021); and Director, Accounting & Reporting (August 2015 – April 2020). |
All executive officers serve at the pleasure of the Board. There are no arrangements or understandings between any executive officer and any other person pursuant to which an executive officer was selected to be an officer of the Company. Celso Goncalves, our Executive Vice President, Chief Financial Officer, is the son of Lourenco Goncalves, our Chairman, President and Chief Executive Officer. There is no other family relationship between any of our executive officers or between any of our executive officers and any of our directors.
An investment in our common shares or other securities is subject to risks inherent in our businesses and the industries in which we operate. We describe below certain risks and uncertainties, the occurrences of which could have a material adverse effect on us. The risks and uncertainties described below include known material risks that we face currently, but our material risks are continually evolving, and the below descriptions may not include future risks that are not presently known, risks that are not currently believed to be material or risks that generally apply to most businesses. Although we have extensive risk management policies, practices and procedures in place that are aimed at mitigating these risks, the occurrence of these uncertainties may nevertheless impair our business operations and adversely affect the actual outcome of matters as to which forward-looking statements are made. This report is qualified in its entirety by these risk factors. Before making an investment decision, investors should carefully consider all the risks described below together with the other information included in this report and the other reports we file with the SEC.
Management has identified several categories of material risks that we are subject to, including: (I) economic and market; (II) regulatory; (III) financial; (IV) operational; (V) sustainability and development; and (VI) human capital. Although we have organized the risks by these headings and we have discussed each risk separately, many of the risks are interrelated.
I. ECONOMIC AND MARKET RISKS
The volatility of commodity prices, including steel, scrap metal and iron ore, directly and indirectly affects our ability to generate revenue, maintain stable cash flows and fund our operations.
Our profitability is dependent upon the historically volatile market prices of steel, scrap metal and iron ore. We experience direct impacts of steel price fluctuations through customer sales, as well as direct and indirect impacts of scrap metal and iron ore price fluctuations through third-party sales and the impacts that movements in scrap metal and iron ore prices have on steel prices. As described elsewhere in this report, the prices of steel, scrap metal and iron ore have fluctuated significantly in the recent past, and these pricing shifts are unpredictable and affected by factors beyond our control, including: international demand for, and the impact of higher rates of inflation on, raw materials used in steel production; availability of scrap metal substitutes such as pig iron; commodity price speculation; rates of global economic growth, especially construction and infrastructure activity that requires significant amounts of steel; changes in the levels of economic activity in the U.S., China, India, Europe and other industrialized or developing economies, including as a result of geopolitical conflicts or otherwise; changes in China’s emissions policies and environmental compliance enforcement practices; changes in the production capacity, production rate and inventory levels of other steel producers, distributors, iron ore suppliers and scrap metal processors and traders; changes in trade laws; volumes of unfairly traded imports; imposition or termination of duties or tariffs, including tariffs and retaliatory tariffs that have recently been and may in the future be instituted following the recent change in U.S. presidential administrations, which among other things may affect our cross-border shipments, import and export controls, and other trade barriers impacting the steel and iron ore markets; climate change and other weather-related disruptions, infectious disease outbreaks or natural disasters that may impact the global supply of steel, scrap metal or iron ore; and the proximity, capacity and cost of infrastructure and transportation.
Our revenues, therefore, vary in accordance with the prices of the products we sell. During 2024, for example, we experienced lower average selling prices for our steel products as compared to 2023 due to the impact from lower index pricing, which resulted in lower revenues. In addition, we had lower sales volumes in 2024, which also contributed to lower revenues. To the extent that commodity prices, including the HRC price, coated and other specialty steel prices, international steel prices and scrap metal prices, significantly decline for an extended period, we may have to further revise our operating plans, including curtailing production, reducing operating costs and deferring capital expenditures. As a result, we also may have to record impairments on our goodwill, intangible assets, long-lived assets and/or inventory. Sustained lower prices also could cause us to further reduce existing mineral reserves if certain reserves can no longer be economically mined or processed at prevailing prices. Particularly during periods of increased inflation resulting in higher input costs, we may be unable to decrease our costs in an amount sufficient to offset reductions in revenues and may incur losses. These events could have a material adverse effect on us.
We sell a significant portion of our steel products to the automotive market, and fluctuations or changes in the automotive market could adversely affect our business operations and financial performance.
The largest end user for our steel products is the automotive industry in North America. Beyond these direct sales to the automotive industry, we make additional sales to distributors and converters, which may ultimately resell some of that volume to the automotive market. In addition to the magnitude of our exposure to the automotive industry, we face risks arising from our relative concentration of sales to certain specific automotive manufacturers, and our sales volumes and revenues may be adversely affected if we are unable to renew our fixed price contracts with one or more significant automotive customers or if those customers choose to move certain portions of their parts business to alternate suppliers. Automotive production and sales are cyclical and sensitive to general economic conditions and other factors, including interest rates, consumer credit, spending and preferences, and supply chain disruptions. If automotive production and sales decline, whether due to consumers facing reduced purchasing power caused by inflation, higher interest rates or otherwise, our sales and shipments to the automotive market are likely to decline in a corresponding manner. Adverse impacts that we may sustain as a result include, without limitation, lower margins because of the need to sell our steel to less profitable customers and markets, higher fixed costs from lower steel production if we are unable to sell the same amount of steel to other customers and markets, and lower sales, shipments, pricing and margins generally as our competitors face similar challenges and compete vigorously in other markets that we serve. These adverse impacts could negatively affect our revenues, financial results and cash flows.
Moreover, despite our position as a leading North America-based flat-rolled steel producer, competition for automotive business has intensified in recent years, as steel producers and companies producing alternative materials have focused their efforts on capturing and/or expanding their market share of automotive business because of less favorable conditions in other markets for steel and other metals, including commodity products. As a result, the potential exists that we may lose market share to existing or new entrants or that automotive manufacturers will take advantage of the intense competition among potential suppliers during periodic contract renewal negotiations to pressure our pricing and margins in order for us to maintain or expand our market share with them, which could negatively affect our revenues, financial results and cash flows.
Global steelmaking overcapacity and overproduction, steel imports, and oversupply of iron ore could lead to lower or more volatile global steel and iron ore prices, directly or indirectly impacting our profitability.
Significant existing global steel capacity and new or expanded production capacity in recent years could potentially cause capacity to exceed demand globally. Although certain American steel producers have shut down production capacity, certain of our competitors have announced and are moving ahead with plans to develop new steelmaking capacity in the near term. In addition, certain foreign competitors, which may have cost advantages due to being owned, controlled or subsidized by foreign governments, have substantially increased their steelmaking capacity and/or production in the last few years and in some instances appear to have targeted the U.S. market for imports. The risk of even greater levels of imports may continue, depending upon foreign market and economic conditions, changes in trade agreements and treaties, laws, regulations or government policies affecting trade, the ability of foreign producers to circumvent U.S. trade sanctions and policy (including in the markets for electrical steels), the value of the U.S. dollar relative to other currencies and other variables beyond our control. In addition, higher sustained market prices of steel and iron ore products could cause new producers to enter the market or existing producers to further expand productive capacity, which could in turn lead to lower steel prices and increasing prices of steelmaking inputs, such as scrap metal. Excess steel and iron ore supply combined with reduced global steel demand and increased imports could also lead to lower steel and iron ore prices. Downward pressure on steel and/or iron ore prices could have an adverse effect on our results of operations, financial condition and profitability.
Severe financial hardship or bankruptcy of one or more of our major customers or key vendors could adversely affect our business operations and financial performance.
Sales and operations for a majority of our customers are sensitive to general economic conditions in the North American automotive, housing, construction, appliance, energy, defense and other industries. Some of our customers are highly leveraged. If there is a sustained weakening of current economic conditions, whether because of operational, cyclical, supply chain or other issues, including inflationary pressures, higher interest rates or an infectious disease outbreak, it could cause customers to reduce, delay or cancel their orders with us, impact significantly the creditworthiness of our customers, and lead to other financial difficulties or even bankruptcy filings by our customers. Failure to receive payment from our customers for products that we have delivered could adversely affect our results of operations, financial condition and liquidity. The concentration of customers in a specific industry, such as the automotive industry, may increase our risk because of the likelihood that circumstances may affect multiple customers at the same time. Such events could cause us to experience lost sales or losses associated with the potential inability to collect all outstanding accounts receivable as well as reduced liquidity. Similarly, certain of our key vendors have recently suffered, and from time to time may continue to suffer, financial hardship, including bankruptcy. Such vendors could face operational disruption or even be forced to liquidate, which could result in such vendors defaulting on their obligations to us or in our inability to secure replacement materials or services on a timely basis, or at all, or cause us to incur increased costs to do so. Such events could adversely impact our continuity of operations, financial results and cash flows.
II. REGULATORY RISKS
U.S. government actions and other countries’ reactions in respect of trade agreements and treaties, laws, regulations, or policies affecting trade could lead to lower or more volatile global steel prices, impacting our profitability.
In recent years, the U.S. government has altered its approach to international trade policy, both generally and with respect to matters directly and indirectly affecting the steel industry, including by undertaking certain unilateral actions affecting trade, renegotiating existing bilateral or multilateral trade agreements, and entering into new agreements or treaties with foreign countries. For example, in March 2018, the U.S. government issued a proclamation pursuant to Section 232 imposing a 25% tariff on imported steel. These Section 232 tariffs were imposed on national security grounds and addressed imported steel that was being unfairly traded by certain foreign competitors at artificially low prices. In retaliation against the Section 232 tariffs, the European Union subsequently imposed its own tariffs against certain steel products and other goods imported from the U.S. Following the November 2020 U.S. presidential election, negotiations between the U.S. government and other governments resulted in revisions to these measures. For example, the U.S. government agreed to modified tariff rate quota systems with each of the European Union, Japan and the United Kingdom that allowed more imports from those trading partners to enter the U.S. market free of Section 232 tariffs. However, in early 2025, the U.S. government announced that the 25% Section 232 tariffs on steel imports would be re-imposed without exemptions and exclusions, beginning in March 2025. Even so, as has occurred in the past, the U.S. government may later determine to negotiate exemptions and exclusions from Section 232 tariffs with certain trading partners. And if the Section 232 measures are removed, modified or substantially weakened, whether through legal challenge, legislation, further executive action or otherwise, imports of foreign steel would likely increase and steel prices in the U.S. would likely fall, which could materially adversely affect our revenues, financial results and cash flows.
In addition, during 2020, the USMCA was implemented among the U.S., Mexico and Canada in place of the North American Free Trade Agreement. Because all our steel manufacturing facilities are located in North America and one of our principal markets is automotive manufacturing in North America, we believe that the USMCA has the potential to positively impact our business by incentivizing automakers and other manufacturers to increase manufacturing production in North America and to use North American steel. However, it is difficult to predict the implications of changes in trade policy and, therefore, whether the USMCA or other new or renegotiated trade agreements, treaties, laws, regulations or policies that may be implemented by the U.S. government, or otherwise, will have a beneficial or detrimental impact on our business and our customers’ and suppliers’ businesses. Adverse effects could occur directly from a disruption to trade and commercial transactions and/or indirectly by adversely affecting the U.S. economy or certain sectors of the economy, impacting demand for our customers’ products and, in turn, negatively affecting demand for our products. Important links of the supply chain for some of our key customers, including automotive manufacturers, could be negatively impacted by the USMCA or other new or renegotiated trade agreements, treaties, laws, regulations or policies.
While we may currently benefit from certain antidumping and countervailing duty orders, any such relief is subject to periodic reviews and challenges, which can result in revocation or modification of the orders or reduction of the duties. Currently, there are ongoing antidumping and countervailing duty investigations involving imports of corrosion-resistant steel into the U.S. from various countries, including Canada, Mexico, Brazil, Australia, the Netherlands, South Korea, Taiwan, Turkey, Vietnam and the United Arab Emirates. The outcomes of those investigations are uncertain and could adversely affect the competitiveness and viability of our U.S. and/or Canadian corrosion-resistant steel businesses. Following the recent change in U.S. presidential administrations, the U.S. government may seek to alter the USMCA and has imposed and may in the future impose new or additional tariffs on goods imported into the U.S. (including steel or critical production inputs), which has led to and could in the future lead to other countries imposing or threatening to impose retaliatory tariffs on exports of American-made products (including steel) to those countries or other retaliatory efforts, such as restricting exports of critical production inputs to the U.S. In addition, previously granted petitions for trade relief may not be successful or fully effective at preventing harm from subsidized and dumped imports into the U.S. Any of these actions and their direct and indirect impacts could materially adversely affect our revenues, financial results and cash flows.
We are subject to extensive governmental regulation, which imposes potentially significant costs and liabilities on us. Future laws and regulations or the way they are interpreted and enforced could increase these costs and liabilities or limit our ability to produce our raw materials and products.
New laws or regulations, or changes in existing laws or regulations, or the manner of their interpretation or enforcement, could increase our cost of doing business and restrict our ability to operate our businesses or execute our strategies. This includes, among other things:
•changes in, and enforcement of, MSHA regulations, such as respirable silica standards and surface mobile equipment rules;
•evaluation of the National Ambient Air Quality Standards, such as revised nitrogen dioxide, sulfur dioxide, lead, ozone and particulate matter criteria;
•changes in the interpretation of OSHA regulations, such as standards for occupational exposure to noise, ergonomics, protection from chemicals or hazardous substances, infectious diseases, heat stress and potentially hazardous machinery; and
•changes in tax laws and regulations, including the possible taxation under U.S. or foreign country laws of certain income from worldwide operations.
Our operations are subject to various laws and regulations relating to protection of the environment and human health and safety, including those relating to:
•air quality, water quality and conservation;
•plant, wetlands, natural resources and wildlife protection (including endangered or threatened species);
•reclamation, remediation and restoration of properties and related surety bonds or other financial assurances;
•land use;
•the discharge of materials into the environment; and
•the effects that industrial operations and mining have on groundwater quality and availability, such as the potential effects of laws or regulations related to per-and polyfluoroalkyl substances (“PFAS”).
Despite implementation of rigorous environmental protocols and management systems, we cannot be certain that we have been or will be at all times in complete compliance with all such laws and regulations. If we violate or fail to comply with these laws or regulations, we could be fined, required to retrofit or cease operations, subject to criminal or civil liability, or otherwise sanctioned by regulators or barred from participating in government contracts. In addition, regulatory agencies have the authority to order a mine or production facility to be temporarily or permanently closed where imminent danger that could cause death or serious physical harm is perceived. Compliance with the complex and extensive laws and regulations to which we are subject imposes substantial costs on us, which could increase over time because of heightened regulatory oversight, adoption of more stringent environmental, health and safety standards and greater demand for remediation services leading to shortages of equipment, supplies and labor, as well as other factors.
Specifically, there are several notable proposed or recently enacted rulemakings or activities to which we would be subject or that would further regulate and/or tax us and our customers, which may also require us or our customers to reduce or otherwise change operations significantly or incur significant additional costs, potentially limiting our ability to produce our raw materials and products, depending on their ultimate outcome. These emerging or recently enacted rules, regulations and policy guidance include, but are not limited to:
•trade regulations, trade agreements, treaties or related policies;
•changes in tariff policy, including with respect to the 25% tariff on certain imported steel imposed under Section 232, and including the new or additional tariffs recently imposed by the U.S. government on Canada, China and Mexico and the retaliatory tariffs that have already been, or may in the future be, imposed in response to such tariffs;
•revised National Emission Standards for Hazardous Air Pollutants in the taconite, integrated iron and steel, and coke sectors;
•climate change mitigation strategies and GHG regulation;
•selenium discharge regulation;
•revisions to the sulfate wild rice water quality standard and its implementation;
•Minnesota’s Mercury TMDL;
•ozone transport regulations;
•state agency decisions related to environmental justice initiatives;
•reduction of SO2 levels at steel plants in Canada;
•revised National Ambient Air Quality Standards, particularly for particulate matter; and
•additional regulations regarding PFAS.
We similarly expect some state governments to continue to propose more stringent environmental regulation, in particular related to climate change. Any new or more stringent legislation, regulations, rules, interpretations or orders, when enacted and enforced, including any related to required monitoring and reporting or reductions in, or taxes on, levels of carbon emissions, could have a material adverse effect on our business, results of operations, financial condition or profitability. In addition, judicial decisions or executive actions limiting the authority of regulatory agencies, or impacting current regulations and policies implemented by such agencies, could create uncertainty regarding the regulatory landscape and impact our ability to operate our existing business and plan for future investments.
Our operations may be impacted by the recent enactment, and ongoing consideration, of significant federal and state laws and regulations relating to certain mine-related issues, such as the stability of tailings basins, mine drainage and fill activities, reclamation and safety in underground and surface mines. Additionally, there are requirements for the prompt reporting of accidents and increased fines and penalties for violations of these laws and regulations. Enforcement of existing mine-related laws and regulations, as well as enactment of any new such laws or regulations, may cause us to incur substantial additional compliance costs and fines and penalties for any violations.
In addition, certain of our operations are subject to the risks of doing business abroad and we must comply with complex foreign and U.S. laws and regulations, which may include, but are not limited to, the Foreign Corrupt Practices Act and other anti-bribery laws, regulations related to import/export and trade controls, the European Union’s General Data Protection Regulation and other U.S. and foreign privacy regulations, and transportation and logistics regulations. These laws and regulations may increase our costs of doing business in international jurisdictions and expose our operations and employees to elevated risk. We require our employees, contractors and agents to comply with these and all other applicable laws and regulations, but failure to do so could result in possible administrative, civil or criminal liability and reputational harm to us and our employees.
As a supplier on public procurement projects, including projects that may arise out of proposed or recently enacted governmental legislation regarding infrastructure investments such as the Infrastructure Investment and Jobs Act of 2021, we may be subject to certain stringent regulations that may present compliance challenges or may increase the costs of securing certain business. For example, in order to remain eligible for DOE funding, our major Butler and Middletown capital projects are subject to extensive U.S. government and DOE-specific regulations with which we must comply, including with respect to restrictions related to the use of foreign contractors and workers. Also, the U.S. government has rights to, and imposes restrictions on, intellectual property from the projects. The additional burdens and restrictions imposed by these regulations increase our costs, may limit our operational and contracting flexibility, and may disincentivize certain technology providers or other vendors from working with us. We may also be indirectly affected through regulatory changes that impact our customers, which in turn could reduce the quantity of our products they demand, adversely impact the terms upon which they purchase or the prices for our products they are willing to pay. Regulatory changes that impact our suppliers, such as any changes in labor or environmental standards in China, could decrease the availability of products or services they sell to us or could increase the price they demand for products or services they sell to us.
Our operations use hazardous materials and inadvertently may impact the environment, which could result in material liabilities to us.
Our operations currently use, and have in the past used, hazardous materials and substances, and we have generated, and expect to continue to generate, solid and hazardous waste. We have been, and may in the future be, subject to claims under laws and regulations for toxic torts, natural resource damages and other damages as well as for the investigation and clean-up of soil, surface water, sediments, groundwater and other natural resources and reclamation of properties. Such claims for damages, as well as investigation, remediation and reclamation requirements, have arisen and may arise in the future out of current, future or former conditions at sites that we or our acquired companies own, lease or operate, as well as sites that we or our acquired companies formerly owned, leased or operated, and at contaminated sites that are or have been owned, leased or operated by our joint venture partners. We may also have liability for contamination at third-party sites where we have sent hazardous wastes. Our liability for these claims may be strict and/or joint and several, such that we may be held responsible for more than our share of the contamination or other damages, or even for entire claims regardless of fault. We may be named as a potentially responsible party at other third-party sites in the future, and we cannot be certain that the costs associated with these additional sites will not exceed any reserves we have established or otherwise be material.
We may be unable to obtain, maintain, renew or comply with permits and licenses necessary for our operations or be required to provide additional financial assurances, which could reduce our production, cash flows, profitability and available liquidity.
We must obtain, maintain and comply with numerous permits and licenses that require approval of operational plans and impose strict conditions on various environmental, health and safety matters in connection with our steel production and processing and mining and other operations. These include permits and approvals issued by various agencies and regulatory bodies, with which we may not always be able to comply. The permitting rules are complex and may change over time, making our ability to comply with the applicable requirements more difficult or potentially impractical and costly, possibly precluding the continuance of ongoing operations or the development of future operations. Interpretations of rules may also change over time and may lead to requirements, such as additional financial assurances, making it costlier to comply. Moreover, despite our ongoing efforts to reduce our environmental footprint and improve the resiliency of our business model, heightened levels of regulatory oversight focused on addressing climate change and industrial activities that generate GHG emissions, such as our steelmaking, cokemaking and mining operations, could impact, delay, or disrupt our ability to obtain new or renewed permits or modifications to existing permits.
In addition, the public, including special interest groups, Tribal nations and individuals, have certain rights under various laws and burgeoning environmental justice policies to comment upon, submit objections to, and otherwise engage in the permitting process, including bringing citizens’ lawsuits to challenge such permits or activities. For example, we have encountered and expect to continue to encounter public objections to permit renewal applications relating to our major steelmaking facilities. Due to these factors or for other reasons, required permits may not be issued or renewed in a timely fashion or at all, or permits issued or renewed may include conditions that we cannot meet, may require additional capital investments, or may restrict our ability to conduct our production, mining and processing activities efficiently. Such conditions could include requirements for additional financial assurances that we may not be able to provide on commercially reasonable terms or at all, which could reduce available borrowing capacity under our ABL Facility. Such conditions, restrictions or requirements could also reduce our production, cash flows or profitability.
III. FINANCIAL RISKS
Our existing and future indebtedness may limit cash flow available to invest in the ongoing needs of our businesses, which could prevent us from fulfilling our obligations under our senior notes, ABL Facility and other debt, and we may be forced to take other actions to satisfy our obligations under our debt, which may not be successful.
As of December 31, 2024, we had $7.1 billion aggregate principal amount of long-term debt outstanding (excluding $62 million of outstanding letters of credit and $382 million of finance leases) and $54 million of cash on our statement of consolidated financial position. As of December 31, 2024, we had $5.6 billion aggregate principal amount of our senior notes and $1.6 billion aggregate borrowings under our ABL Facility outstanding. Our aggregate amount of outstanding debt has increased year-over-year due primarily to additional debt we incurred and/or assumed in connection with completing the Stelco Acquisition during the fourth quarter of 2024. The aggregate principal amount of revolver commitments under our ABL Facility is $4.75 billion, comprised of $4.25 billion of lending commitments available to be borrowed by us and certain of our U.S. subsidiaries, and $500 million of lending commitments available to be borrowed by certain of our Canadian subsidiaries. As of December 31, 2024, the aggregate borrowing availability under our ABL Facility was $2.5 billion based on outstanding letters of credit obligations and our borrowing base.
A portion of our cash flow from operations is used to service debt under our senior notes and ABL Facility, reducing the availability of cash to fund capital expenditures, acquisitions or strategic development initiatives, and other general corporate purposes or to retire debt or return capital to shareholders, including via share repurchases. Although it is uncertain whether the U.S. Federal Reserve will lower, maintain or raise interest rates during 2025 and beyond, higher rates would increase the amount of cash we would need to allocate to servicing the interest expense on our debt for so long as we have an outstanding balance drawn under our ABL Facility.
Our ability to make scheduled payments on the principal, premium, if any, and interest on our debt, or to refinance our debt obligations, depends on our ability to generate cash in the future and our financial condition and operating performance, which are subject to prevailing economic and competitive conditions and to certain financial, business and other factors beyond our control, as described elsewhere in this “Risk Factors” section. If we are unable to service our debt obligations, we could face substantial liquidity problems and we may be forced to reduce or delay investments, capital expenditures and share repurchases, or to sell assets, seek additional capital, including additional secured or unsecured debt, or restructure or refinance our debt, and we may be unable to continue as a going concern. We may be unable to consummate any proposed asset sales or recover the carrying value of these assets, and any proceeds may not be adequate to meet any debt service obligations then due. Any of these examples potentially could have a material adverse impact on our results of operations, profitability, shareholders’ equity and capital structure. In addition, a failure to comply with any applicable covenants in the instruments governing our debt could result in an event of default that, if not cured or waived, would have a material adverse effect on us.
Our level of indebtedness could have further consequences, including, but not limited to, increasing our vulnerability to adverse economic or industry conditions, placing us at a competitive disadvantage compared to other businesses in the industries in which we operate that are not as leveraged and that may be better positioned to withstand economic downturns and recessionary environments, limiting our flexibility to plan for, or react to, changes in our businesses and the industries in which we operate, and requiring us to refinance all or a portion of our existing debt. We may not be able to refinance on commercially reasonable terms or at all, and any refinancing of our debt could be at higher interest rates and may require us to comply with more onerous covenants, making it more difficult to obtain surety bonds, letters of credit or other financial assurances that may be demanded by our vendors or regulatory agencies, particularly during periods in which credit markets are weak. In addition, our cost of financing or refinancing, access to the capital markets, and the terms under which we purchase goods and services could be adversely affected if credit ratings agencies downgrade our ratings, whether due to factors specific to our business or debt profile, a prolonged cyclical downturn in the steel, scrap metal and mining industries or macroeconomic trends (such as global or regional recessions), increases in pension and OPEB obligations, adverse impacts of inflation and high interest rates, or trends in credit and capital markets more generally. A portion of our borrowing capacity and any outstanding indebtedness under our ABL Facility bears interest at a variable rate based on SOFR. To the extent these interest rates increase, our interest expense will increase. Restricted access to capital markets and/or increased borrowing costs could have an adverse effect on our results of operations, cash flows, financial condition and liquidity.
Our actual operating results may differ significantly from our guidance.
From time to time, we release guidance, including that set forth under “Management’s Discussion and Analysis of Financial Condition and Results of Operations–Outlook” in our Annual Reports on Form 10-K and our Quarterly Reports on Form 10-Q, regarding our future performance. This guidance, which consists of forward-looking statements, is prepared by our management and is qualified by, and subject to, the assumptions and the other information included in our Annual Reports on Form 10-K and our Quarterly Reports on Form 10-Q. Our guidance is not prepared with a view toward compliance with published guidelines of the American Institute of Certified Public Accountants, and neither our independent registered public accounting firm nor any other independent or outside party compiles or examines the guidance and, accordingly, no such person expresses any opinion or any other form of assurance with respect thereto.
Guidance is based upon a number of assumptions and estimates that, while presented with numerical specificity, are inherently subject to business, economic, regulatory and competitive uncertainties and contingencies, many of which are beyond our control and are based upon specific assumptions with respect to future business decisions, some of which will change. The principal reason that we release such data is to provide a basis for our management to discuss our business outlook with analysts and investors. We do not accept any responsibility for any projections or reports published by any such third parties.
Guidance is necessarily speculative in nature, and it can be expected that some or all the assumptions of the guidance furnished by us will not materialize or will vary significantly from actual results. Accordingly, our guidance is only an estimate of what management believes is realizable as of the date of release. Actual results will vary from the guidance. Investors should also recognize that the reliability of any forecasted financial data diminishes the further in the future that the data are forecast. Considering the foregoing, investors are urged to put the guidance in context and not to place undue reliance on it. Any failure to successfully implement our operating strategy or the occurrence of any of the risks described in our Annual Reports on Form 10-K or our Quarterly Reports on Form 10-Q could cause actual operating results to differ from the guidance, and such differences may be adverse and material.
We may be subject to various lawsuits, claims, arbitrations or governmental proceedings that could result in significant expenditures.
We are from time to time subject to various lawsuits, claims, arbitrations or governmental proceedings relating to commercial and business disputes, antitrust claims, environmental matters, government investigations, occupational or personal injury claims, property damage, labor and employment matters, or suits involving legacy operations and other matters. For example, certain of our subsidiaries have been named in lawsuits claiming exposure to asbestos, many of which have been dismissed and/or settled for non-material amounts. Nevertheless, it is likely that similar types of claims will continue to be filed in the future, and we could experience material adverse judgments or incur significant costs to defend such claims or any other existing and future lawsuits, claims, arbitrations or governmental proceedings, including those discussed in Part I - Item 3. Legal Proceedings, which could adversely affect our results of operations, cash flows, financial condition and liquidity. The insurance we maintain may not cover certain claims and, even when coverage applies, it may not be adequate to protect us in the event of significant claims.
IV. OPERATIONAL RISKS
Our operating expenses could increase significantly if the prices of raw materials, electrical power, fuel or other energy sources increase.
Our operations require significant use of energy, water and raw materials. Although we are largely self-sufficient in iron ore and partially self-sufficient in coke, metallurgical coal and scrap metal, we are wholly or partially dependent on third-party suppliers for certain critical raw materials and production inputs, including industrial gases, graphite electrodes, chrome, zinc, coke, metallurgical coal, scrap metal, fluxing compounds and other alloys. Prices for electricity, natural gas, diesel fuel, oils and raw materials can fluctuate widely with availability and demand levels from other users, including fluctuations caused by the impact of inflationary pressures, supply chain constraints, infectious disease outbreaks and geopolitical conflicts. For example, increased electricity demand to the grid in response to physical climate-related risks, adverse or extreme weather events and electrification of the economy could adversely impact energy prices. During periods of peak usage, although some operations have contractual arrangements in place whereby they receive certain offsetting payments in exchange for electricity load reduction, supplies of energy and raw materials in general may be curtailed and we may not be able to purchase them at historical rates. A disruption in the transmission of energy, inadequate energy transmission infrastructure, or the termination of any of our energy supply contracts could interrupt our energy supply and adversely affect our operations. While we have some long-term contracts with electrical, natural gas and raw material suppliers, we are exposed to fluctuations in energy, natural gas and raw material costs that can affect our production costs. We regularly enter into market-based pricing supply contracts for electricity, natural gas and diesel fuel for use in our operations. Those contracts expose us to price increases in energy costs, which could cause our profitability to decrease significantly. In addition, U.S. public utilities may impose rate increases and/or pass through additional capital and operating cost increases to their customers related to new or pending U.S. environmental regulations or other charges that may require significant capital investment and/or use of cleaner fuels in the future. New or revised regulations or other government actions related to GHG emissions standards could result in rate and/or cost increases from U.S. public utilities, which could significantly increase the costs of operating our manufacturing and mining facilities. Although we regularly monitor and from time to time challenge rate cases initiated by these utilities or other sources seeking to increase the amounts that our facilities must pay for electricity, natural gas or water, there is no assurance that our challenges will be successful in reducing or eliminating proposed rate and/or cost increases.
The majority of our steel shipments are sold under contracts that do not allow us to pass through all increases in raw materials, supplies and energy costs. Some of our customer contracts include variable-pricing or surcharge mechanisms allowing us to adjust the total sales price based on changes in specified raw materials, supplies and energy costs. Those adjustments, however, rarely reflect all our underlying raw materials, supplies and energy cost changes. The scope of the adjustment may also be limited by the terms of the negotiated language, including limitations on when and to what extent the adjustment occurs. Further, due to recent inflationary pressures, many of our vendors have been seeking substantial price increases in order to continue providing critical goods and services, and to the extent we are required to pay relatively more for our steelmaking inputs and are unable to recognize corresponding sales price increases, we would realize lower margins on sales of our products, negatively impacting our results of operations. Our need to consume existing inventories may also delay the impact of a change in prices of raw materials or supplies. Significant changes in raw material costs may also increase the potential for inventory value write-downs in the event of a reduction in selling prices and our inability to realize the cost of the inventory. As we source a portion of our critical supplies, manufacturing equipment and raw materials from China, such as refractories, electrodes, chemicals and spare parts, existing tensions or further adverse geopolitical developments between the U.S. and China triggering or exacerbating sanctions or trading restrictions could lead to us experiencing disruptions, delays or higher costs in supplying our operations and maintaining steady-state production. In addition, even though we are partially self-sufficient in scrap metal, if the market price of scrap metal were to experience a sustained price increase, our cost to produce steel would be adversely affected due to the higher prices we would need to pay to acquire third-party scrap metal for consumption in our operations, which would adversely affect the margins we would realize on our fixed price contracts.
Our sales and competitive position depend on transporting our products to customers at competitive rates and in a timely manner, and our ability to optimize our operational footprint depends on predictably and cost effectively moving products and raw materials internally among our facilities.
Disruption of the rail, trucking, lake and other waterway transportation services because of weather-related problems, including ice and winter weather conditions on the Great Lakes or St. Lawrence Seaway, climate change, strikes, lock-outs, driver shortages and other disruptions in the trucking industry, train crew shortages or other rail network constraints, infectious disease outbreaks, or other events and lack of alternative transportation options could impair our ability to move products internally among our facilities and to supply products to our customers at competitive rates or in a timely manner and, thus, could adversely affect our operations, revenues, margins and profitability. For example, if the vessel shipping season on the Great Lakes were to be interrupted or shortened as compared to historical levels, whether due to extended winter conditions, operational failure of critical shipping locks or otherwise, our ability to transport iron ore pellets to our steel mills could be adversely affected, resulting in potential operational disruptions and reduced production volumes. Further, dredging issues and environmental changes, particularly at Great Lakes ports or along navigable rivers, could adversely impact our ability to move certain of our products or result in higher freight rates. Similarly, we depend on third-party transportation services for delivery of raw materials and other production inputs to us, and failures or delays in delivery would have an adverse effect on our ability to maintain steady-state production and processing operations to meet customer obligations.
The cost or time to implement a strategic or sustaining capital project may prove to be greater than originally anticipated.
Most of our mines and production and processing facilities have been in operation for several decades, and the equipment is aged, requiring that we continually and successfully implement extensive and costly maintenance practices, programs and upgrades, which may take longer or be more costly than expected. From time to time, we undertake capital projects to enhance, expand, maintain or upgrade our production, mining and processing capabilities. For example, we are engaged in major initiatives at each of our Butler and Middletown facilities to leverage DOE funding to complete capital projects intended to increase our competitiveness and reduce GHG emissions relating to our steelmaking operations. In addition, we are developing an electrical transformer production plant at our former Weirton tinplate facility. Our ability to complete these and other capital projects that we may undertake on time and on budget and achieve the anticipated production volumes, revenues or otherwise realize acceptable returns is subject to a number of risks, many of which are beyond our control, including a variety of market, operational, funding, permitting and labor-related factors. Further, the cost to implement any given capital project may prove to be greater or may take more time than originally anticipated, including due to supply chain issues that may be experienced by our vendors, and the scope of a capital project may expand or otherwise be modified. Capital projects undertaken at existing active operations, such as Butler and Middletown, may also interrupt production capabilities, which could have an adverse effect on costs and profitability. Inability to achieve the expected results from the implementation of our capital projects, incurring unanticipated costs or delays, or the inability to meet contractual obligations could adversely affect our results of operations, future earnings and cash flow generation.
Natural or human-caused disasters, weather conditions, disruption of energy, unanticipated geological conditions, equipment failures, infectious disease outbreaks and other unexpected events may lead our customers, our suppliers, or our facilities to curtail production or shut down operations.
Operating levels within our industry and the industries of our customers and suppliers are subject to unexpected conditions and events that are beyond the industries’ control. Those events, including the occurrence of an infectious disease outbreak, widespread illness or public health emergency, could cause industry members or their suppliers to curtail production or shut down a portion or all of their operations, which could reduce the demand for our products and adversely affect our revenues, margins and profitability.
Our operating levels are subject to conditions beyond our control that can delay deliveries or increase the cost of production for varying lengths of time. Factors that could cause production disruptions could include adverse weather conditions influenced by climate change or otherwise (such as severe winter weather, tornadoes, floods, temperature extremes and the lack of availability of process water due to drought) and natural and human-caused disasters, lack of adequate raw materials, energy or other supplies, and infectious disease outbreaks. Additional factors that could adversely impact production and operations at our mining facilities include tailings dam failures, pit wall failures or ground subsidence, unanticipated geological conditions, including variations in the amount of overburden overlying deposits of iron ore and metallurgical coal, and processing changes.
Our mining operations, processing facilities, logistics capabilities and steelmaking operations depend on critical pieces of equipment. This equipment may, on occasion, be out of service because of unanticipated failures or unplanned outages, including due to long lead times for replacement of critical spares. From time to time, we may experience lengthy shutdowns or periods of reduced production because of equipment failures or unplanned maintenance activities. Further, remediation of any interruption in production capability may require us to make large capital expenditures that could have a negative impact on our profitability and cash flows. Our business interruption insurance may not be available to cover lost revenues associated with maintenance difficulties or damage to or failures of equipment. Longer-term business disruptions could result in a loss of customers, which could adversely affect our future sales levels and revenues.
Many of our production facilities and mines are dependent on a sole source for electric power, natural gas, water, industrial gases and/or certain other raw materials or supplies. A significant interruption in service from our suppliers due to production or transportation issues, workforce difficulties, terrorism or sabotage, weather conditions that may be influenced by climate change, natural disasters, equipment damage or failure, or any other cause could result in substantial losses that may not be fully recoverable, either from our business interruption insurance or responsible third parties.
A disruption in or failure of our IT systems, including those related to cybersecurity, could adversely affect our business operations, reputation and financial performance and could expose us to third-party liability.
We rely on the availability, confidentiality, integrity and security of our IT systems for the operation of many of our business processes and to comply with regulatory, legal and tax requirements. While we maintain some of our critical IT systems, we are also dependent on third parties to provide important IT services relating to, among other things, off-site content hosting, operational process technology at our facilities, human resources, electronic communications and certain finance functions. Further, we operate certain IT hardware and software systems that can be supported only by a very limited number of specialists still remaining in the market with the required skill sets, and our continued reliance on these IT systems may increase the risk of IT system disruption or failure, which could adversely affect our operations.
Despite the security measures that we have implemented, including those related to cybersecurity and data privacy, our IT systems could be breached or damaged by computer viruses, ransomware, natural or human-caused incidents or disasters, or unauthorized physical or electronic access or intrusions, any of which could result in the loss, theft or corruption of sensitive or essential business or personal information and the inability to access or control our IT systems or information. Given our status as a critical supplier of steel to U.S. business and defense interests and the U.S. government’s broad support of Ukraine in defending against Russia’s invasion, we may be the target of malicious cyber activities sponsored by the Russian or Chinese governments or other state
actors like those described in threat advisories issued from time to time by the U.S. Cybersecurity & Infrastructure Security Agency. Cybersecurity threat actors also may attempt to exploit vulnerabilities through software, including software commonly used by companies in cloud-based services and bundled software. Though we have controls in place and regularly conduct employee training, we cannot provide assurance that a cybersecurity incident or cyberattack will not occur or cause damage or business interruption. Furthermore, despite our efforts to audit certain critical vendors’ information security controls, significant risk may remain with respect to security measures employed by third-party service providers, which may ultimately prove to be ineffective at countering threats.
Failures of our IT systems, whether caused maliciously or inadvertently, may result in the disruption of our business processes, or in the unauthorized release of sensitive, confidential, personally identifiable or otherwise protected information, or result in the corruption of data, or a cybersecurity incident, each of which could adversely affect our businesses. For example, cybersecurity vulnerabilities or other cybersecurity incidents could result in an interruption of the functionality of our automated manufacturing, operating, or health, safety and environmental systems, which, if compromised, could cease, threaten, delay or slow down our ability to produce or process steel or any of our other products for the duration of such interruption or lead to unanticipated health, safety or environmental incidents. This, in turn, could result in reputational harm and lead to litigation, including individual claims or class actions, commercial litigation, administrative, civil or criminal investigations or actions, regulatory intervention and sanctions or fines, investigation and remediation costs, and may adversely affect our employees, results of operations, financial condition and cash flows. In addition, any compromise of the security of our IT systems could result in a loss of confidence in our security measures or in the unauthorized release of third-party confidential information stored in our systems, which could subject us to litigation, regulatory investigations and negative publicity that could adversely affect our reputation and expose us to third-party liability. Our customers, suppliers and vendors may also access or store certain of our sensitive information on their IT systems, which, if breached, attacked or accessed by unauthorized persons, could likewise expose our sensitive information and adversely impact our businesses. Furthermore, as cybersecurity threats continue to evolve and may become more sophisticated, including in connection with the ongoing development of Artificial Intelligence, we may be required to incur significant costs and invest additional resources to protect against and, if required, remediate the damage caused by such disruptions or system failures in the future. The amount of insurance coverage we maintain and require our vendors to maintain may be inadequate to cover claims or liabilities resulting from cybersecurity incidents and attacks, and there is no guarantee that such coverage will continue to be available on commercially reasonable terms or at all.
The closure of an operating facility or mine entails substantial costs. If our assumptions underlying our accruals for closure costs prove to be inaccurate or we prematurely close one or more of our facilities or mines, our results of operations and financial condition would likely be adversely affected.
If faced with overcapacity in the market, regulatory challenges or other adverse conditions, we may seek to rationalize manufacturing and production assets through sales, temporary shutdowns, indefinite idles or facility closures. If we indefinitely idle or permanently close any of our facilities or mines, our production and revenues would be reduced unless we were able to increase production at our other facilities or mines in an offsetting amount, which may not be possible, and could result in customers responding negatively by taking current or future business away from us if we seek to transition production to a different facility. Alternatively, we could fail to meet customer specifications at the facilities to which products are transitioned, resulting in customer dissatisfaction or claims. To the extent an idled or closed facility formerly supplied critical inputs to our upstream production facilities, we may need to secure alternate sources for such critical inputs, the cost and availability of which may be uncertain. For example, during 2024, we indefinitely idled our Weirton, West Virginia tinplate production facility, which caused us to recognize costs of approximately $210 million in respect of employee-related costs, asset impairments and exit costs.
The closure of a steelmaking or other operating facility or mining operation involves significant closure costs, including reclamation and other environmental costs, the costs of terminating long-term obligations, including customer, energy and transportation contracts and equipment and real property leases, costs associated with the altered tax profile of an idled or closed facility, and certain accounting charges, including asset impairment and accelerated depreciation. In addition, a permanent facility or mine closure could accelerate and significantly increase employment legacy costs, including our expense and funding costs for pension and OPEB obligations and multiemployer pension withdrawal liabilities. For example, employees could be eligible for immediate retirement under special eligibility rules that apply upon a steelmaking facility or mine closure. The employees eligible for immediate retirement under the pension plans at the time of the permanent closure also could be eligible for OPEB, thereby accelerating our obligation to provide these benefits. Certain closures could precipitate a pension closure liability significantly greater than an ongoing operation liability and may trigger certain severance liability obligations. In addition, we are party to several joint ventures relating to iron ore mining, downstream steel processing and scrap metal recycling, and if our joint venture partners experience financial hardships or fail to perform their obligations upon closure, we may be required to assume significant additional obligations on behalf of the joint venture, including costs of environmental remediation and pension and OPEB obligations.
Although we base our assumptions regarding the life of our mines on detailed studies we perform from time to time, which are reviewed and validated by QPs, those studies and assumptions are subject to uncertainties and estimates that may not be accurate. We recognize the costs of reclaiming open pits, stockpiles, tailings ponds, roads and other mining support areas based on the estimated mining life of our properties. If our assumptions underlying our accruals for closure costs, including reclamation and other environmental costs, prove to be inaccurate or insufficient, or our liability in any particular year is greater than currently anticipated, our results of operations and financial condition could be adversely affected. In addition, if we were to significantly reduce the estimated life of any of our mines, the mine closure costs would be applied to a shorter period of production, which would increase costs per ton produced and could adversely affect our results of operations and financial condition.
We incur certain costs when production capacity is idled, as well as increased costs to resume production at previously idled facilities.
Our decisions concerning which facilities to operate and at what production levels are made based in part upon our customers’ orders for products, as well as the quality, performance capabilities and cost of our operations. During depressed market conditions, we may concentrate production at certain facilities and not operate others in response to customer demand or other reasons, and as a result we may incur idle costs that could offset our anticipated savings from not operating the idled facility. For example, due to increased scrap usage and less demand for iron ore pellets in our steelmaking operations, our Northshore mining and pelletizing facility was temporarily idled during portions of 2022 and 2023, and we incurred certain fixed costs at that facility during the idle periods. We cannot predict whether our operations will experience additional similar or dissimilar disruptions in the future. When we restart idled facilities, we incur certain costs to replenish inventories, prepare the previously idled facilities for operation, perform the required repair and maintenance activities, and prepare employees to return to work safely and resume production responsibilities. The amount of any such costs could be significant, depending on a variety of factors, such as the period of idle time, necessary repairs and available employees, and is difficult to project.
We face ongoing risks relating to the recent Stelco Acquisition.
During the fourth quarter of 2024, we completed the Stelco Acquisition. The Stelco Acquisition may be less accretive than expected, or may be dilutive, to our earnings per share, which could cause the price of our common shares to decline. In addition, the Stelco Acquisition involves significant risks and uncertainties that may adversely affect us over the short, medium and long terms, including the following:
•we may be unable to realize anticipated synergies or other expected benefits or cost savings from the Stelco Acquisition;
•additional debt incurred or assumed in connection with the Stelco Acquisition could limit our financial flexibility;
•we have assumed additional environmental liabilities, commitments, contingencies, and remediation and reclamation projects relating to Stelco, including the obligation to pay taxes on Stelco’s GHG emissions and the potential requirement to implement desulfurization capabilities at Stelco’s operations;
•potential impairment of recorded tangible and intangible asset values for Stelco, including goodwill, could result in material non-cash charges to our results of operations in the future;
•we face challenges associated with managing international cokemaking, steelmaking and finishing operations, including complying with existing and emerging Canadian regulatory requirements, as well as other risks of operating in multiple countries, such as fluctuations in currency exchange rates, potentially adverse tax consequences due to overlapping or differing tax structures, burdens to comply with multiple and potentially conflicting foreign laws and regulations, including with respect to import or export controls, tariffs, duties and other trade barriers;
•we may be unable to satisfy our operational, employment, environmental or other undertakings or commitments made to the Canadian government in connection with the Stelco Acquisition;
•exposure to unknown liabilities and unforeseen costs relating to Stelco that were not disclosed to us or discovered during due diligence could adversely affect our results of operations;
•the potential loss of key employees, suppliers, customers or other business partners of Stelco could adversely affect our operating and financial performance; and
•tariffs imposed by the U.S. government on Canadian products could effectively increase the price of any steel products that Stelco seeks to sell into the U.S., and retaliatory tariffs imposed by the Canadian government on U.S. products could effectively increase the cost of any production inputs that Stelco sources from U.S. suppliers, either of which could adversely affect Stelco's results of operations to the extent it is required to bear any such increases.
If one or more of these risks and uncertainties were to materialize, we could experience reduced revenues, higher costs, lower profitability and other adverse impacts to our operations and businesses.
We may not have adequate insurance coverage for some business risks.
Our operations are generally subject to a number of hazards and risks that could result in personal injury or damage to, or destruction of, equipment, properties or facilities. Depending on the nature and extent of a loss, the insurance that we maintain to address risks that are typical in our businesses may not be adequate or available to fully protect or reimburse us, or our insurance coverage may be limited, canceled or otherwise terminated. Insurance against some risks, such as liabilities for environmental pollution, tailings basin breaches, or certain hazards or interruption of certain business activities, may not be available at an economically reasonable cost, or at all. Even if available, we may self-insure or maintain high deductibles where we determine it is most cost effective to do so. As a result, despite the insurance coverage that we carry, accidents or other negative developments involving our production, mining, processing or transportation activities causing losses in excess of policy limits, or losses arising from events not covered under insurance policies or subject to substantial deductibles, could have a material adverse effect on our financial condition and cash flows. In addition, the potential increase in extreme weather events influenced by climate change or otherwise may adversely impact our access to cost effective insurance in the future. The risk of increased insurance costs may have greater impact where the adverse event results in us asserting an insurance claim, the cost of which our insurers may seek to recoup during a future insurance renewal through increased premiums or limitations on coverage.
V. SUSTAINABILITY AND DEVELOPMENT RISKS
As we and our stakeholders seek reduced carbon footprints, transition toward carbon neutrality and enhance business sustainability, we face increased financial, regulatory, legal, and reputational risks and potential loss of business opportunities because our operations utilize carbon-based energy sources and produce GHG emissions.
As described in detail in Part I - Item 1. Business - Environmental Matters - Regulatory Developments - Climate Change and GHG Regulations above, because our operations use carbon-based energy and produce GHG emissions, we are subject to risks relating to decarbonization initiatives being undertaken by regulators and other stakeholders as part of global efforts to address the potential impacts of climate change. For example, as part of climate change mitigation strategies, governmental authorities may introduce mandatory carbon pricing obligations, carbon emissions limitations, carbon taxes or carbon trading mechanisms, such as the carbon taxes we are required to pay in respect of Stelco’s emissions, any of which could impose significant costs on our operations, including causing us to incur higher energy and supplier costs, invest in costly and potentially unproven emissions control or reduction technologies, and engage in more intensive environmental monitoring and reporting efforts. In addition, complying with current or future international treaties and laws or regulations concerning climate change and GHG emissions could negatively impact our ability, and that of our customers and suppliers, to compete with companies located in areas not subject to or not complying with such constraints. We may also face more limited access to, or increased costs of, capital to the extent financial institutions and investors increase expectations relating to lowering GHG emissions or reduce investments in carbon-intensive businesses or industries. Further, increased pressure from customers or other business partners seeking to reduce their indirect carbon footprints and achieve certain overall decarbonization targets, including by sourcing a larger percentage of steel products from recycled steel, could result in the potential loss of business opportunities if we are unable to meet their carbon, GHG emissions or sustainability expectations, or if we are perceived to have higher GHG intensity than our competition.
In addition, as part of our decarbonization strategy, we are investigating and from time to time may consider investments in or other relationships with various renewable and clean energy initiatives. For example, we have engaged in various discussions with other companies, universities and national research laboratories to leverage funding available under various DOE programs to support GHG emissions reductions. In 2024, the DOE awarded us funding to pursue two innovative projects intended to enhance business competitiveness and reduce GHG emissions at our Butler Works facility in Pennsylvania and our Middletown Works facility in Ohio. The Butler Works project involves replacing natural gas furnaces with electric induction furnaces for high-temperature reheating of GOES. The Middletown Works project involves a flex-fuel plant capable of consuming hydrogen or natural gas for the production of direct reduced iron, as well as two electric melting furnaces to melt the direct reduced iron into molten iron for use in the existing co-located BOF to produce the quality of steel currently produced at the mill. During 2024, the DOE awarded funding to multiple hydrogen hubs, and we have expressed interest in offtaking hydrogen from hubs near our operations. We commissioned a pipeline and completed a successful hydrogen injection trial at our Indiana Harbor blast furnace #7 in 2024, with the aim of enabling us to utilize clean hydrogen once it becomes viable at industrial quantities. In addition, we continue to engage with renewable energy developers on clean energy projects, with an emphasis on behind-the-meter solar projects located onsite at our operating facilities. While we are actively pursuing these decarbonization and energy-related projects, there are no guarantees that sufficient funding or the necessary advanced technology will be available to complete any of these projects under currently anticipated timeframes or at all. Additionally, we may not be successful in achieving our current or any future short, medium or long-term GHG emissions reduction goals, including any net-zero or near-zero goals, due to adverse changes in business conditions over time, unanticipated financial challenges or operational improvement efforts that may not be as successful as originally forecasted, or regulatory developments arising after such goals were initially announced.
To maintain consistent operational performance and foster growth in our businesses, we must maintain our social license to operate with our stakeholders.
Maintaining a strong reputation and consistent operational, environmental and safety track records is vital to continuing to foster business growth and maintaining our permission to operate. As stakeholders’ sustainability expectations increase and regulatory requirements continue to evolve, maintaining our social license to operate becomes increasingly important. Our ability to maintain our reputation and strong operating track record could be threatened, including by challenges relating to the integration of our recent acquisitions or by circumstances outside of our control, such as disasters caused or suffered by other companies in the steel and mining industries. Our social license to operate could also be adversely affected and claims have been and could continue to be made against us to the extent that environmental factors negatively impact local communities, such as air emissions, discharges to water, dust, odors, noise and other factors that are inherent in industrial activities like our steelmaking, cokemaking, scrap metal processing and mining operations, even if such activities are conducted in accordance with legal, regulatory and permit requirements. If we are not able to respond effectively to these and other challenges to our social license to operate, our reputation could be damaged significantly. Damage to our reputation or third-party claims initiated in response to our ongoing activities could adversely affect our continuity of operations, current and prospective business relationships, and ability to foster growth projects.
We rely on estimates of our recoverable mineral reserves, which are complex due to geological characteristics of the properties and the number of assumptions made.
We regularly evaluate, and engage third-party QPs to review and validate, our mineral reserves based on revenues and costs and update them as required in accordance with SEC regulations. Estimates of mineral reserves and future net cash flows necessarily depend upon a number of variable factors and assumptions, some of which are beyond our control, such as production capacity, effects of governmental regulations, future prices for minerals we mine, future industry conditions and operating costs, taxes, development costs, and costs of extraction and reclamation. Estimating the quantity and grade of mineral reserves requires us to
determine the size, shape and depth of our mineralized bodies by analyzing geological data, such as samplings of drill holes, and a QP to review and validate our determinations. Estimated mineral reserves could be affected by future industry conditions, future changes in the SEC’s mining property disclosure requirements, variation in geological conditions and ongoing mine planning. Actual volume and grade of reserves recovered, production rates, revenues on third-party sales and expenditures with respect to our reserves will likely vary from estimates, and if such variances are material, our sales and gross margins could be adversely affected.
Defects in title or loss of any access rights or leasehold or option interests in mining properties could limit our ability to mine these properties or result in significant unanticipated costs.
Many of our mining operations are conducted on properties we lease, license or for which we have easements, options or other possessory interests. We generally do not maintain title insurance on our mining properties, and certain of our land access arrangements were negotiated many years ago and have not been updated. Any title defect, inability to negotiate future access rights required by our mine plans, or the loss of any lease, license, option, easement or other possessory interest for any mining property could adversely affect our ability to access and mine any associated reserves. In addition, from time to time the rights of third parties for competing uses of adjacent, overlying or underlying lands, such as for roads, easements, public facilities or other mining activities, may result in disputes and affect our ability to operate as planned if our title is not superior or mutually acceptable arrangements cannot be negotiated. Any challenge to or inability to establish our title or access could delay the exploration and development of some reserves, resources, deposits or surface rights, cause us to incur unanticipated costs, and could ultimately result in the loss of some or all of our interest in those properties. In the event we lose reserves, resources, deposits or surface rights, we may be required to shut down or significantly alter impacted mining operations, thereby affecting future production, internal supply patterns and margins, revenues and cash flows.
VI. HUMAN CAPITAL RISKS
We depend on our senior management team and other key employees, and the loss of these employees could adversely affect our businesses.
Our success depends in part on our ability to attract, retain, develop and motivate our senior management and key employees. Achieving this objective may be difficult due to a variety of factors, including fluctuations in global economic and industry conditions, competitors’ hiring practices, cost reduction activities, and the effectiveness of our compensation programs. Competition for qualified personnel can be intense. We must continue to recruit, retain, develop and motivate our senior management and key personnel to maintain our businesses and support our projects. A loss of senior management and key personnel could prevent us from capitalizing on business opportunities, and our operating results could be adversely affected.
Our profitability could be adversely affected if we fail to maintain satisfactory labor relations.
Our production is dependent upon the efforts of our employees. We are party to labor agreements with various labor unions that represent employees at most of our operations. Such labor agreements are negotiated periodically, and, therefore, we are subject to the risk that these agreements may not be able to be renewed on reasonably satisfactory terms. It is difficult to predict what issues may arise as part of the collective bargaining process, and whether negotiations concerning these issues will be successful. Due to union activities or other employee actions, we could experience labor disputes, work stoppages or other disruptions in our production that could affect us adversely. Although we successfully negotiated all of our labor agreements that expired in 2024, we have several other labor agreements that will expire in 2025, including those covering union workers at our Butler, Monessen, Zanesville and certain FPT operations, and the outcomes of those labor negotiations are uncertain. If we enter into a new labor agreement with any union that significantly increases our labor costs relative to our competitors or fail to come to an agreement upon expiry, our ability to compete or continuity of production may be materially and adversely affected.
Our expenditures for pension and OPEB obligations could be materially higher than we have predicted if our underlying assumptions differ from actual outcomes, there are regulatory changes or the funded status of the multiemployer plans that we participate in degrade.
We provide retiree benefits through defined benefit pension and OPEB plans to certain eligible employees and retirees. Certain defined benefit pension plans are underfunded and may be subject to minimum cash contributions required by ERISA. Certain OPEB plans have funding requirements that are set under our collective bargaining agreements. Our funding obligations can significantly increase if plan assets underperform, the interest rates used to calculate minimum funding levels decrease, there are changes in laws and regulations affecting funding requirements or if there are increases to the benefit obligations. The calculation of the benefit obligation is based on several assumptions, including discount rates, healthcare trend rates, benefit levels pursuant to collective bargaining, mortality and other demographic assumptions. We have seen significant changes in retiree healthcare costs in recent years, which can be affected by changes in laws and regulations. If our assumptions do not materialize as expected and we make adverse changes to these assumptions, our earnings and cash flows could be unfavorably impacted.
We also contribute to certain multiemployer pension plans, including the Steelworkers’ Pension Trust, for which we are one of the largest contributing employers. Contribution amounts are determined during collective bargaining with our unions and could increase during future collective bargaining negotiations. Our obligations to these multiemployer plans could also increase if the funded status were to decline, which could be due to poor plan asset performance or if other contributors do not meet their obligations. If a multiemployer plan were to terminate or if we choose to withdraw, we could be subject to a liability based on the plan's underfunded status.
In addition, some of the transactions in which we previously sold or otherwise disposed of our non-core assets included provisions transferring certain pension and other liabilities to the purchasers or acquirers of those assets. While we believe that all such transfers were completed properly and are legally binding, if the purchaser fails to fulfill its obligations, we may be at risk that a court, arbitrator or regulatory body could disagree and determine that we remain responsible for pension and other liabilities that we intended to and did transfer.
We may encounter labor shortages for critical operational positions, which could adversely affect our ability to produce our products.
We are predicting a long-term shortage of skilled workers in heavy industry, such as electricians, and in certain highly specialized IT roles, such as legacy systems support, and competition for available workers limits our ability to attract and retain employees as well as engage third-party contractors. We may face potential labor shortages, as many of our most specialized and skilled roles are held by our more senior, experienced employees. As we lose these employees through attrition or otherwise, we may lose these workers’ specialized institutional knowledge of our legacy businesses and systems, and we may have difficulty replacing them at competitive wages or at all.
| | |
|
| ITEM 1B. UNRESOLVED STAFF COMMENTS |
We have no unresolved comments from the SEC.
Management of cybersecurity risks is an integral part of our overall risk management framework and is essential for safeguarding our business and data. We have developed an information security program to assess, identify and manage material risks from cybersecurity threats. The program includes policies and procedures that identify how security measures and controls drawn from multiple security frameworks are developed, implemented and maintained. Our cybersecurity risk management program works to balance critical infrastructure, network, application, cloud and information security objectives with overall business objectives and risk tolerance. Specific controls that are used include endpoint threat detection and response, identity and access management, privileged access management, logging and monitoring involving the use of security information and event management, multi-factor authentication, firewalls and intrusion detection and prevention, and vulnerability and patch management.
We use threat intelligence to inform our defensive measures. We use external and internal threat intelligence sources, including information from industry vendors and government agencies. Evolving threats and risks we are also monitoring and working to protect against include Artificial Intelligence, ransomware and nation-state attacks.
We believe in continuous improvement as part of the effort to optimize security, and we work to foster that culture through various initiatives:
•Cybersecurity Awareness Trainings: We educate employees on best practices for online safety and for identifying potential cybersecurity threats, including by maintaining quarterly training programs for our non-represented salaried workforce.
•Simulated Cyberattacks: With assistance from qualified third-party experts, we periodically conduct penetration testing and tabletop exercises to test our technical controls and incident response plans.
•Security Monitoring: We monitor our information technology environment with both our internal cybersecurity resources and third-party service providers. We also have processes in place to monitor the cybersecurity practices of various third-party service providers, including certain vendors that have access to our information systems or sensitive data.
•Proactive Reporting and Investigation: As part of our training initiatives, we regularly educate employees on how to report any suspicious cyber activity or potential cybersecurity issues, and we investigate reported concerns.
Third-party security firms are used in different capacities to provide or operate some of these programs, controls and technology systems, including cloud-based platforms and services.
Our Board of Directors has overall oversight responsibility for our enterprise risk management program and delegates cybersecurity risk management oversight to the Audit Committee of the Board of Directors. The Audit Committee is responsible for ensuring that management has processes in place designed to identify and evaluate cybersecurity risks to which the Company is exposed and implement processes and programs to manage cybersecurity risks and mitigate cybersecurity incidents. Management, including the Chief Information Officer with support from our cybersecurity team, updates the Audit Committee on at least a biannual basis regarding our cybersecurity programs and material cybersecurity risks and mitigation strategies. The Audit Committee also regularly reports on discussions regarding cybersecurity risks to our full Board of Directors. Management is responsible for identifying, considering and assessing material cybersecurity risks on an ongoing basis, establishing processes to ensure that such potential cybersecurity risk exposures are monitored, putting in place appropriate mitigation measures and maintaining cybersecurity programs. Our cybersecurity programs are under the direction of our Chief Information Officer, who has three years of experience overseeing information technology and cyber functions and who receives reports from our cybersecurity team and monitors the prevention, detection, mitigation and remediation of cybersecurity incidents. Our cybersecurity team includes personnel that have obtained credentials from the International System Security Certification Consortium and the SANS Institute, such as Certified Information Systems Security Professional (CISSP) and GIAC Certified Incident Handler, as well as experienced information systems security professionals and information security managers. Additionally, our internal Information
Security Committee, composed of leaders from key departments, collaborates on a cross-functional basis to identify practices that can counter threats and to monitor our cybersecurity programs and our cybersecurity incident response plans.
We recognize the ever-present global risk of cyberattacks from diverse threat actors, including nation-states, cybercriminals, hacktivists, insiders and organized crime. In spite of our efforts, we (or third parties we rely on) may not be able to fully, continuously and effectively implement security controls as intended. As described above, we utilize a risk-based approach and judgment to determine the security controls to implement, but it is possible we may not implement appropriate controls if we do not recognize or we underestimate a particular risk. In addition, security controls, no matter how well designed or implemented, may only mitigate and not fully eliminate risks. Further, even events that are detected by security tools or third parties may not always be immediately understood or acted upon. While no organization is immune to attack attempts and we cannot eliminate all risks from cybersecurity threats or provide assurance that we have not experienced an undetected cybersecurity incident, in 2024 we did not identify any material cybersecurity events that have materially affected or are reasonably likely to materially affect our business strategy, results of operations or financial condition. For further information about these risks, please see Part I - Item 1A. Risk Factors - IV. Operational Risks - A disruption in or failure of our IT systems, including those related to cybersecurity, could adversely affect our business operations, reputation and financial performance and could expose us to third-party liability.
The following map shows the locations of our active operations and corporate headquarters as of December 31, 2024:
CORPORATE OFFICES
We lease our corporate headquarters in Cleveland, Ohio. We also have leased office space in West Chester, Ohio; Chicago, Illinois; and Detroit, Michigan. We own office space located in Burns Harbor, Indiana and our Research and Innovation Center located in Middletown, Ohio.
STEELMAKING
| | | | | | | | | | | | | | | | | | | | | | | | | | | | | | | | | | | | | | |
| Location | | | Raw Material |
| (Tons in millions) | State /Province | | Iron Ore | Capacity (lt) | HBI | Capacity (mt) | Coke | Capacity (nt) | Coal | Capacity (nt) | Scrap | Capacity (mt) |
| | | | | | | | | | | | |
| Hibbing Taconite | MN | | l | 7.0 | | | | | | | | |
| Minorca | MN | | l | 3.0 | | | | | | | | |
| Northshore | MN | | l | 5.0 | | | | | | | | |
| Tilden | MI | | l | 8.0 | | | | | | | | |
| United Taconite | MN | | l | 6.0 | | | | | | | | |
| Toledo HBI | OH | | | | l | 1.9 | | | | | | |
| Burns Harbor (Coke) | IN | | | | | | l | 1.8 | | | | |
| Hamilton Works (Coke) | ON | | | | | | l | 0.7 | | | | |
| Lake Erie Works (Coke) | ON | | | | | | l | 0.7 | | | | |
| Monessen | PA | | | | | | l | 0.3 | | | | |
| Warren | OH | | | | | | l | 0.5 | | | | |
| Princeton | WV | | | | | | | | l | 1.8 | | |
| FPT | Multiple | | | | | | | | | | l | N/A |
| | | | | | | | | | | | | | | | | | | | | | | | | | | | | | | | | | | | | | |
| Location | | | Raw Steel | | Processing and Finishing |
| (Tons in millions) | State / Province | | BF-BOF | EAF | Configured Capacity (nt) | | Hot-Rolled | Cold-Rolled | Coated | Stainless & Electrical | Plate | Slab & Other |
| | | | | | | | | | | | |
| Burns Harbor | IN | | l | | 5.0 | | l | l | l | | | l |
| Burns Harbor Plate | IN | | | | | | | | | | l | |
| Butler | PA | | | l | 0.4 | | | | | l | | |
| Cleveland Works | OH | | l | | 3.4 | | l | l | l | | | l |
| Coatesville | PA | | | l | 0.2 | | | | | | l | l |
| Columbus | OH | | | | | | | | l | | | |
| Conshohocken | PA | | | | | | | | | | l | |
| Coshocton | OH | | | | | | | | | l | | |
| Dearborn Works | MI | | l | | 3.0 | | | l | l | | | l |
| Gary Plate | IN | | | | | | | | | | l | |
| Hamilton Works | ON | | | | | | | l | l | | | l |
| Indiana Harbor Works | IN | | l | | 4.0 | | l | l | l | | | l |
| Lake Erie Works | ON | | l | | 2.5 | | l | | | | | |
| Mansfield Works | OH | | | l | 0.5 | | | | | l | | |
| Middletown Works | OH | | l | | 3.0 | | l | l | l | l | | l |
| New Carlisle | IN | | | | | | | l | l | | | |
| Piedmont | NC | | | | | | | | | | l | |
| Riverdale | IL | | l | | 0.7 | | l | | | | | |
| Rockport Works | IN | | | | | | | l | l | l | | |
| Steelton | PA | | | l | 0.3 | | | | | | | l |
| Zanesville | OH | | | | | | | | | l | | |
STEELMAKING AND FINISHING FACILITIES
Our primary steel producing and finishing facilities are located across Illinois, Indiana, Michigan, Ohio, Pennsylvania, and Ontario. We operate eight blast furnaces and five EAFs. Finishing is completed on site at our integrated operations or at one of our 10 stand-alone processing and finishing facilities. In the aggregate, we have annual configured production capacity of approximately 23.0 million net tons of raw steel. During the years ended December 31, 2024 and 2023, our steelmaking facilities produced a total of 17.7 million and 19.0 million net tons of raw steel, respectively.
SCRAP PROCESSING FACILITIES
Our scrap business consists of our subsidiary FPT, which has 22 locations in Michigan, Ohio, Tennessee, Florida and Ontario. These facilities are primarily located in Michigan and Ohio, which are in close proximity to our scrap consuming steel facilities. During the years ended December 31, 2024 and 2023, FPT processed approximately 3 million net tons of scrap metal, of which approximately 50% of total output was prime grade.
DIRECT REDUCTION PLANT
Our direct reduction plant is located in Toledo, Ohio, is near an existing dock, and has access to rail and heavy haul roads for operation logistics. We are leasing the property on which the plant is located. This plant produces a specialized high quality iron alternative to scrap and pig iron and has annual capacity of 1.9 million metric tons of HBI. During the years ended December 31, 2024 and 2023, our direct reduction plant produced a total of 1.6 million and 1.7 million metric tons of HBI, respectively.
IRON ORE MINES AND PELLET PLANTS
The following information concerning our mining properties has been prepared in accordance with the requirements of subpart 1300 of Regulation S-K.
As used in this Annual Report on Form 10-K, the terms “mineral resource,” “measured mineral resource,” “indicated mineral resource,” “inferred mineral resource,” “mineral reserve,” “proven mineral reserve,” and “probable mineral reserve” are defined and used in accordance with subpart 1300 of Regulation S-K. Under subpart 1300 of Regulation S-K, mineral resources may not be classified as “mineral reserves” unless the determination has been made by a QP that the mineral resources can be the basis of an economically viable project. Investors are specifically cautioned not to assume that any part or all of the mineral deposits (including any mineral resources) in these categories will ever be converted into mineral reserves, as defined by the SEC.
Investors are cautioned that, except for that portion of mineral resources classified as mineral reserves, mineral resources do not have demonstrated economic value. Estimates of inferred mineral resources have too high of a degree of uncertainty as to their existence and may not be converted to a mineral reserve. Therefore, investors are cautioned not to assume that all or any part of an inferred mineral resource exists, that it can be the basis of an economically viable project, or that it will ever be upgraded to a higher category. Likewise, investors are cautioned not to assume that all or any part of measured or indicated mineral resources will ever be converted to mineral reserves.
See Part I – Item 1A. Risk Factors – V. Sustainability and Development Risks – We rely on estimates of our recoverable mineral reserves, which are complex due to geological characteristics of the properties and the number of assumptions made.
The information that follows relating to the Hibbing, Minorca, Northshore, Tilden and United Taconite iron ore mines is derived, for the most part, from, and in some instances is an extract from, the Technical Report Summaries relating to such properties prepared in compliance with Item 601(b)(96) and subpart 1300 of Regulation S-K. Portions of the following information are based on assumptions, qualifications and procedures that are not fully described herein. Reference should be made to the full text of the Technical Report Summaries, which are filed as Exhibits 96.1 through 96.5 to this Annual Report on Form 10-K and are incorporated by reference herein.
All of our iron ore mining operations are open-pit mines. Additional development is underway as required by long-range mine plans. Drilling programs are conducted periodically to collect geologic modeling data and for refining ongoing operations.
Geologic models are developed for all mines to define the major ore and waste rock types. Computerized block models for iron ore are constructed that include all relevant geologic and metallurgical data. These are used to generate grade and tonnage estimates, followed by detailed mine design and LoM operating schedules.
We currently own or co-own and operate five production-stage iron ore mines in Michigan and Minnesota, as well as one indefinitely idled mine in Michigan. We have an aggregate annual production capacity of approximately 29 million long tons of iron ore pellets, including our 85.3% share of the Hibbing mine production. Our iron ore mines produce from deposits located within the Biwabik and Negaunee Iron Formation, which are classified as Lake Superior type iron formations that formed under similar sedimentary conditions in shallow marine basins approximately two billion years ago. Magnetite and hematite are the predominant iron oxide ore minerals present, with lesser amounts of goethite and limonite. Quartz is the predominant waste mineral present, with lesser amounts of other chiefly iron bearing silicate and carbonate minerals. The ore minerals liberate from the waste minerals upon fine grinding.
The following represents iron ore production for the last three fiscal years:
| | | | | | | | | | | | | | | | | |
| Iron Ore Production |
| (In millions of long tons) | 2024 | | 2023 | | 2022 |
Hibbing1 | 5 | | | 6 | | | 5 | |
| Minorca | 3 | | | 3 | | | 3 | |
Northshore2 | 4 | | | 3 | | | 1 | |
| Tilden | 7 | | | 8 | | | 6 | |
| United Taconite | 5 | | | 5 | | | 5 | |
| Total | 24 | | | 25 | | | 20 | |
| | | | | |
1Hibbing is reported at 85.3% based on our ownership level. |
2In the second quarter of 2022, we temporarily idled our Northshore operations. The Northshore mine restarted production in the second quarter of 2023. |
The following provides an overview of our iron ore properties:
All the infrastructure necessary to mine and process significant commercial quantities of iron ore is currently in place at all of our mine locations. Infrastructure items include high voltage electrical supplies, natural gas pipelines that connect to the North American distribution system, water sources, paved roads and highways, railroads for transporting crude ore and finished products, port facilities that connect to the Great Lakes, and accommodations for employees. Local and state infrastructure also includes hospitals, schools, airports, equipment suppliers, fuel suppliers, commercial laboratories and communication systems. Labor is readily available with major population centers within 25 miles of all of our properties.
All of our iron ore mining operations grant leases, licenses and easements for various purposes, including miscellaneous community land uses, utility infrastructure and other third-party uses, that encumber our properties but do not materially inhibit operations. Certain assets also serve as collateral securing obligations under our ABL Facility. We maintain the requisite state and federal permits and are in material compliance with all material permits.
HIBBING
Hibbing (85.3% owned) is located immediately north of the city of Hibbing, Minnesota in the center of Minnesota’s Mesabi Iron Range. The mining and processing operation is located between latitude 47°25’48” N and 47°31’48” N and longitude 93°04’54” W and 92°54’36” W.
| | | | | |
Mining began in 1976 as a joint venture between Bethlehem Steel Corporation and Steel Company of Canada. Cliffs first became involved in the joint venture when it purchased Pickands Mather's 15% share in 1986. Prior to the AM USA Transaction, we owned 23% of Hibbing, ArcelorMittal USA LLC had a 62.3% interest and U. S. Steel had a 14.7% interest. On December 9, 2020, as a result of the AM USA Transaction, we acquired an additional 62.3% ownership stake in the Hibbing mine and became the majority owner and mine manager. Hibbing holds 30,705 acres of surface rights, of which 1,150 acres are associated with mineral leases. The majority of the mineral rights are leased. The property is comprised of 7,417 acres of mineral leases expiring between 2025 and 2056. Leases are maintained by making minimum prepaid royalty payments. Mining leases routinely are renegotiated and renewed as they approach their respective expiration dates. The operation includes an open pit truck and shovel mine, a concentrator that utilizes single stage crushing, AG mills and magnetic separation to produce a magnetite concentrate, which is then delivered to an on-site pellet plant. From the site, pellets are transported by BNSF (Burlington Northern Santa Fe, LLC) rail to a ship loading port at Superior, Wisconsin, operated by BNSF. The net book value of our ownership of Hibbing's property, plant and equipment was $44 million as of December 31, 2024. | |
For further information, see Exhibit 96.1, the Technical Report Summary on the Hibbing Taconite Property, Minnesota, USA, prepared for the Company by the QP, SLR, with an effective date of December 31, 2021.MINORCA
Minorca (100% owned) is located in the center of Minnesota’s Mesabi Iron Range. The Laurentian Pit is located near the City of Gilbert, Minnesota at latitude 47°30'0"N and longitude 92°26’30"W, East 1 Pit is located at latitude 47°31'30"N and longitude 92°23’30"W, and East 2 Pit is located just west of the City of Biwabik at latitude 47°32'0"N and longitude 92°22’30"W. The Minorca plant is located approximately seven miles to the northwest, near the town of Virginia, Minnesota at latitude 47°33'30"N and longitude 92°31.5'30"W.
Operations commenced in 1976 as an asset of Inland Steel Company. In 1998, Ispat International purchased Inland Steel and, in 2004, merged with LNM Holdings and International Steel Group to form Mittal Steel, which in 2007 merged with Arcelor to form ArcelorMittal S.A. Minorca has been wholly owned by Cliffs since the 2020 AM USA Transaction.
| | | | | |
| Minorca holds 13,690 acres of surface rights, of which 282 acres are associated with mineral leases. 100% of the mineral rights are leased. The property is comprised of 3,135 acres of mineral leases expiring between 2035 and 2056. Leases are maintained by making minimum prepaid royalty payments. Mining leases routinely are renegotiated and renewed as they approach their respective expiration dates. The operation includes a concentrating and pelletizing facility, along with two open pit iron ore mines located approximately seven miles from the processing facilities. The processing operations consist of a crushing facility, a three-line concentration facility and a single-line straight grate pelletizing plant. Pellets are transported by CN rail to ports on Lake Superior. The net book value of Minorca's property, plant and equipment was $208 million as of December 31, 2024. |
For further information, see Exhibit 96.2, Technical Report Summary on the Minorca Property, Minnesota, USA, prepared for the Company by the QP, SLR, with an effective date of December 31, 2021.NORTHSHORE
Northshore's (100% owned) mine is located on the northeastern edge of the Mesabi Iron Range in northeastern Minnesota, approximately four miles southeast of Babbitt, Minnesota at latitude 47°40'12.15"N and longitude 91°53'1.28"W. The processing facility is approximately 41 miles to the southeast and immediately adjacent to the city of Silver Bay in Lake County, Minnesota at latitude 47°17'38.95"N and longitude 91°15'23.38"W.
| | | | | |
Operations commenced in 1952 as an asset of the Reserve Mining Company and continued production until 1986 when Reserve Mining declared bankruptcy. Cyprus Minerals Company purchased the facilities in 1989. Cyprus subsequently sold the facilities to Cliffs in 1994. Northshore holds 28,041 acres of surface rights, of which 8,966 acres are associated with mineral leases. 100% of the mineral rights are leased. The property is comprised of 10,356 acres of mineral leases. Some leases do not expire until the mineral reserves are exhausted while others expire between 2034 and 2075. Leases are maintained by making minimum prepaid royalty payments. Mining leases routinely are renegotiated and renewed as they approach their respective expiration dates. | |
The operation includes an open pit truck and shovel mine where two stages of crushing occur before the ore is transported along a wholly owned 47-mile rail line to the plant site in Silver Bay. At the plant site, two additional stages of crushing occur before the ore is sent to the concentrator. The concentrator utilizes rod mills and magnetic separation to produce a magnetite concentrate, which is delivered to the pellet plant located on-site. The plant can produce both standard and DR-grade pellets. The plant site has its own ship loading port located on Lake Superior.
The net book value of Northshore's property, plant and equipment was $230 million as of December 31, 2024.
For further information, see Exhibit 96.3, Technical Report Summary on the Northshore Property, Minnesota, USA, prepared for the Company by the QP, SLR, with an effective date of December 31, 2021.
TILDEN
Tilden (100% owned) is located in Marquette County in Michigan’s Upper Peninsula, on the Marquette Iron Range, approximately five miles south of the city of Ishpeming, Michigan at latitude 46° 29' N and longitude 87° 40' W.
| | | | | |
| The property commenced operations in 1974 under a partnership of Algoma Steel, Stelco, J&L Steel, Wheeling-Pittsburgh Steel, Sharon Steel and The Cleveland-Cliffs Iron Company. The property has since been at least partially in the possession of a subsidiary of Cliffs. In 2001, Cliffs acquired Algoma Steel's 45% interest in Tilden. In 2017, Cliffs became the sole owner of Tilden. Tilden holds 21,100 acres of surface rights and leases 2,470 acres of mineral rights expiring between 2061 and 2070. Leases are maintained by making minimum prepaid royalty payments. Mining leases routinely are renegotiated and renewed as they approach their respective expiration dates. Operations include an open pit truck and shovel mine, a concentrator that utilizes single stage crushing, AG mills and floatation to produce hematite concentrates that are then supplied to the on-site pellet plant. From the site, pellets are transported by our LS&I (Lake Superior & Ishpeming Railroad Company) rail to a ship loading port at Marquette, Michigan, operated by LS&I. |
The net book value of Tilden's property, plant and equipment was $256 million as of December 31, 2024.For further information, see Exhibit 96.5, Technical Report Summary on the Tilden Property, Michigan, USA, prepared for the Company by the QP, SLR, with an effective date of December 31, 2021.
UNITED TACONITE
United Taconite's (100% owned) mine and offices are located on Minnesota's Mesabi Iron Range just north of Eveleth, Minnesota at latitude 47°29'1.62" N, longitude 92°32'23.69" W. The processing facilities are located approximately eight miles to the southeast.
| | | | | |
The property commenced operations as an asset of Eveleth Taconite Company in 1965 before it was purchased by United Taconite (70% Cliffs and 30% Laiwu Steel) in December 2003. The property has been a wholly owned subsidiary of Cliffs since 2008. United Taconite owns 14,199 acres of surface rights, of which 703 acres are associated with mineral leases. An additional 145 acres of surface rights are leased from the State of Minnesota. We lease 100% of the mineral rights, comprised of 4,908 acres expiring between 2037 and 2066, with the exception of the State of Minnesota mineral lease, which expires in 2027. Leases are maintained by making minimum prepaid royalty payments. Mining leases routinely are renegotiated and renewed as they approach their respective expiration dates. Operations include an open pit truck and shovel mine where two stages of crushing occur before the ore is transported by rail, operated by CN, to the plant site. At the plant site an additional stage of crushing occurs before the ore is sent to the concentrator. The concentrator utilizes rod mills and magnetic separation to produce a magnetite concentrate, which is delivered to the on-site pellet plant. From the plant site, pellets are transported by CN rail to a ship loading port at Duluth, Minnesota, operated by CN. The net book value of United Taconite's property, plant and equipment was $570 million as of December 31, 2024. | |
For further information, see Exhibit 96.4, Technical Report Summary on the United Taconite Property, Minnesota, USA, prepared for the Company by the QP, SLR, with an effective date of December 31, 2021.
MINERAL RESOURCES
Mineral resources are defined under Item 1300 of Regulation S-K as a concentration or occurrence of material of economic interest in or on the Earth’s crust in such form, grade or quality, and quantity that there are reasonable prospects for economic extraction. A mineral resource is a reasonable estimate of mineralization, taking into account relevant factors such as cut-off grade, likely mining dimensions, location or continuity that, with the assumed justifiable technical and economic conditions, is likely to, in whole or part, become economically extractable.
A detailed breakdown of the mineral resources exclusive of mineral reserves is presented in the table below. Mineral resources were defined and constrained within open-pit shells, prepared by Cliffs, and based on a US$90.00/WLT pellet price, while meeting defined cut-off grade criteria and existing pellet specifications. All mineral resource estimates were reviewed and validated by the QP, SLR.
The following represents iron ore mineral resources, exclusive of mineral reserves, as of December 31, 2024 and 2023:
| | | | | | | | | | | | | | | | | | | | | | | | | | | | | |
| Iron Ore Mineral Resources |
| Measured | Indicated | Measured + Indicated | Process Recovery | Inferred |
| (In millions of long tons) | Tonnage | % Grade | Tonnage | % Grade | Tonnage | % Grade | Tonnage | % Grade |
| Total Iron Ore | 1,351 | | 22.5 | | 1,483 | | 23.6 | | 2,834 | | 23.1 | | 31% | 420 | | 32.4 | |
| | | | | | | | | |
| Michigan | — | | — | | 135 | | 35.5 | | 135 | | 35.5 | | 36% | 350 | | 34.7 | |
| Minnesota | 1,351 | | 22.5 | | 1,348 | | 22.4 | | 2,699 | | 22.4 | | 31% | 70 | | 21.0 | |
| | | | | | | | | |
Hibbing1 | 8 | | 19.2 | | 1 | | 18.7 | | 9 | | 19.2 | | 25% | — | | — | |
| Minorca | 484 | | 22.9 | | 317 | | 22.9 | | 801 | | 22.9 | | 33% | 30 | | 21.1 | |
| Northshore | 767 | | 22.1 | | 391 | | 22.4 | | 1,158 | | 22.2 | | 26% | 14 | | 19.8 | |
| Tilden | — | | — | | 135 | | 35.5 | | 135 | | 35.5 | | 36% | 350 | | 34.7 | |
| United Taconite | 92 | | 23.6 | | 639 | | 22.2 | | 731 | | 22.4 | | 32% | 26 | | 21.5 | |
| | | | | | | | | |
1Hibbing is reported at 85.3% based on our ownership level. | |
Reference point selected is the saleable tons based on the process recovery. |
Process recovery may change based on the required saleable product mix and is reported as wet product percentage. |
Mineral resources are estimated using the following cut-off grades: 25% FeT for Tilden hematite; 15% magnetic Fe for Northshore; 16% magnetic Fe for Minorca; 17% magnetic Fe for United Taconite; and 13% magnetic Fe for Hibbing. |
| Tonnage is reported in long tons equivalent to 2,240 pounds and has been rounded to the nearest 100,000. |
| Mineral resources are reported at a $90.00/lt wet standard pellet price freight-on-board (FOB) Lake Superior, which is based on the mine planning model's three-year trailing average of the realized product revenue rate. |
We did not have any material changes to our mineral resources during 2024. The material assumptions and criteria used for the mineral resource estimates, including but not limited to leases, permits and geotechnical pit design, are covered in more detail in Sections 11 through 13 of the respective Technical Report Summaries filed as Exhibits 96.1 through 96.5 to this Annual Report on Form 10-K.
MINERAL RESERVES
Mineral reserves are defined under Item 1300 of Regulation S-K as an estimate of tonnage and grade or quality of indicated and measured mineral resources that, in the opinion of the QP, can be the basis of an economically viable project. More specifically, it is the economically mineable part of a measured or indicated mineral resource, which includes diluting materials and allowances for losses that may occur when the material is mined or extracted.
Proven mineral reserves are defined under Item 1300 of Regulation S-K as the economically mineable part of a measured mineral resource and can only result from conversion of a measured mineral resource. Probable mineral reserves are defined under Item 1300 of Regulation S-K as the economically mineable part of an indicated and, in some cases, a measured mineral resource. All mineral reserves are classified as proven or probable and are supported by LoM plans.
Mineral reserves are based on pricing that does not exceed the three-year trailing average index price of iron pellets adjusted to realized price. We evaluate and analyze, and engage QPs to review and verify, mineral reserves in accordance with our mineral policy and SEC requirements and then complete updated LoM plans. The table below identifies the year in which the latest updated LoM plan was completed.
Mineral reserves estimates for our iron mines are constrained by fully designed open pits developed using three-dimensional modeling techniques. These open pits incorporate design slopes, practical mining shapes and access ramps to assure the accuracy of our mineral reserve estimates. All operations' mineral reserves have been adjusted net of production through year-end 2024. All mineral reserves estimates as of December 31, 2021 were reviewed and validated by the QP, SLR.
The following represents iron ore mineral reserves as of December 31, 2024:
| | | | | | | | | | | | | | | | | | | | | | | | | | |
| Iron Ore Mineral Reserves |
as of December 31, 2024 |
| Last LoM Plan | Proven | Probable | Proven & Probable | Process |
| (In millions of long tons) | Reserve Analysis | Tonnage | % Grade | Tonnage | % Grade | Tonnage | % Grade | Recovery |
| Total Iron Ore | | 522 | | 23.8 | | 1,619 | | 26.3 | | 2,141 | | 25.7 | | 32% |
| | | | | | | | |
| Michigan | | 4 | | 35.3 | | 458 | | 34.6 | | 462 | | 34.6 | | 37% |
| Minnesota | | 518 | | 23.8 | | 1,161 | | 23.0 | | 1,679 | | 23.3 | | 31% |
| | | | | | | | |
Hibbing1,2 | 2024 | 67 | | 19.0 | | 4 | | 19.0 | | 71 | | 19.0 | | 24% |
| Minorca | 2021 | 78 | | 23.7 | | 7 | | 25.3 | | 85 | | 23.8 | | 35% |
| Northshore | 2020 | 275 | | 25.3 | | 519 | | 24.1 | | 794 | | 24.5 | | 29% |
| Tilden | 2021 | 4 | | 35.3 | | 458 | | 34.6 | | 462 | | 34.6 | | 37% |
| United Taconite | 2019 | 98 | | 23.4 | | 631 | | 22.1 | | 729 | | 22.3 | | 33% |
| | | | | | | | |
1 Hibbing is reported at 85.3% based on our ownership level. |
2 Incremental adjustments to Hibbing’s mineral reserves are due to acquisition of new leases and mining permits both within and directly adjacent to Hibbing's current operating footprint, as well as reconciliation of the previous four years of depletion with increased levels of dilution. |
Reference point selected by the QP is the saleable tons based on the process recovery. |
Process recovery may change based on the required saleable product mix and is reported as wet product percentage. |
Mineral reserves are estimated using the following cut-off grades: 25% FeT for Tilden hematite; 19% magnetic Fe for Northshore; 16% magnetic Fe for Minorca; 17% magnetic Fe for United Taconite; and 13% magnetic Fe for Hibbing. |
| Tonnage is reported in long tons equivalent to 2,240 pounds and has been rounded to the nearest 100,000. |
| Mineral reserves are classified as probable if not scheduled within the first 20 years. |
| Mineral reserves are reported at a $90.00/lt wet standard pellet price freight-on-board (FOB) Lake Superior, which is based on the mine planning model's three-year trailing average of the realized product revenue rate. |
The material assumptions and criteria used for the mineral reserves estimates, including but not limited to leases, permits and geotechnical pit design, are covered in more detail in Sections 11 through 13 of the respective Technical Report Summaries filed as Exhibits 96.1 through 96.5 to this Annual Report on Form 10-K.
For comparison purposes, the following represents iron ore mineral reserves as of December 31, 2023:
| | | | | | | | | | | | | | | | | | | | | | | |
| Iron Ore Mineral Reserves |
as of December 31, 2023 |
| Proven | Probable | Proven & Probable | Process |
| (In millions of long tons) | Tonnage | % Grade | Tonnage | % Grade | Tonnage | % Grade | Recovery |
| Total Iron Ore | 539 | | 24 | | 1,643 | | 26.4 | | 2,182 | | 25.8 | | 33% |
| | | | | | | |
| Michigan | 4 | | 35.3 | | 478 | | 34.7 | | 482 | | 34.7 | | 37% |
| Minnesota | 535 | | 23.9 | | 1,165 | | 23.0 | | 1,700 | | 23.3 | | 31% |
| | | | | | | |
Hibbing1 | 47 | | 18.7 | | 8 | | 18.7 | | 55 | | 18.7 | | 26% |
| Minorca | 86 | | 23.7 | | 7 | | 25.1 | | 93 | | 23.8 | | 34% |
| Northshore | 288 | | 25.3 | | 519 | | 24.1 | | 807 | | 24.5 | | 29% |
| Tilden | 4 | | 35.3 | | 478 | | 34.7 | | 482 | | 34.7 | | 37% |
| United Taconite | 114 | | 23.1 | | 631 | | 22.1 | | 745 | | 22.3 | | 33% |
| | | | | | | |
1Hibbing is reported at 85.3% based on our ownership level. |
Reference point selected by the QP is the saleable tons based on the process recovery. |
Process recovery may change based on the required saleable product mix and is reported as wet product percentage. |
Mineral reserves are estimated using the following cut-off grades: 25% FeT for Tilden hematite; 19% magnetic Fe for Northshore; 16% magnetic Fe for Minorca; 17% magnetic Fe for United Taconite; and 13% magnetic Fe for Hibbing. |
| Tonnage is reported in long tons equivalent to 2,240 pounds and has been rounded to the nearest 100,000. |
| Mineral Reserves are classified as probable if not scheduled within the first 20 years. |
| Mineral Reserves are reported at a $90.00/lt wet standard pellet price freight-on-board (FOB) Lake Superior, which is based on the mine planning model's three-year trailing average of the realized product revenue rate. |
Overall, mineral reserves estimates as of December 31, 2024, as compared to the prior-year period, decreased by 1%, which was driven by mining depletion offset by the Hibbing mine plan update.
INTERNAL CONTROLS DISCLOSURE
We demonstrated repeated attainment of annual production and quality targets for at least 45 years at each material iron ore mine operated by the Company. Internal controls the Company uses in its industry-standard approach to exploration and mineral resource and reserve estimation efforts are governed by its Mineral Reserve and Mineral Resource Estimation Policy and are detailed in Cliffs’ minimum operating standards for Resource Estimation and Strategic Mine Planning. The controls include: confirmation of drill collar locations and drill hole traces, drill logging and sample collection and security, database verification and security, QA/QC programs, internal and third-party QP statistical analysis, third-party QP model validation, and reconciliation. Modeling and analysis of the Company’s resources has been developed by Company personnel or third-party consultant SLR and reviewed by internal management and the external independent QP, SLR. Reserve estimations have been completed by Company personnel and reviewed by internal management and the QP, SLR.
Drill hole collar surveying methods have evolved with advancements in technology, moving from optical methods to global positioning system, which is currently in use. For the deposit type, all survey methods used for the collar locations are expected to provide adequate accuracy for the drill hole locations. Due to the relatively shallow depth and vertical nature of drill holes at Cliffs’ Minnesota mining operations, downhole deviation surveys are typically not conducted. Drill holes pierce the generally shallow-dipping, tabular iron formation at near perpendicular angles. At the more geologically and structurally complex Tilden mine in Michigan, where drilling deeper than 500 feet is required, downhole surveys have moved from a clay-impression procedure to the gyroscopic method currently in use.
Drill core is transported directly from the drill rig to each site’s core logging facility by either the drilling contractor or Cliffs’ personnel. Temporary core storage is located at each site’s secure logging facility. Unused sample reserves, parts, concentrates and splits are securely stored in labeled boxes or barrels at a Cliffs laboratory facility or logging facility.
Cliffs' QA/QC programs are site-specific, well-developed protocols that involve formal procedures for the use of crude material standards developed from on-site material, as well as regularly inserted coarse and concentrate duplicate samples, control chart analysis and reporting. Cliffs typically uses internal and external labs for geometallurgical analyses that are accredited with ASQ/ANSI ISO-9001:2015 (American Society for Quality/American National Standards Institute) for their system of quality management. Quality sample results are monitored and enacted on where warranted. Also, Cliffs has implemented a drill campaign reporting practice to ensure results are documented, with defined and illustrated failure metrics, outcomes of investigations, comparisons with previous year’s results and recommendations. The QP, SLR, reviewed Cliffs' QA/QC practices and provided recommendations for further work. Where QA/QC programs were still in development at that time and prior to resource estimation, Cliffs conducted data verification studies utilizing a suite of blind crude ore standards and blind duplicates from historical sample
reserves within the LoM plan. Where unaccredited labs provided data used in resource estimation, check lab studies were initiated to verify analytical results. Cliffs is currently working toward completing alignment of QA/QC protocols at each mine to the Company’s current best practice by formalizing procedures.
Cliffs maintains exploration drill hole data in an externally-managed, access-controlled acQuire database that is backed up online at regularly scheduled intervals to provide data redundancy and security. Certification of database integrity is accomplished by both visual and statistical inspections comparing geology, assay values and survey locations cross-referenced back to laboratory data and geologic logs. Any discrepancies identified are corrected by referring to hard-copy assay and core log information archived in Cliffs' Mine Engineering department files. Prior to modeling, a secondary validation check is completed using built-in data validation routines in the modeling software.
Cliffs performs routine drill hole database verification with every new drilling program and new block model build, including: check of unique drill hole identifications and collar coordinates; check of assay or lithology points extending past the specified maximum depth of drill hole; check of abnormal dips and azimuths of downhole drill hole surveys; check of negative, overlapping and missing intervals; and check of incorrect lithologic codes and assay values.
In 2020 and 2021, Cliffs' geologists completed data verification exercises within the LoM plan area for each mining operation. This was audited by the QP, SLR, to assess accuracy and completeness. Database values were checked against source documents including collar surveys, geologic logs and assay certificates. Data verification included collar coordinates, depth intervals of geologic units and assay samples, and results of geometallurgical analyses applied to mineral resource estimation and mine planning.
Cliffs’ mineral resource estimates were validated by the QP, SLR, using standard industry techniques including statistical comparisons with composite samples and parallel nearest neighbor estimates, swath plots, as well as visual reviews in cross-section and plan. A visual review comparing blocks to drill holes for key economic variables, completed after the block modeling work, was performed to ensure general lithologic and analytical conformance. Cliffs’ mining operations have demonstrated good agreement between planned and actual product produced over more than 45 years for each operation.
Cliffs classifies the mineral resources based primarily on drill hole spacing and influenced by geologic continuity, ranges of economic criteria, and reconciliation. Some post-processing is undertaken to ensure spatial consistency and remove isolated and fringe blocks. The resource area for each operation is limited by a polygon and subsequent pit shell based on practical mining limits. To ensure that all mineral resource statements satisfy the “reasonable prospects for economic extraction” requirement, in the definition of the mineral resources under Item 1300 of Regulation S-K, factors significant to technical feasibility and potential economic viability are considered (e.g., ability to obtain permits and legal and land tenure considerations). Mineral resources are defined and constrained within optimized, open-pit shells, prepared by Cliffs and reviewed by the QP, SLR, and based on a US$90.00/WLT pellet value and target pellet iron content.
Grade and tonnage reconciliations are run on current production versus modeled production, which provides insight on the accuracy of the modeled assay data versus actual production for each mining operation.
For a discussion of comprehensive risk inherent in the estimation of mineral reserves, see Part I - Item 1A. Risk Factors - V. Sustainability and Development Risks - We rely on estimates of our recoverable mineral reserves, which are complex due to geological characteristics of the properties and the number of assumptions made.
COAL MINING AND COKEMAKING
Princeton is a coal mining complex located in West Virginia that specializes in surface and underground mining of metallurgical coal to produce coke and pulverized coal injection coal. As of December 31, 2024, we have annual rated metallurgical coal production capacity of 1.8 million net tons from our Princeton mine. During the years ended December 31, 2024 and 2023, the mine produced 1.0 million and 1.3 million net tons of coal, respectively. We own 100% of the Princeton mine, which has been operating since 1995. We own 60% of the mineral rights and lease 40% via multiple mineral leases having varying expiration dates. Mining leases are routinely renegotiated and renewed as they approach their respective expiration dates. Princeton's operations consist of three open-pit surface mines, one underground mine, a preparation plant and two rail loadouts.
Our Monessen and Warren facilities produce furnace coke and related by-products in Monessen, Pennsylvania and Warren, Ohio, respectively. We also operate cokemaking facilities located within our Burns Harbor, Lake Erie Works and Hamilton Works locations. These facilities have an aggregate annual rated capacity of 4.0 million net tons. During each of the years ended December 31, 2024 and 2023, our cokemaking facilities produced 2.4 million net tons of coke.
OTHER BUSINESSES
Our Tubular operating segment consists of our subsidiary Tubular Components, which has plants in Walbridge, Ohio and Columbus, Indiana. The Walbridge plant operates six electric resistance welded tube mills and one laser re-cutting line on owned property. The Columbus plant operates five electric resistance welded tube mills and four high-speed cold saws on leased property.
Our Tooling and Stamping operating segment consists of our subsidiary Tooling and Stamping and its related companies, which provides advanced-engineered solutions, tool design and build, hot- and cold-stamped steel components and complex assemblies for the automotive market across 10 plants, of which certain of these are under long-term lease agreements, in Ontario, Alabama, Kentucky and Tennessee. Its facilities feature eight large-bed, hot-stamping presses, providing 14 lines of production; 82 cold-stamping presses ranging from 150 net tons to 3,000 net tons of pressing capacity; 18 large-bed, high-tonnage tryout presses with
prove-out capabilities for new tool builds; and 162 multi-axis welding assembly cells.
Our European operating segment consists of a metal distribution company that buys and sells steel, steel products and other materials. We operate out of six different European countries: the Netherlands, Italy, Germany, France, Spain and the United Kingdom.
| | |
|
| ITEM 3. LEGAL PROCEEDINGS |
LEGAL PROCEEDINGS RELATING TO OUR BUSINESS
JSW Steel Litigation. On June 8, 2021, JSW Steel filed a complaint against Cleveland-Cliffs Inc., AK Steel Holding Corporation (now known as Cleveland-Cliffs Steel Holding Corporation), Nucor Corporation and U. S. Steel in the United States District Court for the Southern District of Texas. JSW Steel alleges that the defendants engaged in a group boycott against JSW Steel in violation of federal and Texas antitrust laws by refusing to sell semi-finished steel slabs to JSW Steel, beginning in 2018 and continuing through the filing of the complaint; civil conspiracy among the defendants; and tortious interference with JSW Steel’s contractual rights and business relations involving its vendors and customers. JSW Steel’s allegations involve the tariffs and quotas imposed on steel imports by the U.S. government under Section 232 beginning in March 2018, which JSW Steel alleges raised the price of imported slabs, and statements made to the U.S. government related to exemption requests submitted by JSW Steel in 2018 and 2021. JSW Steel further claims that this alleged anticompetitive conduct negatively impacted JSW Steel’s costs, production and revenues and prevented it from pursuing expansion plans at its Ohio and Texas facilities that would compete with the defendants. JSW Steel is seeking to hold the defendants jointly and severally liable for treble damages in an amount in excess of $500 million and other relief. On February 17, 2022, the district court granted the defendants' Motions to Dismiss in their entirety and dismissed all of JSW's claims with prejudice. On March 16, 2022, JSW filed a notice of appeal to the United States Court of Appeals for the Fifth Circuit, and oral arguments on the appeal were held on February 6, 2023. We continue to believe the claims asserted against us are without merit, and we are vigorously defending against them.
Mesabi Metallics Adversary Proceeding. On September 7, 2017, Mesabi Metallics Company LLC (f/k/a Essar Steel Minnesota LLC) ("Mesabi Metallics") filed a complaint against Cleveland-Cliffs Inc. in the Essar Steel Minnesota LLC and ESML Holdings Inc. bankruptcy proceeding in the United States Bankruptcy Court, District of Delaware (the "Bankruptcy Court"). Mesabi Metallics alleged tortious interference with its contractual rights and business relations involving certain vendors, suppliers and contractors, violations of federal and Minnesota antitrust laws through monopolization, attempted monopolization and restraint of trade, violation of the automatic stay, and civil conspiracy with unnamed Doe defendants. Mesabi Metallics amended its complaint to add additional defendants, including, among others, our subsidiary, Cleveland-Cliffs Minnesota Land Development Company LLC ("Cliffs Minnesota Land"), and to add additional claims, including avoidance and recovery of unauthorized post-petition transfers of real estate interests, claims disallowance, civil contempt and declaratory relief. Mesabi Metallics seeks to hold the defendants jointly and severally liable for, among other things, antitrust damages and injunctive relief. The parties filed various dispositive motions on certain of the claims, including a motion for partial summary judgment to settle a dispute over real estate transactions between Cliffs Minnesota Land and Glacier Park Iron Ore Properties LLC ("GPIOP"). A ruling in favor of Cliffs, Cliffs Minnesota Land and GPIOP was issued on July 23, 2018, finding that Mesabi Metallics' leases had terminated and upholding Cliffs' and Cliffs Minnesota Land's purchase and lease of the contested real estate interests. Mesabi Metallics filed a Motion for Leave to File an Interlocutory Appeal, which was denied on September 10, 2019. Discovery was completed, and the parties filed cross-motions for summary judgment. On October 8, 2024, the Bankruptcy Court issued an order granting and denying parts of the cross-motions. On February 14, 2025, Mesabi Metallics' motion for the case to be withdrawn from the Bankruptcy Court and proceed in the United States District Court for the District of Delaware was granted. We continue to believe the claims asserted against us are without merit, and we intend to continue vigorously defending against all remaining claims in the lawsuit.
U. S. Steel – Nippon Steel Litigation. On January 6, 2025, U. S. Steel, Nippon Steel Corporation and Nippon Steel North America, Inc. (together with Nippon Steel Corporation, "Nippon Steel") filed a complaint in the United States District Court for the Western District of Pennsylvania against Cleveland-Cliffs Inc., Lourenco Goncalves and David McCall, the International President of the USW. The plaintiffs' lawsuit was filed in the immediate aftermath of former President Biden's issuance of an executive order blocking a proposed merger of U. S. Steel and Nippon Steel on national security grounds. The plaintiffs allege that the defendants have entered into an unlawful agreement to oppose the sale of U. S. Steel to any buyer other than Cliffs. The plaintiffs also allege that Cliffs and Mr. Goncalves, with the assistance and support of the USW, have monopolized or attempted to monopolize the markets for NOES, GOES, iron ore pellets and exposed automotive steel in North America in violation of federal antitrust laws. The plaintiffs further allege that the defendants violated and conspired to violate federal anti-racketeering laws by pursuing their alleged scheme to force U. S. Steel into an acquisition by Cliffs and monopolize the aforementioned markets. Finally, the plaintiffs allege that the defendants' speech and actions against U. S. Steel's proposed acquisition by Nippon Steel constitutes tortious interference with existing and prospective business relations. In addition to their claims for monetary relief, which include claims for treble and punitive damages, the plaintiffs have sought a preliminary injunction enjoining the defendants' alleged activities against the plaintiffs' proposed merger. At a hearing held on January 17, 2025, we successfully opposed the plaintiffs' motion to expedite proceedings, and the court entered a schedule for the parties to brief motions to dismiss the four counts in the plaintiffs' complaint that are the subject of the plaintiffs' motion for a preliminary injunction. The defendants moved to dismiss these counts on February 4, 2025, and a hearing on the motions is expected to be held on March 12, 2025. We believe the claims asserted against us are without merit, and we are vigorously defending against them.
Certain Legacy Legal Proceedings Relating to our Steel Operations. Certain of our acquired subsidiaries have been named as defendants, among many other named defendants, in numerous lawsuits filed since 1990 claiming injury allegedly resulting from
exposure to asbestos. Similar lawsuits seeking monetary relief continue to be filed in various jurisdictions in the U.S., which cases are vigorously defended. Although predictions about the outcome of pending litigation is subject to uncertainties, based upon present knowledge, we believe it is unlikely that the resolution in the aggregate of these claims will have a material adverse effect on our consolidated results of operations, cash flows or financial condition.
LEGAL PROCEEDINGS RELATING TO ENVIRONMENTAL MATTERS
SEC regulations require us to disclose certain information about administrative or judicial proceedings involving the environment and to which a governmental authority is a party if we reasonably believe that such proceedings may result in monetary sanctions above a stated threshold. Pursuant to SEC regulations, we use a threshold of $1 million for purposes of determining whether disclosure of any such proceedings is required. We believe that this threshold is reasonably designed to result in disclosure of any such proceedings that are material to our business or financial condition.
| | |
|
| ITEM 4. MINE SAFETY DISCLOSURES |
We are committed to protecting the occupational health and well-being of each of our employees. Safety is one of our core values and we strive to ensure that safe production is the first priority for all employees. Our internal objective is to achieve zero injuries and incidents across the Company by focusing on proactively identifying needed prevention activities, establishing standards and evaluating performance to mitigate any potential loss to people, equipment, production and the environment. We have implemented intensive employee training that is geared toward maintaining a high level of awareness and knowledge of safety and health issues in the work environment through the development and coordination of requisite information, skills and attitudes. We believe that through these policies, we have developed an effective safety management system.
Under the Dodd-Frank Act, each operator of a coal or other mine is required to include certain mine safety results within its periodic reports filed with the SEC. As required by the reporting requirements included in §1503(a) of the Dodd-Frank Act and Item 104 of Regulation S-K, the information concerning mine safety and health or other regulatory matters for each of our mine locations that are covered under the scope of the Dodd-Frank Act is included in Exhibit 95 of Part IV – Item 15. Exhibits and Financial Statement Schedules of this Annual Report on Form 10-K.
PART II
| | |
|
| ITEM 5. MARKET FOR REGISTRANT'S COMMON EQUITY, RELATED STOCKHOLDER MATTERS AND ISSUER PURCHASES OF EQUITY SECURITIES |
STOCK EXCHANGE INFORMATION
Our common shares (ticker symbol CLF) are listed on the NYSE (New York Stock Exchange).
HOLDERS
At February 25, 2025, we had 2,458 shareholders of record.
SHAREHOLDER RETURN PERFORMANCE
The following graph shows changes over the past five-year period in the value of $100 invested in: (1) Cliffs' common shares; (2) S&P 500 Index; (3) S&P Metals and Mining Select Industry Index; and (4) S&P MidCap 400 Index. The values of each investment are based on price change plus reinvestment of all dividends reported to shareholders, based on monthly granularity.
| | | | | | | | | | | | | | | | | | | | | | | | | | | | | | | | | | | | | | | | | |
| | | 2019 | | 2020 | | 2021 | | 2022 | | 2023 | | 2024 |
| Cleveland-Cliffs Inc. | Return % | | — | | | 77.46 | | | 49.52 | | | (26.00) | | | 26.75 | | | (53.97) | |
| Cumulative $ | | 100.00 | | 177.46 | | 265.34 | | 196.35 | | 248.87 | | 114.55 |
| S&P 500 Index | Return % | | — | | | 18.39 | | | 28.68 | | | (18.13) | | | 26.26 | | | 25.00 | |
| Cumulative $ | | 100.00 | | 118.39 | | 152.34 | | 124.72 | | 157.47 | | 196.84 |
| S&P Metals and Mining Select Industry Index | Return % | | — | | | 15.97 | | | 34.94 | | | 13.12 | | | 21.51 | | | (4.55) | |
| Cumulative $ | | 100.00 | | 115.97 | | 156.49 | | 177.02 | | 215.10 | | 205.31 |
| S&P MidCap 400 Index | Return % | | — | | | 13.65 | | | 24.73 | | | (13.10) | | | 16.39 | | | 13.89 | |
| Cumulative $ | | 100.00 | | | 113.65 | | 141.76 | | 123.19 | | 143.38 | | 163.30 |
ISSUER PURCHASES OF EQUITY SECURITIES
The following table presents information with respect to repurchases by the Company of our common shares during the periods indicated:
| | | | | | | | | | | | | | | | | | | | | | | | | | |
| Period | | Total Number of Shares (or Units) Purchased1 | | Average Price Paid per Share
(or Unit) | | Total Number of Shares (or Units) Purchased as Part of Publicly Announced Plans or Programs | | Maximum Number (or Approximate Dollar Value) of Shares (or Units) that May Yet be Purchased Under the Plans or Programs2 |
| October 1 - 31, 2024 | | 4,592 | | | $ | 12.43 | | | — | | | $ | 1,375,931,379 | |
| November 1 - 30, 2024 | | 353 | | | 12.58 | | | — | | | $ | 1,375,931,379 | |
| December 1 - 31, 2024 | | 730 | | | 12.31 | | | — | | | $ | 1,375,931,379 | |
| Total | | 5,675 | | | $ | 12.42 | | | — | | | |
| | | | | | | | |
1 All shares were delivered to us to satisfy tax withholding obligations due upon the vesting or payment of stock awards. |
2 On April 22, 2024, we announced that our Board of Directors authorized a program to repurchase our outstanding common shares in the open market or in privately negotiated transactions, which may include purchases pursuant to Rule 10b5-1 plans or accelerated share repurchases, up to a maximum of $1.5 billion. We are not obligated to make any repurchases, and the program may be suspended or discontinued at any time. The share repurchase program does not have a specific expiration date. |
| | |
|
| ITEM 7. MANAGEMENT'S DISCUSSION AND ANALYSIS OF FINANCIAL CONDITION AND RESULTS OF OPERATIONS |
Management's Discussion and Analysis of Financial Condition and Results of Operations is designed to provide a reader of our financial statements with a narrative from the perspective of management on our financial condition, results of operations, liquidity and other factors that may affect our future results. The following discussion should be read in conjunction with the consolidated financial statements and related notes that appear in Part II – Item 8. Financial Statements and Supplementary Data of this Annual Report on Form 10-K.
Management's Discussion and Analysis of Financial Condition and Results of Operations included in this report discusses our financial condition and results of operations as of and for the years ended December 31, 2024 and 2023. A discussion related to our financial condition and results of operations for 2023 as compared to 2022 can be found in Part II - Item 7. Management's Discussion and Analysis of Financial Condition and Results of Operations of our Annual Report on Form 10-K for the year ended December 31, 2023, filed with the SEC on February 8, 2024. OVERVIEW
Throughout 2024, we continued to position the Company for long-term success and further established ourselves as a leading North America based steel producer. We completed the Stelco Acquisition, which diversifies our end-markets, expands our geographical presence in Canada and incorporates Stelco's industry low-cost structure into our overall asset portfolio. We also announced new strategic initiatives that are expected to provide meaningful earnings improvement in years to come; reduced our operational costs; returned substantial capital to shareholders through share repurchases; and announced new GHG emissions reduction targets after achieving our prior commitments, all with an eye toward the future and in line with our consistent strategic objectives. The Stelco Acquisition, our operational achievements and strategic initiatives further strengthen our position as a North American leader in the steel industry and are expected to create value for all Company stakeholders.
2024 HIGHLIGHTS
•Record safety year since becoming a steel company with lowest Total Reportable Incident Rate of 0.9, which represents a 26% improvement from prior year
•Completed the Stelco Acquisition during the fourth quarter of 2024
•Further reduced unit costs year-over-year
•Returned $733 million in capital to shareholders through share repurchases
•Announced new GHG emissions reduction goals
•Selected by the DOE for award negotiations to receive up to $575 million for two decarbonization initiatives
•Announced $600 million of future annual EBITDA improvement from strategic projects expected to be completed by the end of 2029
•Announced project to develop new state-of-the-art electrical transformer production plant in Weirton, West Virginia
•Completed successful hydrogen injection trial at Indiana Harbor #7 blast furnace
We continued our best practices from both a safety and environmental standpoint. During 2024, our safety Total Reportable Incident Rate (including contractors) was 0.9 per 200,000 hours worked, the lowest since becoming a steel company in 2020.
Throughout 2024, we continued to focus on our goal of reducing GHG emissions with our optimal utilization of HBI and scrap throughout our facilities, as well as efficient power generation through recycling off-gases. In May 2024, we announced our commitment to new GHG emissions reductions targets after we successfully achieved our prior commitments set in 2021. We have also continued our partnerships with the DOE as part of the Better Climate Challenge initiative and the DOE Better Plants programs. We continue to evaluate opportunities such as carbon capture and the use of hydrogen within our facilities. With the U.S. government potentially awarding funding for the development of regional hydrogen hubs throughout the country, including near our largest facilities, we would be able to dramatically increase our use of hydrogen gas as both a reducing agent and energy source as the clean hydrogen production facilities come online and become commercially and economically viable. Additionally, we have continued forming partnerships to develop renewable and clean energy sources – such as wind, solar and hydrogen – which will benefit our own environmental footprint while combating the global impacts of climate change.
FINANCIAL SUMMARY
The following is a summary of our consolidated results for the years ended December 31, 2024, 2023 and 2022 (in millions, except for diluted EPS):
| | | | | | | | | | | | | | | | | | | | |
| Total Revenue | | Net Income | | Adjusted EBITDA | | Diluted EPS |
See "— Non-GAAP Financial Measures" below for a reconciliation of our Net income (loss) to Adjusted EBITDA.
ECONOMIC OVERVIEW
STEEL MARKET OVERVIEW
Steel market conditions in 2024 were driven by weaker than anticipated light vehicle production, lower demand and higher import levels. The price for domestic HRC, the most significant index impacting our revenues and profitability, averaged $772 per net ton for 2024, which was 15% lower than 2023 and the lowest annual average per net ton since 2020. Import levels were elevated in 2024, which contributed to downward pressure on HRC pricing. North American light vehicle production of 15.4 million units in 2024 was down from 15.7 million units in 2023 and significantly lower than the original expectation to exceed 16 million units. Looking forward, we expect domestic steel demand to grow as interest rates have started to decline, steel imports are currently unattractive, other end-user demand is improving, and incremental steel demand stimulated by recent government legislation and manufacturing on-shoring is realized.
The Infrastructure and Jobs Act, the CHIPS Act and the Inflation Reduction Act should provide meaningful support for overall domestic steel demand for years to come. Our extensive portfolio of products should result in increased steel demand from most of our end markets. As passed initially, the Infrastructure and Jobs Act includes approximately $550 billion of authorized spending for new investments and programs. This legislation provides direct spending support for roads, bridges and other infrastructure projects, including upgrades to the domestic power grid. The CHIPS Act promotes semiconductor manufacturing in the U.S., which should help support non-residential construction as well as machinery and equipment. The Inflation Reduction Act provides incentives for the use of domestic steel for investments in clean energy projects, including wind and solar projects, which consume a substantial amount of steel. Additionally, the on-shoring of manufacturing in the U.S. should prompt more domestic steel demand as well as reduce the risk of supply chain issues in the future.
OTHER KEY DRIVERS
The largest market for our steel products is the automotive industry in North America, which makes light vehicle production a key driver of demand. Light vehicle production in 2024 was well below initial expectations. North American light vehicle production in 2024 was 15.5 million units, down from 15.7 million units in 2023. North American light vehicle production in 2025 and beyond is expected to remain above 15 million units annually. During 2024, light vehicle sales in the U.S. saw an average seasonally adjusted annualized rate of 15.8 million units sold, representing a 2% increase compared to 2023. December 2024 seasonally adjusted annualized rate was 16.8 million units sold, the highest published rate since 2021, indicating healthy consumer demand. Additionally, the average age of light vehicles on the road in the U.S. is at an all-time high of 12.6 years, surpassing the previous record set in 2023, which should support demand as older vehicles need to be replaced. As a leading supplier of automotive-grade steel in the U.S., we expect to benefit from healthy vehicle production over the coming years.
Since 2021, the price for busheling scrap, a necessary input for flat-rolled steel production in EAFs in the U.S., has continued to average well above the prior annual ten-year average of approximately $400 per long ton. The busheling price averaged $429 per long ton during 2024. We expect the supply of busheling scrap to further tighten due to decreasing prime scrap generation from original equipment manufacturers and the growth of EAF capacity in the U.S., reduced metallics import availability, and a push for expanded scrap use globally. As we are fully integrated and have primarily a blast furnace footprint, increased prices for busheling scrap in the U.S. bolster our competitive advantage, as we source the majority of our iron feedstock from our stable-cost mining and pelletizing operations in Minnesota and Michigan.
As for iron ore, the Platts 62% price averaged $109 per metric ton in 2024, which is 15% higher than the prior annual ten-year average. While higher iron ore prices play a role in increased steel prices, we also directly benefit from higher iron ore prices for the portion of iron ore pellets we sell to third parties.
OTHER FACTORS
On February 10, 2025, President Donald Trump signed an executive order to implement 25% tariffs on all steel imports without exceptions or exemptions, beginning March 2025. We expect these steel tariffs will help level the playing field against countries that have long taken advantage of the domestic steel market. A level playing field in steel, along with President Trump's pro-manufacturing and America-first agenda, should support a healthy domestic steel environment for years to come.
On April 4, 2024, the DOE issued its final transformer efficiency standards rule that will provide for the continued utilization of GOES in virtually all of our distribution transformer end markets. With the revised rule, the DOE acknowledged the fundamental importance of GOES and the essential role played by our steel plants in Butler, Pennsylvania and Zanesville, Ohio in effectively sustaining the functionality of the U.S. electric grid. The originally proposed distribution transformer rule would have required the use of amorphous metal in nearly all transformer production in the U.S., putting demand for our GOES product at serious risk. The final rule provides clarity going forward on production requirements, allowing for increased investments in the transformer market, such as our announced project at Weirton, which should ultimately lead to increased GOES demand.
During 2024, we continued our cost cutting efforts, which began in 2023, further reducing our year-over-year cost per ton as we worked through higher cost inventory and lower natural gas, coal and alloy costs mitigated any inflationary cost increases.
STEELMAKING RESULTS
COMPARISON OF 2024 TO 2023
The following is a summary of the Steelmaking segment operating results, net of intersegment eliminations, for the years ended December 31, 2024 and 2023 (dollars in millions, except for average selling price and shipments in thousands of net tons):
| | | | | | | | | | | | | | | | | | | | |
| Total Revenue | | Gross Margin | | Adjusted EBITDA | | Steel Shipments (nt) |
| | | | | | | | | | | | | | | | | | | | | | | | | | | | | | | | |
| 2023 | 2024 | | 2023 | 2024 | | 2023 | 2024 | | 2023 | 2024 |
| | | | | | |
| STEEL PRODUCT REVENUE: | | GROSS MARGIN %: | | ADJUSTED EBITDA %: | | AVERAGE SELLING PRICE PER TON OF STEEL PRODUCTS: |
| $19,237 | $16,865 | | 6% | —% | | 9% | 4% | | $1,171 | $1,081 |
REVENUE
The following tables represent our steel shipments by product and total revenues by market:
| | | | | | | | | | | | | | | | | | | |
| Year Ended December 31, | | |
| (In thousands of net tons) | 2024 | | 2023 | | % Change |
| Steel shipments by product: | | | | | | | |
| Hot-rolled steel | 5,593 | | | | 5,899 | | | | (5) | % |
| Cold-rolled steel | 2,524 | | | | 2,389 | | | | 6 | % |
| Coated steel | 4,477 | | | | 4,791 | | | | (7) | % |
| Stainless and electrical steel | 567 | | | | 682 | | | | (17) | % |
| Plate | 755 | | | | 899 | | | | (16) | % |
| Slab and other steel products | 1,680 | | | | 1,772 | | | | (5) | % |
| Total steel shipments | 15,596 | | | | 16,432 | | | | (5) | % |
| | | | | | | |
| Year Ended December 31, | | |
| (In millions) | 2024 | | 2023 | | % Change |
| Steelmaking revenues by market: | | | | | | | |
| Direct automotive | $ | 5,571 | | | | $ | 7,440 | | | | (25) | % |
| Infrastructure and manufacturing | 5,208 | | | | 5,612 | | | | (7) | % |
| Distributors and converters | 5,281 | | | | 5,330 | | | | (1) | % |
| Steel producers | 2,469 | | | | 2,949 | | | | (16) | % |
| Total Steelmaking revenues | $ | 18,529 | | | | $ | 21,331 | | | | (13) | % |
Revenues from our Steelmaking segment decreased by 13% during the year ended December 31, 2024, as compared to the prior year, primarily due to:
•A decrease of $1.9 billion, or 25%, in revenues from the direct automotive market, predominantly due to a decrease in demand;
•A decrease of $404 million, or 7%, in revenues from the infrastructure and manufacturing market, predominantly due to a decrease in steel index pricing; and
•A decrease of $480 million, or 16%, in revenues from the steel producers market, predominantly due to the decrease in pricing indices for slabs and busheling scrap.
GROSS MARGIN
Gross margin from our Steelmaking segment decreased by $1.3 billion, during the year ended December 31, 2024, as compared to the prior year, primarily due to:
•A decrease in average selling price (approximately $775 million impact), predominantly due to lower spot prices and lower direct automotive mix; and
•A decrease in sales volume (approximately $500 million impact).
ADJUSTED EBITDA
Adjusted EBITDA from our Steelmaking segment for the year ended December 31, 2024, decreased by $1.1 billion, as compared to 2023, due to the decreased gross margin from our operations. Additionally, our Steelmaking Adjusted EBITDA included $457 million and $549 million of Selling, general and administrative expenses for the years ended December 31, 2024 and 2023, respectively.
CONSOLIDATED RESULTS
COMPARISON OF 2024 TO 2023
REVENUES AND GROSS MARGIN
During the year ended December 31, 2024, our consolidated Revenues decreased by $2.8 billion, as compared to 2023. The decrease was primarily due to the decrease in the average steel product selling price of $90 per net ton and a decrease of 0.8 million net tons of steel shipments from our Steelmaking segment.
During the year ended December 31, 2024, our consolidated gross margin decreased by $1.3 billion, as compared to 2023. See "— Steelmaking Results" above for further detail on our operating results.
SELLING, GENERAL AND ADMINISTRATIVE EXPENSES
Selling, general and administrative expenses decreased by $91 million during the year ended December 31, 2024, as compared to 2023. The decrease primarily relates to employment-related costs due to lower incentive compensation.
RESTRUCTURING AND OTHER CHARGES & ASSET IMPAIRMENT
On February 15, 2024, we announced the indefinite idle of our Weirton tinplate production plant. This resulted in restructuring and other charges primarily related to severance, other employee-related benefits and asset retirement obligation charges of $129 million for the year ended December 31, 2024. Additionally, this resulted in an asset impairment of $79 million for year ended December 31, 2024.
ACQUISITION-RELATED COSTS
The increase of Acquisition-related costs primarily relates to third-party expenses associated with the Stelco Acquisition in 2024. Refer to NOTE 3 - ACQUISITIONS for further information.
GOODWILL IMPAIRMENT
In 2023, our annual goodwill impairment analysis resulted in an impairment charge of $125 million for goodwill related to our Tooling and Stamping reporting unit.
MISCELLANEOUS – NET
Miscellaneous expense increased by $88 million for the year ended December 31, 2024, as compared to 2023. The increase in miscellaneous expense for the year ended December 31, 2024 was primarily related to a $63 million gain on sale of business in 2023, which was not repeated in 2024. Additionally, to a lesser extent, this increase was also due to higher currency exchange expense, primarily related to routine remeasurement of an intercompany note with our Stelco subsidiary during 2024.
INTEREST EXPENSE, NET
During the year ended December 31, 2024, our consolidated Interest expense, net increased by $81 million compared to 2023. The increase primarily relates to increased interest incurred on outstanding borrowings, year over year, as well as fees incurred in 2024 associated with financing arrangements undertaken in connection with the Stelco Acquisition.
LOSS ON EXTINGUISHMENT OF DEBT
During the year ended December 31, 2024, our consolidated Loss on extinguishment of debt increased by $27 million compared to 2023. The increase entirely relates to the repurchase of $829 million aggregate principal amount of our then-outstanding 6.750% 2026 Senior Secured Notes. Refer to NOTE 8 - DEBT AND CREDIT FACILITIES for further information.
NET PERIODIC BENEFIT CREDITS OTHER THAN SERVICE COST COMPONENT
During the year ended December 31, 2024, our consolidated Net periodic benefit credits other than service cost component increased $43 million compared to 2023. This increase primarily relates to an increase in actuarial gains reclassified from AOCI to net income and a decrease in interest cost year over year. Refer to NOTE 9 - PENSIONS AND OTHER POSTRETIREMENT BENEFITS for further information.
OTHER NON-OPERATING INCOME (LOSS)
During the year ended December 31, 2024, our consolidated Other non-operating income (loss) decreased by $42 million compared to 2023. The decrease primarily relates to a loss recorded in 2024 as a result of a fair value adjustment of the MinnTac option, as well as a loss recorded on foreign currency contracts obtained in connection with financing the Stelco Acquisition. Refer to NOTE 14 - FAIR VALUE OF FINANCIAL INSTRUMENTS and NOTE 15 - DERIVATIVE INSTRUMENTS AND HEDGING for further information.
INCOME TAXES
Our effective tax rate is impacted by state income taxes and permanent items, primarily depletion. It also is affected by discrete items that may occur in any given period but are not consistent from period to period. The following represents a summary of our tax provision and corresponding effective rates:
| | | | | | | | | | | |
| Year Ended December 31, |
| (In millions) | 2024 | | 2023 |
| Income tax benefit (expense) | $ | 235 | | | $ | (148) | |
| Effective tax rate | 25 | % | | 25 | % |
A reconciliation of our income tax attributable to continuing operations compared to the U.S. federal statutory rate is as follows:
| | | | | | | | | | | | | | | | | | | | | | | | | | | |
| Year Ended December 31, | | | | |
| (In millions) | 2024 | | 2023 | | |
| Tax at U.S. statutory rate | $ | (198) | | | 21 | % | | $ | 125 | | | 21 | % | | | | |
| Increase (decrease) due to: | | | | | | | | | | | |
| Percentage depletion in excess of cost depletion | (20) | | | 2 | | | (32) | | | (5) | | | | | |
| | | | | | | | | | | |
| | | | | | | | | | | |
| | | | | | | | | | | |
| | | | | | | | | | | |
| Valuation allowance | — | | | — | | | 14 | | | 2 | | | | | |
| Unrecognized tax benefits | 7 | | | — | | | 7 | | | 1 | | | | | |
| State taxes, net | (30) | | | 3 | | | 28 | | | 5 | | | | | |
| Federal & state provision to return | (4) | | | — | | | (20) | | | (3) | | | | | |
| Income not subject to tax | (10) | | | 1 | | | (11) | | | (2) | | | | | |
| Goodwill impairment | — | | | — | | | 26 | | | 4 | | | | | |
| Other items, net | 20 | | | (2) | | | 11 | | | 2 | | | | | |
| Provision for income tax (benefit) expense and effective income tax rate including discrete items | $ | (235) | | | 25 | % | | $ | 148 | | | 25 | % | | | | |
The increase in income tax benefit in 2024, as compared to income tax expense in 2023, is predominantly related to the decrease in the pre-tax book income year-over-year. See NOTE 11 - INCOME TAXES for further information.
CASH FLOW, LIQUIDITY AND CAPITAL RESOURCES
OVERVIEW
Our capital allocation decision-making process is focused on preserving healthy liquidity levels, strengthening our balance sheet, and creating financial flexibility to manage through the cyclical demand for our products and volatility in commodity prices. We are focused on maximizing the cash generation of our operations, reducing debt, returning capital to shareholders and aligning capital investments with our strategic priorities and the requirements of our business plan, including regulatory and permission-to-operate related projects.
The following table provides a summary of our cash flow:
| | | | | | | | | | | |
| Year Ended December 31, |
| (In millions) | 2024 | | 2023 |
| Cash flows provided by (used in): | | | |
| Operating activities | $ | 105 | | | $ | 2,267 | |
| Investing activities | (3,212) | | | (591) | |
| Financing activities | 2,970 | | | (1,504) | |
| Net increase (decrease) in cash and cash equivalents | $ | (137) | | | $ | 172 | |
| | | |
Free cash flow1 | $ | (590) | | | $ | 1,621 | |
| | | |
1See "— Non-GAAP Financial Measures" for a reconciliation of our free cash flow. |
The market environment in 2024 provided us the ability to take advantage of favorable debt markets and return capital to shareholders, as follows:
•During the first quarter of 2024, we issued $825 million aggregate principal amount of our 7.000% 2032 Senior Notes at par. A portion of the net proceeds from the 7.000% 2032 Senior Notes issuance was used to repurchase our 6.750% 2026 Senior Secured Notes. We no longer have any secured notes outstanding.
•During the second half of 2024, we issued an additional $600 million aggregate principal amount of our 7.000% 2032 Senior Notes at 99.25% of their principal amount, $900 million aggregate principal amount of 6.875% Senior Notes due 2029 at par, and $900 million aggregate principal amount of 7.375% Senior Notes due 2033 at par. The net proceeds from these transactions were used to finance a portion of the cash consideration payable in connection with the Stelco Acquisition, which we completed on November 1, 2024.
•During the first quarter of 2025, we issued $850 million aggregate principal amount of 7.500% Senior Notes due 2031 at par. The net proceeds will be used for general corporate purposes, including the repayment of borrowings under our ABL Facility.
•Additionally, during the year ended December 31, 2024, we returned capital to shareholders through our share repurchase programs, repurchasing 37.9 million common shares at a cost of $733 million in the aggregate.
Our financial flexibility has allowed us to remain active in our opportunistic pursuit of value-enhancing mergers and acquisitions. During 2024, we completed the Stelco Acquisition, which diversifies our end markets, expands our geographical presence in Canada and incorporates Stelco's industry low-cost structure into our overall asset portfolio. We have a track record of demonstrating that we can quickly deleverage our balance sheet following prior acquisitions. We expect to generate healthy free cash flow in the coming years and intend to utilize it to deleverage our balance sheet following the Stelco Acquisition. Going forward, we will continue to use the financial levers available to us in order to continue to pursue assets that would grow our business, reduce our debt, and return capital to shareholders.
CASH FLOWS
OPERATING ACTIVITIES
| | | | | | | | | | | | | | | | | |
| Year Ended December 31, | | |
| (In millions) | 2024 | | 2023 | | Variance |
| Net income (loss) | $ | (708) | | | $ | 450 | | | $ | (1,158) | |
| Non-cash adjustments to net income (loss) | 1,030 | | | 1,125 | | | (95) | |
| Income taxes | (17) | | | 122 | | | (139) | |
| Pension and OPEB payments and contributions | (195) | | | (94) | | | (101) | |
| Working capital (receivables, inventories, payables and other liabilities) | (5) | | | 664 | | | (669) | |
| Net cash provided by operating activities | $ | 105 | | | $ | 2,267 | | | $ | (2,162) | |
The variance was driven by:
•A $1.3 billion decrease in net income after adjustments for non-cash items due to lower gross margins resulting from a decrease in selling prices and sales volumes for our steel products. See "— Steelmaking Results" above for further detail on our operating results.
•A $669 million decrease in cash provided for working capital is primarily related to ending inventory levels remaining consistent year over year. This differs from the prior year when inventory levels decreased significantly. This prior year decrease was primarily the result of lower costs of steel, driven by higher production, cost control and lower raw material costs.
INVESTING ACTIVITIES
| | | | | | | | | | | | | | | | | |
| Year Ended December 31, | | |
| (In millions) | 2024 | | 2023 | | Variance |
| Purchase of property, plant and equipment | $ | (695) | | | $ | (646) | | | $ | (49) | |
| Acquisitions, net of cash acquired | (2,512) | | | — | | | (2,512) | |
| Other | (5) | | | 55 | | | (60) | |
| Net cash used by investing activities | $ | (3,212) | | | $ | (591) | | | $ | (2,621) | |
The variance was driven by:
•A $2.5 billion increase in cash used for acquisitions, net of cash acquired related to the Stelco Acquisition, which was completed on November 1, 2024. Refer to NOTE 3 - ACQUISITIONS for further information.
FINANCING ACTIVITIES
| | | | | | | | | | | | | | | | | |
| Year Ended December 31, | | |
| (In millions) | 2024 | | 2023 | | Variance |
| Net borrowings (repayments) of debt | $ | 2,376 | | | $ | 750 | | | $ | 1,626 | |
| Net borrowings (repayments) under credit facilities | 1,560 | | | (1,864) | | | 3,424 | |
| Repurchase of common shares | (733) | | | (152) | | | (581) | |
| Other | (233) | | | (238) | | | 5 | |
| Net cash used by financing activities | $ | 2,970 | | | $ | (1,504) | | | $ | 4,474 | |
The variance was driven by:
•A $5.1 billion increase in cash provided from net borrowings on both debt and under credit facilities, primarily related to the issuance of 7.000% 2032 Senior Notes, 6.875% 2029 Senior Notes and 7.375% 2033 Senior Notes and additional borrowings on the ABL Facility. Approximately $2.5 billion of the net borrowings were utilized to finance the Stelco Acquisition, completed on November 1, 2024. We also used a portion of the net proceeds to repurchase $829 million in aggregate principal amount of our 6.750% 2026 Secured Senior Notes. This variance was partially offset by a $581 million increase in cash used to repurchase common shares during the year ended December 31, 2024.
LIQUIDITY AND CAPITAL RESOURCES
Our primary sources of liquidity are Cash and cash equivalents, cash generated from our operations, availability under the ABL Facility and access to capital markets. Cash and cash equivalents, which totaled $54 million as of December 31, 2024, include cash on hand and on deposit, as well as short-term securities held for the primary purpose of general liquidity. The combination of cash and availability under our ABL Facility equated to $2.6 billion in liquidity as of December 31, 2024. During 2024, we issued $1.4 billion in aggregate principal amount of 7.000% 2032 Senior Notes, $900 million in aggregate principal amount of 6.875% 2029 Senior Notes, and $900 million in aggregate principal amount of 7.375% 2033 Senior Notes. We used a portion of the net proceeds from the initial offering of the 7.000% 2032 Senior Notes and available liquidity to repurchase $829 million in aggregate principal amount of our 6.750% 2026 Secured Senior Notes pursuant to a tender offer and subsequent redemption. We used remaining net proceeds of the debt issuances to finance a portion of the Stelco Acquisition. We believe our liquidity and access to capital markets will be adequate to fund our cash requirements for the next 12 months and for the foreseeable future.
Our ABL Facility, which matures in June 2028, has a maximum borrowing base of $4.75 billion. The available borrowing base is determined by applying customary advance rates to eligible accounts receivable, inventory and certain mobile equipment. Our ABL Facility includes a $555 million sublimit for the issuance of letters of credit and a $200 million sublimit for swingline loans. As of December 31, 2024, outstanding letters of credit totaled $62 million, which reduced availability. We issue standby letters of credit with certain financial institutions in order to support business obligations, including, but not limited to, workers' compensation, operating agreements, employee severance, environmental obligations and insurance. Our ABL Facility agreement contains various financial and other covenants. As of December 31, 2024, we were in compliance with all of our ABL Facility covenants.
We have the capability to issue additional unsecured notes and, subject to the limitations set forth in our existing senior notes indentures and ABL Facility, additional secured debt, if we elect to access the debt capital markets. On February 6, 2025, we issued $850 million aggregate principal amount of 7.500% Senior Notes due 2031 at par. The net proceeds will be used for general corporate purposes, including the repayment of borrowings under our ABL Facility. However, our ability to issue additional notes could be limited by market conditions. We intend from time to time to seek to redeem or repurchase our outstanding senior notes with cash on hand, borrowings from existing credit sources or new debt financings and/or exchanges for debt or equity securities, in open market purchases, privately negotiated transactions or otherwise. Such redemptions or repurchases, if any, will depend on prevailing market conditions, our liquidity requirements, contractual restrictions and other factors, and the amounts involved may be material.
Refer to NOTE 8 - DEBT AND CREDIT FACILITIES and NOTE 21 - SUBSEQUENT EVENTS for further information on our ABL Facility and debt.
MATERIAL CASH REQUIREMENTS
We have material cash requirements for known contractual obligations and commitments for the following:
CAPITAL EXPENDITURES
We anticipate total cash used for capital expenditures during the next 12 months to be approximately $700 million, which primarily consists of sustaining capital spend of approximately $600 million, including Stelco, as well as initial spend on our capital projects at Middletown Works, Butler Works and Weirton. Each of these three capital projects are expected to be value-adding growth projects that have governmental support.
DEBT
We have principal long-term debt of $7.1 billion with maturities starting in 2027. Refer to NOTE 8 - DEBT AND CREDIT FACILITIES for further information on our long-term debt and interest.
LEASE OBLIGATIONS
We have future minimum lease payments under noncancellable finance and operating leases. As of December 31, 2024, the current and non-current liabilities for our lease obligations were $113 million and $594 million, respectively. Refer to NOTE 12 - LEASE OBLIGATIONS for further information.
POST-RETIREMENT EMPLOYEE BENEFITS
We make both required and discretionary pension contributions. Required contributions are based on minimum funding requirements pursuant to ERISA regulations. We expect to make $69 million in pension contributions and payments in 2025, which is down from $119 million in 2024. The cash requirements for our OPEB plans consist of VEBA contributions and direct payments from corporate assets primarily for medical and drug costs. We expect to make $74 million in OPEB contributions and net payments from corporate assets in 2025, which is down from $76 million in 2024. Contributions and payments in future years can significantly change and will depend on the actual returns on assets, discount rates, actual health care trend rates, government regulations, changes to employee benefits through labor agreements and other demographic factors. Refer to NOTE 9 - PENSIONS AND OTHER POSTRETIREMENT BENEFITS for further information.
ENVIRONMENTAL AND ASSET RETIREMENT OBLIGATIONS
Refer to NOTE 13 - ASSET RETIREMENT AND ENVIRONMENTAL OBLIGATIONS for further information on our environmental and asset retirement obligations.
SHARE REPURCHASE PROGRAM
On April 22, 2024, our Board of Directors authorized a program to repurchase our outstanding common shares in the open market or in privately negotiated transactions, which may include purchases pursuant to Rule 10b5-1 plans or accelerated share repurchases, up to a maximum of $1.5 billion. We are not obligated to make any repurchases, and the program may be suspended or discontinued at any time. The share repurchase program does not have a specific expiration date. As of December 31, 2024, there was $1.4 billion remaining authorization under the share repurchase program.
OFF-BALANCE SHEET ARRANGEMENTS
In the normal course of business, we are a party to certain off-balance sheet arrangements that are not reflected on our Statements of Consolidated Financial Position. These arrangements include unconditional purchase obligations, surety bonds and letters of credit. Our unconditional purchase obligations include minimum "take or pay" commitments, such as minimum electric power demand charges, minimum coal, diesel and natural gas purchase commitments, minimum railroad transportation commitments and minimum port facility usage commitments.
We use surety bonds and letters of credit to provide financial assurance for certain obligations. As of December 31, 2024, we had $271 million of outstanding surety bonds and surety-backed letters of credit. The use of surety bonds and surety-backed letters of credit has no impact on our liquidity. Additionally, as of December 31, 2024, we had $62 million of outstanding letters of credit issued under our ABL Facility, which reduced our availability thereunder.
Refer to NOTE 20 - COMMITMENTS AND CONTINGENCIES for further information on our unconditional purchase obligations, surety bonds and surety-backed letters of credit.
NON-GAAP FINANCIAL MEASURES
The following provides a description and reconciliation of each of our non-GAAP financial measures to its most directly comparable respective GAAP measure. The presentation of these measures is not intended to be considered in isolation from, as a substitute for, or as superior to, the financial information prepared and presented in accordance with GAAP. The presentation of these measures may be different from non-GAAP financial measures used by other companies.
ADJUSTED EBITDA
We evaluate performance on an operating segment basis, as well as a consolidated basis, based on Adjusted EBITDA, which is a non-GAAP measure. This measure is used by management, investors, lenders and other external users of our financial statements to assess our operating performance and to compare operating performance to other companies in the steel industry. In addition, management believes Adjusted EBITDA is a useful measure to assess the earnings power of the business without the impact of capital structure and can be used to assess our ability to service debt and fund future capital expenditures in the business.
The following table provides a reconciliation of our Net income (loss) to Adjusted EBITDA:
| | | | | | | | | | | | | | | | | |
| Year Ended December 31, |
| (In millions) | 2024 | | 2023 | | 2022 |
| Net income (loss) | $ | (708) | | | $ | 450 | | | $ | 1,376 | |
| Less: | | | | | |
| Interest expense, net | (370) | | | (289) | | | (276) | |
| Income tax benefit (expense) | 235 | | | (148) | | | (423) | |
| Depreciation, depletion and amortization | (951) | | | (973) | | | (1,034) | |
| Total EBITDA | $ | 378 | | | $ | 1,860 | | | $ | 3,109 | |
| Less: | | | | | |
EBITDA from noncontrolling interests1 | $ | 76 | | | $ | 83 | | | $ | 74 | |
| Weirton indefinite idle | (217) | | | — | | | — | |
| Arbitration decision | (71) | | | — | | | — | |
| Acquisition-related costs | (44) | | | (12) | | | (1) | |
| Changes in fair value of derivatives, net | (41) | | | — | | | — | |
| Loss on extinguishment of debt | (27) | | | — | | | (75) | |
| Amortization of inventory step-up | (26) | | | — | | | — | |
| Loss on currency exchange | (20) | | | — | | | — | |
| Loss on disposal of assets | (16) | | | (15) | | | (22) | |
| Goodwill impairment | — | | | (125) | | | — | |
| Other, net | (16) | | | 18 | | | (36) | |
| Total Adjusted EBITDA | $ | 780 | | | $ | 1,911 | | | $ | 3,169 | |
| | | | | |
1 EBITDA of noncontrolling interests includes the following: | | | | | |
| Net income attributable to noncontrolling interests | $ | 46 | | | $ | 51 | | | $ | 41 | |
| Depreciation, depletion and amortization | 30 | | | 32 | | | 33 | |
| EBITDA of noncontrolling interests | $ | 76 | | | $ | 83 | | | $ | 74 | |
The following table provides a summary of our Adjusted EBITDA by segment:
| | | | | | | | | | | |
| Year Ended December 31, |
| (In millions) | 2024 | | 2023 |
| Adjusted EBITDA: | | | |
| Steelmaking | $ | 722 | | | $ | 1,873 | |
| Other Businesses | 53 | | | 43 | |
| Intersegment Eliminations | 5 | | | (5) | |
| Total Adjusted EBITDA | $ | 780 | | | $ | 1,911 | |
FREE CASH FLOW
Free cash flow is a non-GAAP measure defined as operating cash flow less purchase of property, plant and equipment. Management believes it is an important measure to assess the cash generation available to service debt, strategic initiatives or other financing activities.
The following table provides a reconciliation of our Net cash provided by operating activities to free cash flow:
| | | | | | | | | | | |
| Year Ended December 31, |
| (In millions) | 2024 | | 2023 |
| Net cash provided by operating activities | $ | 105 | | | $ | 2,267 | |
| Purchase of property, plant and equipment | (695) | | | (646) | |
| Free cash flow | $ | (590) | | | $ | 1,621 | |
INFORMATION ABOUT OUR GUARANTORS AND THE ISSUER OF OUR GUARANTEED SECURITIES
The accompanying summarized financial information has been prepared and presented pursuant to SEC Regulation S-X, Rule 3-10, “Financial Statements of Guarantors and Issuers of Guaranteed Securities Registered or Being Registered,” and Rule 13-01 "Financial Disclosures about Guarantors and Issuers of Guaranteed Securities and Affiliates Whose Securities Collateralized a Registrant's Securities." Certain of our subsidiaries (the "Guarantor subsidiaries") as of December 31, 2024 have fully and unconditionally, and jointly and severally, guaranteed the obligations under the 5.875% 2027 Senior Notes, the 7.000% 2027 Senior Notes, the 4.625% 2029 Senior Notes, the 6.875% 2029 Senior Notes, the 6.750% 2030 Senior Notes, the 4.875% 2031 Senior Notes, the 7.000% 2032 Senior Notes and the 7.375% 2033 Senior Notes issued by Cleveland-Cliffs Inc. on a senior unsecured basis. See NOTE 8 - DEBT AND CREDIT FACILITIES for further information.
The following presents the summarized financial information on a combined basis for Cleveland-Cliffs Inc. (parent company and issuer of the guaranteed obligations) and the Guarantor subsidiaries, collectively referred to as the obligated group. Transactions between the obligated group have been eliminated. Information for the non-Guarantor subsidiaries was excluded from the combined summarized financial information of the obligated group.
Each Guarantor subsidiary is consolidated by Cleveland-Cliffs Inc. as of December 31, 2024. Refer to Exhibit 22, incorporated herein by reference, for the detailed list of entities included within the obligated group as of December 31, 2024. As of December 31, 2024, the guarantee of a Guarantor subsidiary with respect to the 5.875% 2027 Senior Notes, the 7.000% 2027 Senior Notes, the 4.625% 2029 Senior Notes, the 6.875% 2029 Senior Notes, the 6.750% 2030 Senior Notes, the 4.875% 2031 Senior Notes, the 7.000% 2032 Senior Notes and the 7.375% 2033 Senior Notes will be automatically and unconditionally released and discharged, and such Guarantor subsidiary’s obligations under the guarantee and the related indentures (the “Indentures”) will be automatically and unconditionally released and discharged, upon the occurrence of any of the following, along with the delivery to the trustee of an officer’s certificate and an opinion of counsel, each stating that all conditions precedent provided for in the applicable Indenture relating to the release and discharge of such Guarantor subsidiary’s guarantee have been complied with:
(a) any sale, exchange, transfer or disposition of such Guarantor subsidiary (by merger, consolidation, or the sale of) or the capital stock of such Guarantor subsidiary after which the applicable Guarantor subsidiary is no longer a subsidiary of the Company or the sale of all or substantially all of such Guarantor subsidiary’s assets (other than by lease), whether or not such Guarantor subsidiary is the surviving entity in such transaction, to a person which is not the Company or a subsidiary of the Company; provided that (i) such sale, exchange, transfer or disposition is made in compliance with the applicable Indenture, including the covenants regarding consolidation, merger and sale of assets and, as applicable, dispositions of assets that constitute notes collateral, and (ii) all the obligations of such Guarantor subsidiary under all debt of the Company or its subsidiaries terminate upon consummation of such transaction;
(b) designation of any Guarantor subsidiary as an “excluded subsidiary” (as defined in the Indentures); or
(c) defeasance or satisfaction and discharge of the Indentures.
Each entity in the summarized combined financial information follows the same accounting policies as described in the consolidated financial statements. The accompanying summarized combined financial information does not reflect investments of the obligated group in non-Guarantor subsidiaries. The financial information of the obligated group is presented on a combined basis; intercompany balances and transactions within the obligated group have been eliminated. The obligated group's amounts due from, amounts due to, and transactions with, non-Guarantor subsidiaries and related parties have been presented in separate line items.
SUMMARIZED COMBINED FINANCIAL INFORMATION OF THE ISSUER AND GUARANTOR SUBSIDIARIES
The following table is summarized combined financial information from the Statements of Condensed Consolidated Financial Position of the obligated group:
| | | | | | | |
| December 31, |
| (In millions) | 2024 | | |
| Current assets | $ | 6,463 | | | |
| Non-current assets | 11,856 | | | |
| Current liabilities | (4,121) | | | |
| Non-current liabilities | (9,241) | | | |
| | | |
The following table is summarized combined financial information from the Statements of Condensed Consolidated Operations of the obligated group:
| | | | | |
| Year Ended |
| (In millions) | December 31, 2024 |
| Revenues | $ | 18,518 | |
| Cost of goods sold | (18,530) | |
| Loss from continuing operations | (710) | |
| Net loss | (707) | |
| Net loss attributable to Cliffs shareholders | (707) | |
As of December 31, 2024, the obligated group had the following balances with non-Guarantor subsidiaries and other related parties:
| | | | | | | |
| December 31, |
| (In millions) | 2024 | | |
| Balances with non-Guarantor subsidiaries: | | | |
| Accounts receivable, net | $ | 755 | | | |
| Accounts payable | (1,279) | | | |
| | | |
| Balances with other related parties: | | | |
| Accounts receivable, net | $ | 9 | | | |
| | | |
| Accounts payable | (20) | | | |
| | | |
Additionally, for the year ended December 31, 2024, the obligated group had Revenues of $81 million and Cost of goods sold of $66 million, in each case with other related parties.
MARKET RISKS
We are subject to a variety of risks, including those caused by changes in commodity prices and interest rates. We have established policies and procedures to manage such risks; however, certain risks are beyond our control.
PRICING RISKS
In the ordinary course of business, we are exposed to market risk and price fluctuations related to the sale of our products, which are impacted primarily by market prices for HRC and other related spot pricing indices, and the purchase of energy and raw materials used in our operations, which are impacted by market prices for natural gas, electricity, ferrous and stainless steel scrap, metallurgical coal, coke, zinc, chrome, nickel and other alloys. Our strategy to address market risk has generally been to obtain competitive prices for our products and services and allow operating results to reflect market price movements dictated by supply and demand; however, we make forward physical purchases and enter into hedge contracts to manage exposure to price risk related to the purchases of certain raw materials and energy used in the production process.
Our financial results can vary for our operations as a result of fluctuations in market prices. We attempt to mitigate these risks by aligning fixed and variable components in our customer pricing contracts, supplier purchasing agreements and derivative instruments.
Some customer contracts have fixed pricing terms, which increase our exposure to fluctuations in raw material and energy costs. To reduce our exposure, we enter into annual, fixed price agreements for certain raw materials. Some of our existing multi-year raw material supply agreements have required minimum purchase quantities. Under adverse economic conditions, those minimums may exceed our needs. Absent exceptions for force majeure and other circumstances affecting the legal enforceability of the agreements, these minimum purchase requirements may compel us to purchase quantities of raw materials that could significantly exceed our anticipated needs or pay damages to the supplier for shortfalls. In these circumstances, we would attempt to negotiate agreements for new purchase quantities. There is a risk, however, that we would not be successful in reducing purchase quantities, either through negotiation or litigation. If that occurred, we would likely be required to purchase more of a particular raw material in a particular year than we need, negatively affecting our results of operations and cash flows.
Certain of our customer contracts include variable-pricing mechanisms that adjust selling prices in response to changes in the costs of certain raw materials and energy, while other of our customer contracts exclude such mechanisms. We may enter into multi-year purchase agreements for certain raw materials with similar variable-price mechanisms, allowing us to achieve natural hedges between the customer contracts and supplier purchase agreements. Therefore, in some cases, price fluctuations for energy (particularly natural gas and electricity), raw materials (such as scrap, chrome, zinc and nickel) or other commodities may be, in part, passed on to customers rather than absorbed solely by us. There is a risk, however, that the variable-price mechanisms in the sales contracts may not necessarily change in tandem with the variable-price mechanisms in our purchase agreements, negatively affecting our results of operations and cash flows.
Our strategy to address volatile natural gas rates and electricity rates includes improving efficiency in energy usage, identifying alternative providers and utilizing the lowest cost alternative fuels. If we are unable to align fixed and variable components between customer contracts and supplier purchase agreements, we routinely evaluate the use of derivative instruments to hedge market risk. As a result, we use cash-settled commodity price swaps to hedge a portion of our exposure from our natural gas and electricity requirements. Our hedging strategy is designed to protect us from excessive pricing volatility. However, since we do not typically hedge 100% of our exposure, abnormal price increases in any of these commodity markets might still negatively affect operating costs.
The following table summarizes the negative effect of a hypothetical change in the fair value of our derivative instruments outstanding as of December 31, 2024, due to a 10% and 25% change in the market price of each of the indicated commodities:
| | | | | | | | | | | | | | |
| | (In millions) |
| Commodity Derivative | | 10% Change | | 25% Change |
| Natural gas | | $ | 53 | | | $ | 133 | |
| Electricity | | 15 | | | 37 | |
| | | | |
| | | | |
Any resulting changes in fair value would be recorded as adjustments to AOCI, net of income taxes, or recognized in net earnings, as appropriate. These hypothetical losses would be partially offset by the benefit of lower prices paid for the related commodities.
VALUATION OF GOODWILL AND OTHER LONG-LIVED ASSETS
GOODWILL
We assign goodwill arising from acquired companies to the reporting units that are expected to benefit from the synergies of the acquisition. Goodwill is tested on a qualitative or quantitative basis for impairment at the reporting unit level on an annual basis (October 1) and between annual tests if an event occurs or circumstances change that would more likely than not reduce the fair value of a reporting unit below its carrying value. These events or circumstances could include a significant change in the business climate, legal factors, operating performance indicators, competition, or sale or disposition of a significant portion of a reporting unit. We have an unconditional option to bypass the qualitative test for any reporting unit in any period and proceed directly to performing the quantitative test. Should our qualitative test indicate that it is more likely than not that the fair value of a reporting unit is less than its carrying value, we perform a quantitative test to determine the amount of impairment, if any, to the carrying value of the reporting unit and its associated goodwill.
Application of the goodwill impairment test requires judgment, including the identification of reporting units, assignment of assets and liabilities to reporting units, assignment of goodwill to reporting units and if a quantitative assessment is deemed necessary in determination of the fair value of each reporting unit. The fair value of each reporting unit is estimated using the guideline public company method, the discounted cash flow methodology, or a combination of both, which considers forecasted cash flows discounted at an estimated weighted average cost of capital. Assessing the recoverability of our goodwill requires significant assumptions regarding discount rates, market multiples, the estimated future cash flows and other factors to determine the fair value of a reporting unit, including, among other things, estimates related to forecasts of future revenues, Adjusted EBITDA, capital expenditures and working capital requirements, which are based upon our long-range plan estimates. The assumptions used to calculate the fair value of a reporting unit may change from year to year based on operating results, market conditions and other factors. Changes in these assumptions could materially affect the determination of fair value for each reporting unit.
No impairment charges were identified in connection with our annual goodwill impairment test with respect to our identified reporting units.
OTHER LONG-LIVED ASSETS
Long-lived assets are reviewed for impairment upon the occurrence of events or changes in circumstances that would indicate that the carrying value of the assets may not be recoverable. Such indicators may include: a significant decline in expected future cash flows; a sustained, significant decline in market pricing; a significant adverse change in legal or environmental factors or in the business climate; changes in estimates of our recoverable reserves; and unanticipated competition. Any adverse change in these factors could have a significant impact on the recoverability of our long-lived assets and could have a material impact on our consolidated statements of operations and statements of financial position.
A comparison of each asset group's carrying value to the estimated undiscounted net future cash flows expected to result from the use of the assets, including cost of disposition, is used to determine if an asset is recoverable. Projected future cash flows reflect management's best estimate of economic and market conditions over the projected period, including growth rates in revenues and costs, and estimates of future expected changes in operating margins and capital expenditures. If the carrying value of the asset group is higher than its undiscounted net future cash flows, the asset group is measured at fair value and the difference is recorded as a reduction to the long-lived assets. We estimate fair value using a market approach, an income approach or a cost approach.
During the year ended December 31, 2024, we concluded there were no triggering events resulting in the need for an asset impairment assessment except for the announcement of the indefinite idle of our Weirton tinplate production plant, which resulted in a $79 million asset impairment charge.
FOREIGN CURRENCY EXCHANGE RATE RISK
We are subject to changes in foreign currency exchange rates primarily as a result of our operations in Canada, which could impact our financial condition. Foreign exchange rate risk arises from our exposure to fluctuations in foreign currency exchange rates because our reporting currency is the U.S. dollar, but the functional currency of our Stelco subsidiaries is the Canadian dollar. Specifically, we are primarily exposed to fluctuations in foreign currency rates in relation to an intercompany note with our Stelco subsidiary that is denominated in the Canadian dollar. Changes in the Canadian dollar exchange rate may result in volatility in our financial condition due to the routine remeasurement of this note. As of December 31, 2024, a 1% change in the Canadian dollar foreign currency exchange rate would result in a $9 million change in currency exchange income (expense). Additionally, we engage in routine transactions denominated in foreign currencies, such as the purchases of goods and services. However, the potential impact of these transactions to our financial condition is significantly less than the potential impact of the routine remeasurement of the intercompany note.
INTEREST RATE RISK
Interest payable on our senior notes is at fixed rates. Interest payable under our ABL Facility is at a variable rate based upon the applicable base rate plus the applicable base rate margin depending on the excess availability. As of December 31, 2024, we had $1.6 billion outstanding borrowings under our ABL Facility. An increase in prevailing interest rates would increase interest expense and interest paid for any outstanding borrowings under our ABL Facility. For example, a 100 basis point change to interest rates under our ABL Facility at the December 31, 2024 borrowing level would result in a change of $16 million to interest expense on an annual basis. For a discussion of the attendant risk, see Part I – Item 1A. Risk Factors – III. Financial Risks – Our existing and future indebtedness may limit cash flow available to invest in the ongoing needs of our businesses, which could prevent us from fulfilling our obligations under our senior notes, ABL Facility and other debt, and we may be forced to take other actions to satisfy our obligations under our debt, which may not be successful.
SUPPLY CONCENTRATION RISKS
Many of our operations and mines rely on one source for each of electric power and natural gas. A significant interruption or change in service or rates from our energy suppliers could materially impact our production costs, margins and profitability.
RECENTLY ISSUED ACCOUNTING PRONOUNCEMENTS
Refer to NOTE 1 - BASIS OF PRESENTATION AND SIGNIFICANT ACCOUNTING POLICIES of the consolidated financial statements for a description of recent accounting pronouncements, including the respective dates of adoption and effects on results of operations and financial condition.
CRITICAL ACCOUNTING ESTIMATES
Management's discussion and analysis of financial condition and results of operations is based on our consolidated financial statements, which have been prepared in accordance with GAAP. Preparation of financial statements requires management to make assumptions, estimates and judgments that affect the reported amounts of assets, liabilities, revenues, costs and expenses, and the related disclosures of contingencies. Management bases its estimates on various assumptions and historical experience, which are believed to be reasonable; however, due to the inherent nature of estimates, actual results may differ significantly due to changed conditions or assumptions. On a regular basis, management reviews the accounting policies, assumptions, estimates and judgments to ensure that our financial statements are fairly presented in accordance with GAAP. However, because future events and their effects cannot be determined with certainty, actual results could differ from our assumptions and estimates, and such differences could be material. Management believes that the following critical accounting estimates and judgments have a significant impact on our financial statements.
BUSINESS COMBINATIONS
Assets acquired and liabilities assumed in a business combination are recognized and measured based on their estimated fair values at the acquisition date, while the acquisition-related costs are expensed as incurred. Any excess of the purchase consideration when compared to the fair value of the net tangible and intangible assets acquired, if any, is recorded as goodwill. We engage independent valuation specialists to assist with the determination of the fair value of assets acquired, liabilities assumed and goodwill associated with an acquisition. If the initial accounting for the business combination is incomplete by the end of the reporting period in which the acquisition occurs, an estimate will be recorded. Subsequent to the acquisition date, and not later than one year from the acquisition date, we will record any material adjustments to the initial estimate based on new information obtained that existed as of the date of the acquisition. Any adjustment that arises from information obtained that did not exist as of the date of the acquisition will be recorded in the period the adjustment arises.
VALUATION OF GOODWILL AND OTHER LONG-LIVED ASSETS
The valuation of goodwill and other long-lived assets includes various assumptions and are considered critical accounting estimates. Refer to "–Market Risks" above for additional information.
IRON ORE MINERAL RESERVES
We regularly evaluate, and engage QPs to review and validate, our mineral reserves and update them as required in accordance with Subpart 1300 of Regulation S-K. We perform an in-depth evaluation of our mineral reserve estimates by mine on a periodic basis, in addition to routine annual assessments. The determination of mineral reserves requires us and third-party QPs to make
significant estimates and assumptions related to key inputs, including, but not limited to, (1) the determination of the size and scope of the iron ore body through technical modeling, (2) the estimates of future iron ore prices, production costs and capital expenditures, and (3) management’s mine plan for the proven and probable mineral reserves. The significant estimates and assumptions could be affected by future industry conditions, geological conditions and ongoing mine planning. Additional capital and development expenditures may be required to maintain effective production capacity. Generally, as mining operations progress, haul distances increase. Alternatively, changes in economic conditions or the expected quality of mineral resources and reserves could decrease effective production capacity. Technological progress could alleviate such factors or increase capacity of mineral reserves.
We use our mineral reserve estimates, combined with our estimated annual production levels and operating scenarios, to determine the mine closure dates utilized in recording the fair value liability for asset retirement obligations for our active operating mines. Since the liability represents the present value of the expected future obligation, a significant change in mineral reserves or mine lives could have a substantial effect on the recorded obligation. We also utilize mineral reserves for evaluating potential impairments of goodwill and mine asset groups as they are indicative of future cash flows and in determining maximum useful lives utilized to calculate depreciation, depletion and amortization of long-lived mine assets. Refer to NOTE 13 - ASSET RETIREMENT AND ENVIRONMENTAL OBLIGATIONS for further information.
ASSET RETIREMENT OBLIGATIONS
Asset retirement obligations provide for contractual and legal obligations related to our indefinitely idled and closed operations and also provide for the eventual closure of our active operations. We perform an in-depth evaluation of the liability every three years in addition to our routine annual assessments. In 2023, we employed third-party specialists to assist in the evaluation. Our obligations are determined based on detailed estimates adjusted for factors that a market participant would consider (e.g., inflation, overhead and profit), which are escalated at an assumed rate of inflation to the estimated closure dates and then discounted using the current credit-adjusted risk-free interest rate. The estimate also incorporates incremental increases in the closure cost estimates and changes in estimates of mine lives for our active mine sites. The closure date for each of our active mine sites is determined based on the exhaustion date of the remaining mineral reserves, which is dependent on our estimate of mineral reserves. The estimated obligations for our active mine sites are particularly sensitive to the impact of changes in mine lives given the difference between the inflation and discount rates.
Asset retirement obligations at our steelmaking operations primarily include the closure and post-closure care for on-site landfills and other waste containment facilities. Asset retirement obligations have been recorded at present values using settlement dates based on when we expect these facilities to reach capacity and close. Changes in the base estimates of legal and contractual closure costs due to changes in legal or contractual requirements, available technology, inflation, overhead or profit rates also could have a significant impact on the recorded obligations. Refer to NOTE 13 - ASSET RETIREMENT AND ENVIRONMENTAL OBLIGATIONS, for further information.
ENVIRONMENTAL REMEDIATION COSTS
We have a formal policy for environmental protection and remediation. Our obligations for known environmental matters at active and closed operations have been recognized based on estimates of the cost of investigation and remediation at each facility. If the obligation can only be estimated as a range of possible amounts, with no specific amount being more likely, the minimum of the range is accrued. Management reviews its environmental remediation sites quarterly to determine if additional cost adjustments or disclosures are required. The characteristics of environmental remediation obligations, where information concerning the nature and extent of clean-up activities is not immediately available and which are subject to changes in regulatory requirements, result in a significant risk of increase to the obligations as they mature. Expected future expenditures are discounted to present value unless the amount and timing of the cash disbursements cannot be reasonably estimated. Refer to NOTE 13 - ASSET RETIREMENT AND ENVIRONMENTAL OBLIGATIONS, for further information.
INCOME TAXES
Our income tax expense, deferred tax assets and liabilities and reserves for unrecognized tax benefits reflect management's best assessment of estimated future taxes to be paid. We are subject to income taxes in the U.S. and various foreign jurisdictions. Significant judgments and estimates are required in determining the consolidated income tax expense.
Deferred income taxes arise from temporary differences between tax and financial statement recognition of revenue and expense. In evaluating our ability to recover our deferred tax assets, we consider all available positive and negative evidence, including scheduled reversals of deferred tax liabilities, projected future taxable income, tax planning strategies and recent financial operations. In projecting future taxable income, we begin with historical results adjusted for the results of discontinued operations and changes in accounting policies and incorporate assumptions including the amount of future state, federal and foreign pre-tax operating income, the reversal of temporary differences, and the implementation of feasible and prudent tax planning strategies. These assumptions require significant judgment about the forecasts of future taxable income and are consistent with the plans and estimates we are using to manage the underlying businesses.
At December 31, 2024 and 2023, we had a valuation allowance of $388 million and $396 million, respectively, against our deferred tax assets. At December 31, 2024 and 2023, the valuation allowance on our U.S. deferred tax assets was $39 million and $40 million, respectively, and the valuation allowance on our foreign deferred tax assets was $349 million and $356 million, respectively.
During 2023, we recorded a $14 million valuation allowance against a portion of our Canadian deferred tax assets due to losses in recent years. We intend to maintain a valuation allowance against these deferred tax assets, unless and until sufficient positive evidence exists to support the realization of such assets. Our losses in Luxembourg in recent periods represent sufficient negative
evidence to require a full valuation allowance against the deferred tax assets in that jurisdiction. We intend to maintain a valuation allowance against the deferred tax assets related to these operating losses, unless and until sufficient positive evidence exists to support the realization of such assets.
Changes in tax laws and rates also could affect recorded deferred tax assets and liabilities in the future. The calculation of our tax liabilities involves dealing with uncertainties in the application of complex tax laws and regulations in various jurisdictions across our global operations. The ultimate impact of U.S. income tax reform legislation may differ from our current estimates due to changes in the interpretations and assumptions made as well as additional regulatory guidance that may be issued.
Accounting for uncertainty in income taxes recognized in the financial statements requires that a tax benefit from an uncertain tax position be recognized when it is more likely than not that the position will be sustained upon examination, including resolutions of any related appeals or litigation processes, based on technical merits.
We recognize tax liabilities in accordance with ASC 740, Income Taxes, and we adjust these liabilities when our judgment changes because of evaluation of new information not previously available. Due to the complexity of some of these uncertainties, the ultimate resolution may result in payment that is materially different from our current estimate of the tax liabilities. These differences will be reflected as increases or decreases to income tax expense in the period in which they are determined. Refer to NOTE 11 - INCOME TAXES, for further information.
EMPLOYEE RETIREMENT BENEFIT OBLIGATIONS
We sponsor various defined benefit pension plans and OPEB plans for certain current employees and retirees. For accounting purposes, we use various actuarial assumptions and methodologies to measure the plan obligations, assets and related net periodic benefit cost or credit at the end of each year. These assumptions include discount rates, expected return on plan assets, mortality rates, rates of compensation increase, healthcare trend rates and certain demographic assumptions. Assumptions and calculations are reviewed by management and reflect our best estimates and judgment. Future changes in assumptions or differences between actual and expected can significantly impact the future funded status of our plans as well as their related net periodic benefit cost or credit.
We believe discount rates and expected return on assets are the most critical assumptions. The discount rates used to measure plan liabilities as of the December 31 measurement date are determined individually for each plan. The discount rates are determined by matching the projected cash flows used to determine the plan liabilities to a projected yield curve of high-quality corporate bonds available at the measurement date. Discount rates for expense are calculated using the granular approach for each plan.
The expected return on plan assets are calculated on a plan-by-plan basis and take into account each plan's strategic asset allocation. The calculation of rates by asset class are based primarily on our future expected returns and take into consideration the duration of the cash flows, active management and fees. The difference between our expected return on plan assets assumptions and the actual returns are recorded in AOCI and ultimately affects future earnings in subsequent years. Although our actual returns will likely differ from our estimate on any given year, the returns over the long term are expected to match our assumptions. In 2025, our weighted average expected return on assets for pension plans will remain at 7.85% while OPEB plans will decrease from 5.95% to 5.89%.
Cumulative actuarial gains and losses will be amortized to expense using the corridor method, where gains and losses are recognized if they exceed 10% of the greater of the fair value of plan assets or the plans' benefit obligations. The amortization period will vary by plan.
The following are sensitivities of potential further changes in these key assumptions on the estimated 2025 pension and OPEB expense and the pension and OPEB obligations as of December 31, 2024:
| | | | | | | | | | | | | | | | | | | | | | | |
| Increase (Decrease) in Expense | | Increase in Benefit Obligation |
| (In millions) | Pension | | OPEB | | Pension | | OPEB |
| Decrease discount rate 0.25% | $ | 2 | | | $ | 1 | | | $ | 80 | | | $ | 23 | |
| Decrease return on assets 1.00% | 40 | | | 7 | | | N/A | | N/A |
Refer to NOTE 9 - PENSIONS AND OTHER POSTRETIREMENT BENEFITS for further information.
FORWARD-LOOKING STATEMENTS
This report contains statements that constitute "forward-looking statements" within the meaning of the federal securities laws. As a general matter, forward-looking statements relate to anticipated trends and expectations rather than historical matters. Forward-looking statements are subject to uncertainties and factors relating to our operations and business environment that are difficult to predict and may be beyond our control. Such uncertainties and factors may cause actual results to differ materially from those expressed or implied by the forward-looking statements. These statements speak only as of the date of this report, and we undertake no ongoing obligation, other than that imposed by law, to update these statements. Investors are cautioned not to place undue reliance on forward-looking statements. Uncertainties and risk factors that could affect our future performance and cause results to differ from the forward-looking statements in this report include, but are not limited to:
•continued volatility of steel, scrap metal and iron ore market prices, which directly and indirectly impact the prices of the products that we sell to our customers;
•uncertainties associated with the highly competitive and cyclical steel industry and our reliance on the demand for steel from the automotive industry;
•potential weaknesses and uncertainties in global economic conditions, excess global steelmaking capacity and production, prevalence of steel imports, reduced market demand and oversupply of iron ore;
•severe financial hardship, bankruptcy, temporary or permanent shutdowns or operational challenges of one or more of our major customers, key suppliers or contractors, which, among other adverse effects, could disrupt our operations or lead to reduced demand for our products, increased difficulty collecting receivables, and customers and/or suppliers asserting force majeure or other reasons for not performing their contractual obligations to us;
•risks related to U.S. government actions and other countries' reactions with respect to Section 232, the USMCA and/or other trade agreements, tariffs, treaties or policies, as well as the uncertainty of obtaining and maintaining effective antidumping and countervailing duty orders to counteract the harmful effects of unfairly traded imports;
•impacts of existing and increasing governmental regulation, including actual and potential environmental regulations relating to climate change and carbon emissions, and related costs and liabilities, including failure to receive or maintain required operating and environmental permits, approvals, modifications or other authorizations of, or from, any governmental or regulatory authority and costs related to implementing improvements to ensure compliance with regulatory changes, including potential financial assurance requirements, and reclamation and remediation obligations;
•potential impacts to the environment or exposure to hazardous substances resulting from our operations;
•our ability to maintain adequate liquidity, our level of indebtedness and the availability of capital could limit our financial flexibility and cash flow necessary to fund working capital, planned capital expenditures, acquisitions, and other general corporate purposes or ongoing needs of our business, or to repurchase our common shares;
•our ability to reduce our indebtedness or return capital to shareholders within the currently expected timeframes or at all;
•adverse changes in credit ratings, interest rates, foreign currency rates and tax laws;
•challenges to successfully implementing our business strategy to achieve operating results in line with our guidance;
•the outcome of, and costs incurred in connection with, lawsuits, claims, arbitrations or governmental proceedings relating to commercial and business disputes, antitrust claims, environmental matters, government investigations, occupational or personal injury claims, property-related matters, labor and employment matters, or suits involving legacy operations and other matters;
•supply chain disruptions or changes in the cost, quality or availability of energy sources, including electricity, natural gas and diesel fuel, critical raw materials and supplies, including iron ore, industrial gases, graphite electrodes, scrap metal, chrome, zinc, other alloys, coke and metallurgical coal, and critical manufacturing equipment and spare parts;
•problems or disruptions associated with transporting products to our customers, moving manufacturing inputs or products internally among our facilities, or suppliers transporting raw materials to us;
•the risk that the cost or time to implement a strategic or sustaining capital project may prove to be greater than originally anticipated;
•our ability to consummate any public or private acquisition transactions and to realize any or all of the anticipated benefits or estimated future synergies, as well as to successfully integrate any acquired businesses into our existing businesses;
•uncertainties associated with natural or human-caused disasters, adverse weather conditions, unanticipated geological conditions, critical equipment failures, infectious disease outbreaks, tailings dam failures and other unexpected events;
•cybersecurity incidents relating to, disruptions in, or failures of, information technology systems that are managed by us or third parties that host or have access to our data or systems, including the loss, theft or corruption of our or third parties' sensitive or essential business or personal information and the inability to access or control systems;
•liabilities and costs arising in connection with any business decisions to temporarily or indefinitely idle or permanently close an operating facility or mine, which could adversely impact the carrying value of associated assets and give rise to impairment charges or closure and reclamation obligations, as well as uncertainties associated with restarting any previously idled operating facility or mine;
•our ability to realize the anticipated synergies or other expected benefits of the Stelco Acquisition, as well as the impact of additional liabilities and obligations incurred in connection with the Stelco Acquisition;
•our level of self-insurance and our ability to obtain sufficient third-party insurance to adequately cover potential adverse events and business risks;
•uncertainties associated with our ability to meet customers’ and suppliers’ decarbonization goals and reduce our GHG emissions in alignment with our own announced targets;
•challenges to maintaining our social license to operate with our stakeholders, including the impacts of our operations on local communities, reputational impacts of operating in a carbon-intensive industry that produces GHG emissions, and our ability to foster a consistent operational and safety track record;
•our actual economic mineral reserves or reductions in current mineral reserve estimates, and any title defect or loss of any lease, license, option, easement or other possessory interest for any mining property;
•our ability to maintain satisfactory labor relations with unions and employees;
•unanticipated or higher costs associated with pension and OPEB obligations resulting from changes in the value of plan assets or contribution increases required for unfunded obligations;
•uncertain availability or cost of skilled workers to fill critical operational positions and potential labor shortages caused by experienced employee attrition or otherwise, as well as our ability to attract, hire, develop and retain key personnel; and
•potential significant deficiencies or material weaknesses in our internal control over financial reporting.
For additional factors affecting our businesses, refer to Part I – Item 1A. Risk Factors. You are urged to carefully consider these risk factors.
Forward-looking and other statements in this Annual Report on Form 10-K regarding our GHG reduction plans and goals are not an indication that these statements are necessarily material to investors or required to be disclosed in our filings with the SEC. Historical, current and forward-looking GHG-related statements may be based on standards for measuring progress that are still developing, internal controls and processes that continue to evolve, and assumptions that are subject to change in the future.
| | |
|
| ITEM 7A. QUANTITATIVE AND QUALITATIVE DISCLOSURES ABOUT MARKET RISK |
Information regarding our market risk is presented under the caption "Market Risks," which is included in ITEM 7. MANAGEMENT'S DISCUSSION AND ANALYSIS OF FINANCIAL CONDITION AND RESULTS OF OPERATIONS and is incorporated by reference and made a part hereof.
| | |
|
| ITEM 8. FINANCIAL STATEMENTS AND SUPPLEMENTARY DATA |
STATEMENTS OF CONSOLIDATED FINANCIAL POSITION
CLEVELAND-CLIFFS INC. AND SUBSIDIARIES
| | | | | | | | | | | |
| December 31, |
| (In millions, except share information) | 2024 | | 2023 |
| ASSETS | | | |
| Current assets: | | | |
| Cash and cash equivalents | $ | 54 | | | $ | 198 | |
| Accounts receivable, net | 1,576 | | | 1,840 | |
| Inventories | 5,094 | | | 4,460 | |
| Other current assets | 183 | | | 138 | |
| Total current assets | 6,907 | | | 6,636 | |
| Non-current assets: | | | |
| Property, plant and equipment, net | 9,942 | | | 8,895 | |
| Goodwill | 1,768 | | | 1,005 | |
| Intangible assets | 1,170 | | | 201 | |
| Pension and OPEB assets | 427 | | | 329 | |
| Other non-current assets | 733 | | | 471 | |
| TOTAL ASSETS | $ | 20,947 | | | $ | 17,537 | |
| LIABILITIES AND EQUITY | | | |
| Current liabilities: | | | |
| Accounts payable | $ | 2,008 | | | $ | 2,099 | |
| Accrued employment costs | 447 | | | 511 | |
| Accrued expenses | 375 | | | 380 | |
| Other current liabilities | 492 | | | 518 | |
| Total current liabilities | 3,322 | | | 3,508 | |
| Non-current liabilities: | | | |
| Long-term debt | 7,065 | | | 3,137 | |
| Pension and OPEB liabilities | 751 | | | 821 | |
| Deferred income taxes | 858 | | | 639 | |
| Asset retirement and environmental obligations | 601 | | | 557 | |
| Other non-current liabilities | 1,453 | | | 753 | |
| TOTAL LIABILITIES | 14,050 | | | 9,415 | |
| Commitments and contingencies (See NOTE 20) | | | |
| Equity: | | | |
Common Shares - par value $0.125 per share | | | |
Authorized - 1,200,000,000 shares (2023 - 1,200,000,000 shares); | | | |
Issued - 531,051,530 shares (2023 - 531,051,530 shares); | | | |
Outstanding - 493,948,905 shares (2023 - 504,886,773 shares) | 66 | | | 66 | |
| Capital in excess of par value of shares | 4,758 | | | 4,861 | |
| Retained earnings | 979 | | | 1,733 | |
Cost of 37,102,625 common shares in treasury (2023 - 26,164,757 shares) | (676) | | | (430) | |
| Accumulated other comprehensive income | 1,537 | | | 1,657 | |
| Total Cliffs shareholders' equity | 6,664 | | | 7,887 | |
| Noncontrolling interests | 233 | | | 235 | |
| TOTAL EQUITY | 6,897 | | | 8,122 | |
| TOTAL LIABILITIES AND EQUITY | $ | 20,947 | | | $ | 17,537 | |
The accompanying notes are an integral part of these consolidated financial statements.
STATEMENTS OF CONSOLIDATED OPERATIONS
CLEVELAND-CLIFFS INC. AND SUBSIDIARIES
| | | | | | | | | | | | | | | | | |
| Year Ended December 31, |
| (In millions, except per share amounts) | 2024 | | 2023 | | 2022 |
| Revenues | $ | 19,185 | | | $ | 21,996 | | | $ | 22,989 | |
| Operating costs: | | | | | |
| Cost of goods sold | (19,115) | | | (20,605) | | | (20,471) | |
| Selling, general and administrative expenses | (486) | | | (577) | | | (465) | |
| Restructuring and other charges | (129) | | | — | | | — | |
| Acquisition-related costs | (44) | | | (12) | | | (4) | |
| Asset impairment | (79) | | | — | | | (29) | |
| Goodwill impairment | — | | | (125) | | | — | |
| Miscellaneous – net | (88) | | | — | | | (81) | |
| Total operating costs | (19,941) | | | (21,319) | | | (21,050) | |
| Operating income (loss) | (756) | | | 677 | | | 1,939 | |
| Other income (expense): | | | | | |
| Interest expense, net | (370) | | | (289) | | | (276) | |
| Loss on extinguishment of debt | (27) | | | — | | | (75) | |
| Net periodic benefit credits other than service cost component | 247 | | | 204 | | | 212 | |
| Other non-operating income (loss) | (37) | | | 5 | | | (4) | |
| Total other expense | (187) | | | (80) | | | (143) | |
| Income (loss) from continuing operations before income taxes | (943) | | | 597 | | | 1,796 | |
| Income tax benefit (expense) | 235 | | | (148) | | | (423) | |
| Income (loss) from continuing operations | (708) | | | 449 | | | 1,373 | |
| Income from discontinued operations, net of tax | — | | | 1 | | | 3 | |
| Net income (loss) | (708) | | | 450 | | | 1,376 | |
| Net income attributable to noncontrolling interests | (46) | | | (51) | | | (41) | |
| Net income (loss) attributable to Cliffs shareholders | $ | (754) | | | $ | 399 | | | $ | 1,335 | |
| | | | | |
| Earnings (loss) per common share attributable to Cliffs shareholders - basic | | | | | |
| Continuing operations | $ | (1.57) | | | $ | 0.78 | | | $ | 2.57 | |
| Discontinued operations | — | | | — | | | — | |
| $ | (1.57) | | | $ | 0.78 | | | $ | 2.57 | |
| Earnings (loss) per common share attributable to Cliffs shareholders - diluted | | | | | |
| Continuing operations | $ | (1.57) | | | $ | 0.78 | | | $ | 2.55 | |
| Discontinued operations | — | | | — | | | — | |
| $ | (1.57) | | | $ | 0.78 | | | $ | 2.55 | |
The accompanying notes are an integral part of these consolidated financial statements.
STATEMENTS OF CONSOLIDATED COMPREHENSIVE INCOME (LOSS)
CLEVELAND-CLIFFS INC. AND SUBSIDIARIES
| | | | | | | | | | | | | | | | | |
| Year Ended December 31, |
| (In millions) | 2024 | | 2023 | | 2022 |
| Net income (loss) | $ | (708) | | | $ | 450 | | | 1,376 | |
| Other comprehensive income (loss): | | | | | |
| Changes in pension and OPEB, net of tax | (167) | | | (20) | | | 1,298 | |
| Changes in derivative instruments, net of tax | 117 | | | (154) | | | (84) | |
| Changes in foreign currency translation | (70) | | | 1 | | | (2) | |
| Total other comprehensive income (loss) | (120) | | | (173) | | | 1,212 | |
| Comprehensive income (loss) | (828) | | | 277 | | | 2,588 | |
| Comprehensive income attributable to noncontrolling interests | (46) | | | (51) | | | (41) | |
| Comprehensive income (loss) attributable to Cliffs shareholders | $ | (874) | | | $ | 226 | | | $ | 2,547 | |
The accompanying notes are an integral part of these consolidated financial statements.
STATEMENTS OF CONSOLIDATED CASH FLOWS
CLEVELAND-CLIFFS INC. AND SUBSIDIARIES
| | | | | | | | | | | | | | | | | |
| Year Ended December 31, |
| (In millions) | 2024 | | 2023 | | 2022 |
| OPERATING ACTIVITIES | | | | | |
| Net income (loss) | $ | (708) | | | $ | 450 | | | $ | 1,376 | |
| Adjustments to reconcile net income (loss) to net cash provided by operating activities: | | | | | |
| Depreciation, depletion and amortization | 951 | | | 973 | | | 1,034 | |
| Pension and OPEB credits | (211) | | | (163) | | | (132) | |
| Deferred income taxes | (195) | | | 114 | | | 90 | |
| Other | 485 | | | 201 | | | 226 | |
| Changes in operating assets and liabilities, net of business combination: | | | | | |
| Accounts receivable, net | 364 | | | 120 | | | 197 | |
| Inventories | (5) | | | 670 | | | 64 | |
| Income taxes | (17) | | | 122 | | | (22) | |
| Pension and OPEB payments and contributions | (195) | | | (94) | | | (204) | |
| Payables, accrued employment and accrued expenses | (408) | | | 4 | | | (70) | |
| Other, net | 44 | | | (130) | | | (136) | |
| Net cash provided by operating activities | 105 | | | 2,267 | | | 2,423 | |
| INVESTING ACTIVITIES | | | | | |
| Purchase of property, plant and equipment | (695) | | | (646) | | | (943) | |
| Acquisition of Stelco, net of cash acquired | (2,512) | | | — | | | — | |
| Acquisition of FPT, net of cash acquired | — | | | — | | | (31) | |
| Other investing activities | (5) | | | 55 | | | 38 | |
| Net cash used by investing activities | (3,212) | | | (591) | | | (936) | |
| FINANCING ACTIVITIES | | | | | |
| Repurchase of common shares | (733) | | | (152) | | | (240) | |
| Proceeds from issuance of debt | 3,221 | | | 750 | | | — | |
| Repayments of senior notes | (845) | | | — | | | (1,358) | |
| Borrowings (repayments) under credit facilities | 1,560 | | | (1,864) | | | 255 | |
| Debt issuance costs | (109) | | | (34) | | | — | |
| Other financing activities | (124) | | | (204) | | | (166) | |
| Net cash provided (used) by financing activities | 2,970 | | | (1,504) | | | (1,509) | |
| Net increase (decrease) in cash and cash equivalents | (137) | | | 172 | | | (22) | |
| | | | | |
| Cash, cash equivalents, and restricted cash at beginning of year | 198 | | | 26 | | | 48 | |
| Effect of exchange rate changes on cash | (1) | | | — | | | — | |
| Cash, cash equivalents, and restricted cash at end of year | 60 | | | 198 | | | 26 | |
| | | | | |
| Restricted cash | (6) | | | — | | | — | |
| | | | | |
| Cash and cash equivalents at end of year | $ | 54 | | | $ | 198 | | | $ | 26 | |
The accompanying notes are an integral part of these consolidated financial statements.
STATEMENTS OF CONSOLIDATED CHANGES IN EQUITY
CLEVELAND-CLIFFS INC. AND SUBSIDIARIES
| | | | | | | | | | | | | | | | | | | | | | | | | | | | | | | | | | | | | | | | | | | | | | | |
| Cliffs Shareholders | | | | |
| (In millions) | Number
of
Common
Shares Outstanding | | Par Value of Common
Shares Issued | | Capital in
Excess of
Par Value
of Shares | | Retained Earnings
(Deficit) | | Common
Shares
in
Treasury | | AOCI
(Loss) | | Non-
controlling
Interests | | Total |
| December 31, 2021 | 500.1 | | | $ | 63 | | | $ | 4,892 | | | $ | (1) | | | $ | (82) | | | $ | 618 | | | $ | 284 | | | $ | 5,774 | |
| Comprehensive income | — | | | — | | | — | | | 1,335 | | | — | | | 1,212 | | | 41 | | | 2,588 | |
| Stock and other incentive plans | 1.5 | | | — | | | 7 | | | — | | | 12 | | | — | | | — | | | 19 | |
| 1.500% 2025 Convertible Senior Notes redemption | 24.2 | | | 3 | | | (28) | | | — | | | — | | | — | | | — | | | (25) | |
| Common share repurchases | (12.5) | | | — | | | — | | | — | | | (240) | | | — | | | — | | | (240) | |
| Net distributions to noncontrolling interests | — | | | — | | | — | | | — | | | — | | | — | | | (74) | | | (74) | |
| December 31, 2022 | 513.3 | | | 66 | | | 4,871 | | | 1,334 | | | (310) | | | 1,830 | | | 251 | | | 8,042 | |
| Comprehensive income (loss) | — | | | — | | | — | | | 399 | | | — | | | (173) | | | 51 | | | 277 | |
| Stock and other incentive plans | 2.0 | | | — | | | (10) | | | — | | | 33 | | | — | | | — | | | 23 | |
| Common stock repurchases, net of excise tax | (10.4) | | | — | | | — | | | — | | | (153) | | | — | | | — | | | (153) | |
| Net distributions to noncontrolling interests | — | | | — | | | — | | | — | | | — | | | — | | | (67) | | | (67) | |
| December 31, 2023 | 504.9 | | | 66 | | | 4,861 | | | 1,733 | | | (430) | | | 1,657 | | | 235 | | | 8,122 | |
| Comprehensive income (loss) | — | | | — | | | — | | | (754) | | | — | | | (120) | | | 46 | | | (828) | |
| Acquisition of Stelco | 25.9 | | | — | | | (130) | | | — | | | 473 | | | — | | | — | | | 343 | |
| Stock and other incentive plans | 1.0 | | | — | | | 27 | | | — | | | 18 | | | — | | | — | | | 45 | |
| Common stock repurchases, net of excise tax | (37.9) | | | — | | | — | | | — | | | (737) | | | — | | | — | | | (737) | |
| Net distributions to noncontrolling interests | — | | | — | | | — | | | — | | | — | | | | | (48) | | | (48) | |
| December 31, 2024 | 493.9 | | | 66 | | | 4,758 | | | 979 | | | (676) | | | 1,537 | | | 233 | | | 6,897 | |
The accompanying notes are an integral part of these consolidated financial statements.
NOTES TO CONSOLIDATED FINANCIAL STATEMENTS
CLEVELAND-CLIFFS INC. AND SUBSIDIARIES
NOTE 1 - BASIS OF PRESENTATION AND SIGNIFICANT ACCOUNTING POLICIES
BUSINESS, CONSOLIDATION AND PRESENTATION
NATURE OF BUSINESS
We are a leading North America-based steel producer with focus on value-added sheet products, particularly for the automotive industry. We are vertically integrated from the mining of iron ore, production of pellets and direct reduced iron, and processing of ferrous scrap through primary steelmaking and downstream finishing, stamping, tooling and tubing. Headquartered in Cleveland, Ohio, we employ approximately 30,000 people across our operations in the United States and Canada. More than 90% of our approximately 23,000 hourly workforce is represented by three prominent unions - USW, UAW and IAM.
Unless otherwise noted, discussion of our business and results of operations in this Annual Report on Form 10-K refers to our continuing operations.
STELCO ACQUISITION
On November 1, 2024, pursuant to the terms of the Arrangement Agreement announced on July 15, 2024, we completed the Stelco Acquisition. In connection with closing, Stelco shareholders received CAD $60.00 in cash and 0.454 shares of Cliffs common stock per share of Stelco common stock. Refer to NOTE 3 - ACQUISITIONS for further information.
BUSINESS OPERATIONS
We are organized into four operating segments based on differentiated products, Steelmaking, Tubular, Tooling and Stamping and European Operations. We primarily operate through one reportable segment – the Steelmaking segment.
BASIS OF CONSOLIDATION
The consolidated financial statements consolidate our accounts and the accounts of our wholly owned subsidiaries, all subsidiaries in which we have a controlling interest and VIEs for which we are the primary beneficiary. All intercompany transactions and balances are eliminated upon consolidation.
INVESTMENTS IN AFFILIATES
We have investments in several businesses accounted for using the equity method of accounting. These investments are included within our Steelmaking segment. We review an investment for impairment when circumstances indicate that a loss in value below its carrying amount is other than temporary.
Our investment in affiliates of $131 million and $123 million as of December 31, 2024 and 2023, respectively, was classified in Other non-current assets.
SIGNIFICANT ACCOUNTING POLICIES
We consider the following policies to be beneficial in understanding the judgments involved in the preparation of our consolidated financial statements and the uncertainties that could impact our financial condition, results of operations and cash flows. Certain prior period amounts have been reclassified to conform with the current year presentation.
USE OF ESTIMATES
The preparation of financial statements in conformity with GAAP requires management to make estimates and assumptions that affect the reported amounts of assets and liabilities and disclosure of contingent assets and liabilities at the date of the financial statements and the reported amounts of revenues and expenses during the reporting period. Our mineral reserves; future realizable cash flow; environmental, reclamation and closure obligations; valuation of business combinations; derivative assets/liabilities; tax assets/liabilities; post-employment, post-retirement and other employee benefit liabilities; reserves for contingencies and litigation require the use of various management estimates and assumptions. Actual results could differ from estimates. Management reviews its estimates on an ongoing basis. Changes in facts and circumstances may alter such estimates and affect the results of operations and financial position in future periods.
BUSINESS COMBINATIONS
Assets acquired and liabilities assumed in a business combination are recognized and measured based on their estimated fair values at the acquisition date, while the acquisition-related costs are expensed as incurred. Any excess of the purchase consideration when compared to the fair value of the net tangible and intangible assets acquired, if any, is recorded as goodwill. We engage independent valuation specialists to assist with the determination of the fair value of assets acquired, liabilities assumed and goodwill associated with an acquisition. If the initial accounting for the business combination is incomplete by the end of the reporting period in which the acquisition occurs, an estimate will be recorded. Subsequent to the acquisition date, and not later than one year from the acquisition date, we will record any material adjustments to the initial estimate based on new information obtained that existed as of the date of the acquisition. Any adjustment that arises from information obtained that did not exist as of the date of the acquisition will be recorded in the period the adjustment arises.
CASH, CASH EQUIVALENTS, AND RESTRICTED CASH
Cash and cash equivalents include cash on hand and on deposit as well as all short-term securities held for the primary purpose of general liquidity. We routinely monitor and evaluate counterparty credit risk related to the financial institutions in which our short-term investment securities are held. Where right of offset exists, we report cash balances net. Additionally, restricted cash represents cash not readily available for our operations and includes deposits primarily associated with certain environmental obligations. This balance is classified within Other non-current assets on the Statements of Consolidated Financial Position.
TRADE ACCOUNTS RECEIVABLE AND ALLOWANCE FOR CREDIT LOSS
Trade accounts receivable are recorded at the point control transfers and represent the amount of consideration we expect to receive in exchange for transferred goods and do not bear interest. We establish provisions for expected lifetime losses on accounts receivable at the time a receivable is recorded based on historical experience, customer credit quality and forecasted economic conditions. We regularly review our accounts receivable balances and the allowance for credit loss and establish or adjust the allowance as necessary using the specific identification method. We evaluate the aggregation and risk characteristics of receivable pools and develop loss rates that reflect historical collections, current forecasts of future economic conditions over the time horizon we are exposed to credit risk, and payment terms or conditions that may materially affect future forecasts.
INVENTORIES
Inventories are generally stated at the lower of cost or net realizable value using average cost, excluding depreciation and amortization. Certain iron ore inventories are stated at the lower of cost or market using the LIFO method.
DERIVATIVE INSTRUMENTS AND HEDGING ACTIVITIES
We are exposed to certain risks related to the ongoing operations of our business, including those caused by changes in commodity prices and energy rates. We have established policies and procedures, including the use of certain derivative instruments, to manage such risks.
Derivative instruments are recognized as either assets or liabilities on the Statements of Consolidated Financial Position and measured at fair value. On the date a qualifying hedging instrument is executed, we designate the hedging instrument as a hedge of the variability of cash flows to be received or paid related to a forecasted transaction (cash flow hedge). We formally document all relationships between hedging instruments and hedged items, as well as our risk-management objective and strategy for undertaking various hedge transactions. This process includes linking all derivatives that are designated as cash flow hedges to specific firm commitments or forecasted transactions. We also formally assess, both at the hedge's inception and on an ongoing basis, whether the derivatives that are used in hedging transactions are highly effective in offsetting changes in cash flows of the related hedged items. When it is determined that a derivative is not highly effective as a hedge, we discontinue hedge accounting prospectively and record all future changes in fair value in the period of the instrument's earnings or losses.
For derivative instruments that have been designated as cash flow hedges, the changes in fair value are recorded in Accumulated other comprehensive income. Amounts recorded in Accumulated other comprehensive income are reclassified to earnings or losses in the period the underlying hedged transaction affects earnings or when the underlying hedged transaction is no longer reasonably possible of occurring. The cash flows resulting from these derivative instruments are classified in Other, net in operating activities on the Statements of Consolidated Cash Flows.
For derivative instruments that have not been designated as cash flow hedges, changes in fair value are recorded in the period of the instrument's earnings or losses.
PROPERTY, PLANT AND EQUIPMENT
Our properties are stated at cost less accumulated depreciation. Depreciation of plant and equipment is computed principally by the straight-line method based on estimated useful lives. Depreciation continues to be recognized when operations are idled temporarily. Depreciation and depletion are recorded over the following estimated useful lives:
| | | | | | | | | | | | | | |
| Asset Class | | Basis | | Life |
| Land, land improvements and mineral rights | | | | |
| Land and mineral rights | | Units of production | | Life of mine |
| Land improvements | | Straight line | | 20 to 45 years |
| Buildings | | Straight line | | 20 to 45 years |
| Equipment | | Straight line/Double declining balance | | 3 to 45 years |
Governmental grants received in connection with an underlying capital project typically have associated requirements that must be met in order to ultimately earn the grant. When we receive grant funds related to a capital project, we record the amount received as a reduction of the capital project asset on the balance sheet. Grant funds received are recorded as a cash inflow, classified in Other investing activities, separate from the cash outflow related to the capital project, which are classified in Purchase of property, plant and equipment, within investing activities on the Statements of Consolidated Cash Flows.
GOODWILL
Goodwill represents the excess purchase price paid over the fair value of the net assets from an acquisition. Goodwill is not amortized for financial statement purposes. Goodwill is tested on a qualitative or quantitative basis for impairment at the reporting
unit level on an annual basis on October 1 and between annual tests if an event occurs or circumstances change that would more likely than not reduce the fair value of a reporting unit below its carrying value. We have an unconditional option to bypass the qualitative test for any reporting unit in any period and proceed directly to performing the quantitative test. Should our qualitative test indicate that it is more likely than not that the fair value of a reporting unit is less than its carrying value, we perform a quantitative test to determine the amount of impairment, if any, to the carrying value of the reporting unit and its associated goodwill.
OTHER INTANGIBLE ASSETS AND LIABILITIES
Intangible assets and liabilities are subject to periodic amortization on a straight-line basis over their estimated useful lives.
LEASES
We determine if an arrangement contains a lease at inception. We recognize right-of-use assets and lease liabilities associated with leases based on the present value of the future minimum lease payments over the lease term at the commencement date. Lease terms reflect options to extend or terminate the lease when it is reasonably certain that the option will be exercised. Short-term leases (leases with an initial lease term of 12 months or less) are not recognized on the Statements of Consolidated Financial Position. Operating lease expense is recognized on a straight-line basis over the lease term.
ASSET IMPAIRMENT
We monitor conditions that may affect the carrying value of our long-lived tangible and intangible assets when events and circumstances indicate that the carrying value of the asset groups may not be recoverable. In order to determine if assets have been impaired, assets are grouped and tested at the lowest level for which identifiable, independent cash flows are available ("asset group"). The measurement of the impairment loss to be recognized is based on the difference between the fair value and the carrying value of the asset group. Fair value can be determined using a market approach, income approach or cost approach.
FAIR VALUE MEASUREMENTS
ASC Topic 820, Fair Value Measurements and Disclosures, establishes a three-level valuation hierarchy for classification of fair value measurements. The valuation hierarchy is based upon the transparency of inputs to the valuation of an asset or liability as of the measurement date. Inputs refer broadly to the assumptions that market participants would use in pricing an asset or liability. Inputs may be observable or unobservable. Observable inputs are inputs that reflect the assumptions market participants would use in pricing the asset or liability developed based on market data obtained from independent sources. Unobservable inputs are inputs that reflect our own views about the assumptions market participants would use in pricing the asset or liability developed based on the best information available in the circumstances. The three-tier hierarchy of inputs is summarized below:
•Level 1 — Valuation is based upon quoted prices (unadjusted) for identical assets or liabilities in active markets.
•Level 2 — Valuation is based upon quoted prices for similar assets and liabilities in active markets, or other inputs that are observable for the asset or liability, either directly or indirectly, for substantially the full term of the financial instrument.
•Level 3 — Valuation is based upon other unobservable inputs that are significant to the fair value measurement.
The classification of assets and liabilities within the valuation hierarchy is based upon the lowest level of input that is significant to the fair value measurement in its entirety.
PENSION AND OTHER POSTRETIREMENT BENEFITS
We offer defined benefit pension plans, defined contribution pension plans and OPEB plans, primarily consisting of retiree healthcare benefits as part of our total compensation and benefits programs.
We recognize the funded or unfunded status of our pension and OPEB obligations on the Statements of Consolidated Financial Position based on the difference between the market value of plan assets and the actuarial present value of our retirement obligations on that date, on a plan-by-plan basis. If the plan assets exceed the pension and OPEB obligations, the amount of the surplus is recorded as an asset; if the pension and OPEB obligations exceed the plan assets, the amount of the underfunded obligations is recorded as a liability. Year-end balance sheet adjustments to pension and OPEB assets and obligations are recorded as Accumulated other comprehensive income on the Statements of Consolidated Financial Position.
The actuarial estimates of the PBO (Projected benefit obligation) and APBO (Accumulated postretirement benefit obligation) incorporate various assumptions including the discount rates, the rates of increases in compensation, healthcare cost trend rates, mortality, retirement timing, employee turnover and other demographic assumptions. The discount rate is determined based on the prevailing year-end rates for high-grade corporate bonds with a duration matching the expected cash flow timing of the benefit payments from the various plans. The remaining assumptions are based on our estimates of future events by incorporating historical trends and future expectations. The amount of net periodic cost that is recorded in the Statements of Consolidated Operations consists of several components including service cost, interest cost, expected return on plan assets, and amortization of previously unrecognized amounts. Service cost represents the value of the benefits earned in the current year by the participants. Interest cost represents the cost associated with the passage of time. Certain items, such as plan amendments, gains and/or losses resulting from differences between actual and assumed results for demographic and economic factors affecting the obligations and assets of the plans, and changes in other assumptions are subject to deferred recognition for income and expense purposes. The expected return on plan assets is calculated on a plan-by-plan basis using each plan's strategic asset allocation and our expected long-term capital market return assumptions. Service costs are classified within Cost of goods sold, Selling, general and administrative expenses and Miscellaneous – net while the interest cost, expected return on assets,
amortization of prior service costs/credits, net actuarial gain/loss, and other costs are classified within Net periodic benefit credits other than service cost component.
Cumulative actuarial gains and losses will be amortized to expense using the corridor method, where gains and losses are recognized if they exceed 10% of the greater of the fair value of plan assets or the plans' benefit obligations. The amortization period varies by plan.
ASSET RETIREMENT OBLIGATIONS
An asset retirement obligation is recognized when incurred if a reasonable estimate of fair value can be made, and is initially measured at fair value. The fair value of the liability is determined as the discounted value of the expected future cash flows. The asset retirement obligation is accreted over time through periodic charges to earnings. In addition, the asset retirement cost is capitalized and amortized over the life of the related asset. Reclamation costs are adjusted periodically to reflect changes in the estimated present value resulting from the passage of time and revisions to the estimates of either the timing or amount of the reclamation costs. We review, on an annual basis, unless otherwise deemed necessary, the asset retirement obligation for each applicable operation in accordance with the provisions of ASC Topic 410, Asset Retirement and Environmental Obligations. We perform an in-depth evaluation of the liability every three years in addition to our routine annual assessments.
Future reclamation costs for inactive operations are accrued based on management’s best estimate at the end of each period of the costs expected to be incurred at a site. Such cost estimates include, where applicable, ongoing maintenance and monitoring costs. Changes in estimates at inactive operations are reflected in Miscellaneous – net on the Statements of Consolidated Operations in the period an estimate is revised.
ENVIRONMENTAL REMEDIATION COSTS
Our operating activities are subject to various laws and regulations governing protection of the environment. We conduct our operations to protect the public health and environment and believe our operations are in compliance with applicable laws and regulations in all material respects. Our environmental liabilities, including obligations for known environmental remediation exposures, have been recognized based on the estimated cost of investigation and remediation at each site. If the cost can only be estimated as a range of possible amounts with no point in the range being more likely, the minimum of the range is accrued. Future expenditures are discounted unless the amount and timing of the cash disbursements cannot be reasonably estimated. It is possible that additional environmental obligations could be incurred, the extent of which cannot be assessed. Potential insurance recoveries have not been reflected in the determination of the liabilities.
REVENUE RECOGNITION
Sales are recognized when our performance obligations are satisfied. Generally, our performance obligations are satisfied, control of our products is transferred and revenue is recognized at a single point in time, according to shipping terms. Shipping and other transportation costs charged to customers are treated as fulfillment activities and are recorded in both revenue and cost of sales at the time control is transferred to the customer.
REPAIRS AND MAINTENANCE
Repairs, maintenance and replacement of components are expensed as incurred. The cost of major equipment overhauls is capitalized and depreciated over the estimated useful life, which is the period until the next scheduled overhauls. All other planned and unplanned repairs and maintenance costs are expensed when incurred.
INCOME TAXES
Income taxes are based on income for financial reporting purposes, calculated using tax rates by jurisdiction, and reflect a current tax liability or asset for the estimated taxes payable or recoverable on the current year tax return and expected annual changes in deferred taxes. Any interest or penalties on income tax are recognized as a component of Income tax benefit (expense).
We account for income taxes under the asset and liability method, which requires the recognition of deferred tax assets and liabilities for the expected future tax consequences of events that have been included in the financial statements. Under this method, deferred tax assets and liabilities are determined based on the differences between the financial statement and tax basis of assets and liabilities using enacted tax rates in effect for the year in which the differences are expected to reverse. The effect of a change in tax rates on deferred tax assets and liabilities is recognized within Income tax benefit (expense) in the period that includes the enactment date. We recognize income tax effects from accumulated other comprehensive income when individual assets or liabilities are sold, terminated, or extinguished.
We record net deferred tax assets to the extent we believe these assets will more likely than not be realized. In making such determination, we consider all available positive and negative evidence, including scheduled reversals of deferred tax liabilities, projected future taxable income, tax planning strategies and recent financial results of operations.
Accounting for uncertainty in income taxes recognized in the financial statements requires that a tax benefit from an uncertain tax position be recognized when it is more likely than not that the position will be sustained upon examination, including resolutions of any related appeals or litigation processes, based on technical merits.
FOREIGN CURRENCY
Our financial statements are prepared with the U.S. dollar as the reporting currency. Our functional currency is the U.S. dollar, with the exception of our Stelco and European subsidiaries, of which the functional currencies are the Canadian dollar and Euro, respectively. To the extent that the parent, or any subsidiaries of the parent, have monetary assets and liabilities, inclusive of short-term and certain long-term intercompany loans, recorded in a currency other than the foreign subsidiaries functional currency, these amounts are remeasured each reporting period, with the resulting gain or loss being included within Miscellaneous – net in the Statements of Consolidated Operations. Subsequently, the financial statements of foreign subsidiaries with a non-U.S. dollar functional currency are translated into U.S. dollars using the exchange rate at each balance sheet date for assets and liabilities and a weighted average exchange rate for each period for revenues, expenses, gains and losses. These translation adjustments are recorded to Accumulated other comprehensive income on the Statements of Consolidated Financial Position.
EARNINGS PER SHARE
We present both basic and diluted earnings per share amounts for continuing operations and discontinued operations. Total basic earnings per share amounts are calculated by dividing Net income (loss) attributable to Cliffs shareholders by the weighted average number of common shares outstanding during the period presented. Total diluted earnings per share amounts are calculated by dividing Net income (loss) attributable to Cliffs shareholders by the weighted average number of common shares and common share equivalents under stock plans using the treasury-stock method. Common share equivalents are excluded from EPS computations in the periods in which they have an anti-dilutive effect.
VARIABLE INTEREST ENTITIES
We assess whether we have a variable interest in legal entities in which we have a financial relationship and, if so, whether or not those entities are VIEs. A VIE is an entity with insufficient equity at risk for the entity to finance its activities without additional subordinated financial support or in which equity investors lack the characteristics of a controlling financial interest. If an entity is determined to be a VIE, we evaluate whether we are the primary beneficiary. The primary beneficiary analysis is a qualitative analysis based on power and economics. We conclude that we are the primary beneficiary and consolidate the VIE if we have both (i) the power to direct the activities of the VIE that most significantly influence the VIE's economic performance and (ii) the obligation to absorb losses of, or the right to receive benefits from, the VIE that could potentially be significant to the VIE.
RECENT ACCOUNTING PRONOUNCEMENTS AND LEGISLATION
ACCOUNTING PRONOUNCEMENTS - ISSUED AND ADOPTED
In September 2022, the FASB issued ASU No. 2022-04, Liabilities - Supplier Finance Programs (Subtopic 405-50): Disclosure of Supplier Finance Program Obligations. This guidance requires annual and interim disclosure of the key terms of outstanding supplier finance programs and a roll-forward of the related obligations. The new standard does not affect the recognition, measurement or financial statement presentation of the supplier finance program obligations. At December 31, 2023, we had adopted this standard, with the exception of the roll-forward disclosure requirement, which was adopted as of December 31, 2024. Refer to NOTE 2 - SUPPLEMENTARY FINANCIAL STATEMENT INFORMATION for further information.
In November 2023, the FASB issued ASU No. 2023-07, Segment Reporting (Topic 280): Improvements to Reportable Segment Disclosures. This guidance requires additional annual and interim disclosures for reportable segments. This new standard does not affect the recognition, measurement or financial statement presentation. As of December 31, 2024, we have adopted this standard and applied the amendment retrospectively to all prior periods presented. Refer to NOTE 5 - SEGMENT REPORTING for further information.
ACCOUNTING PRONOUNCEMENTS - ISSUED AND NOT EFFECTIVE
In December 2023, the FASB issued ASU No. 2023-09, Income Taxes (Topic 740): Improvements to Income Tax Disclosures. This guidance requires additional annual and interim disclosures for income taxes. This new standard does not affect the recognition, measurement or financial statement presentation. The amendments are effective for fiscal years beginning after December 15, 2024.
In November 2024, the FASB issued ASU No. 2024-03, Income Statement—Reporting Comprehensive Income (Subtopic 220-40): Disaggregation of Income Statement Expenses. This new standard does not affect the recognition, measurement or financial statement presentation. However, this guidance does require additional annual and interim disclosures related to the disaggregation of various income statement expense captions. The amendments are effective for annual reporting periods beginning after December 15, 2026, and interim reporting periods beginning after December 15, 2027.
NOTE 2 - SUPPLEMENTARY FINANCIAL STATEMENT INFORMATION
INVENTORIES
The following table presents the detail of our Inventories on the Statements of Consolidated Financial Position:
| | | | | | | | | | | |
| December 31, |
| (In millions) | 2024 | | 2023 |
| Product inventories | | | |
| Finished and semi-finished goods | $ | 2,393 | | | $ | 2,573 | |
| Raw materials | 2,208 | | | 1,476 | |
| Total product inventories | 4,601 | | | 4,049 | |
| Manufacturing supplies and critical spares | 493 | | | 411 | |
| Inventories | $ | 5,094 | | | $ | 4,460 | |
The excess of current cost over LIFO cost of iron ore inventories was $142 million and $131 million at December 31, 2024 and 2023, respectively. As of December 31, 2024, the product inventory balance for iron ore inventories increased, resulting in a LIFO increment in 2024. The effect of the inventory build was an increase in Inventories of $64 million on the Statements of Consolidated Financial Position for the year ended December 31, 2024. As of December 31, 2023, the product inventory balance for iron ore inventories increased, resulting in a LIFO increment in 2023. The effect of the inventory build was an increase in Inventories of $21 million on the Statements of Consolidated Financial Position for the year ended December 31, 2023.
SUPPLY CHAIN FINANCE PROGRAMS
We negotiate payment terms directly with our suppliers for the purchase of goods and services. We currently offer voluntary supply chain finance programs that enable our suppliers to sell their Company receivables to financial intermediaries, at the sole discretion of both the suppliers and financial intermediaries. No guarantees are provided by us or our subsidiaries under the supply chain finance programs. The supply chain finance programs allow our suppliers to be paid by the financial intermediaries earlier than the due date on the applicable invoice. Supply chain finance programs that extend terms or provide us an economic benefit are classified as short-term financings. As of December 31, 2024 and 2023, we had $29 million and $21 million, respectively, deemed as short-term financings that are classified in Other current liabilities. Additionally, as of December 31, 2024 and 2023, we had $76 million and $91 million, respectively, classified as Accounts payable.
The following is a roll-forward of our obligations related to supply chain finance programs classified in Other current liabilities:
| | | | | | | |
| (In millions) | 2024 | | |
| Supply chain finance obligations as of January 1 | $ | 21 | | | |
| Invoices confirmed during the year | 230 | | | |
| Confirmed invoices paid during the year | (222) | | | |
| Supply chain finance obligations as of December 31 | $ | 29 | | | |
The following is a roll-forward of our obligations related to supply chain finance programs classified in Accounts payable:
| | | | | | | |
| (In millions) | 2024 | | |
| Supply chain finance obligations as of January 1 | $ | 91 | | | |
| Invoices confirmed during the year | 375 | | | |
| Confirmed invoices paid during the year | (390) | | | |
| Supply chain finance obligations as of December 31 | $ | 76 | | | |
WEIRTON INDEFINITE IDLE
On February 15, 2024, we announced the indefinite idle of our tinplate production plant located in Weirton, West Virginia. As of December 31, 2024, we have incurred $210 million of charges related to the idle and estimate that we will incur nominal future charges to Restructuring and other charges.
The following table represents a reconciliation of our accrued liabilities related to the Weirton indefinite idle:
| | | | | | | | | | | | | | | | | | | | | | | |
| (In millions) | Employee-Related Costs | | Exit Costs | | Asset Impairment | | Total |
| Balance as of December 31, 2023 | $ | — | | | $ | — | | | $ | — | | | $ | — | |
Costs incurred1 | 82 | | | 49 | | | 79 | | | 210 |
| Cash payments | (26) | | | (34) | | | — | | | (60) | |
| Non-cash | — | | | — | | | (79) | | | (79) | |
| Balance as of December 31, 2024 | $ | 56 | | | $ | 15 | | | $ | — | | | $ | 71 | |
| | | | | | | |
1 Of the $210 million of cost incurred, $129 million was recorded in Restructuring and other charges, $79 million was recorded in Asset impairments and $2 million was recorded in Net periodic benefit credits other than service cost component. |
SALE OF BUSINESS
On October 6, 2023, we entered into a membership interest purchase agreement for the sale of the legal entities owning, among other things, our closed coal mines in Pennsylvania. As a result of the sale, we recorded a gain of $63 million classified in Miscellaneous – net in the Statements of Consolidated Operations and as Other in operating activities on the Statements of Consolidated Cash Flows for the year ended December 31, 2023. As part of this transaction, we received $35 million in proceeds related to the sale that is classified as Other investing activities on the Statements of Consolidated Cash Flows.
CASH FLOW INFORMATION
A reconciliation of capital additions to cash paid for capital expenditures is as follows:
| | | | | | | | | | | | | | | | | |
| Year Ended December 31, |
| (In millions) | 2024 | | 2023 | | 2022 |
| Capital additions | $ | 817 | | | $ | 785 | | | $ | 1,033 | |
| Less: | | | | | |
| Non-cash accruals | (47) | | | (13) | | | 35 | |
| Equipment financed with seller | 72 | | | 59 | | | — | |
| Right-of-use assets - finance leases | 97 | | | 93 | | | 55 | |
| Cash paid for capital expenditures including deposits | $ | 695 | | | $ | 646 | | | $ | 943 | |
Additionally, included within Other investing activities on the Statements of Consolidated Cash Flows are grant reimbursements related to governmental funded capital projects. For the years ended December 31, 2024, 2023 and 2022, grant reimbursements were $8 million, $13 million and $27 million, respectively.
Cash payments (receipts) for interest and income taxes are as follows:
| | | | | | | | | | | | | | | | | |
| Year Ended December 31, |
| (In millions) | 2024 | | 2023 | | 2022 |
| Income taxes paid | $ | 17 | | | $ | 94 | | | $ | 334 | |
| Income tax refunds | (47) | | | (205) | | | (3) | |
Interest paid on debt obligations net of capitalized interest1 | 255 | | | 256 | | | 249 | |
| | | | | |
1 Capitalized interest was $15 million, $12 million and $9 million for the years ended December 31, 2024, 2023 and 2022, respectively. |
Other non-cash investing and financing activities are as follows:
| | | | | | | | | | | | | | | | | |
| Year Ended December 31, |
| (In millions) | 2024 | | 2023 | | 2022 |
| Fair value of common shares issued as part of consideration in connection with the Stelco Acquisition | $ | 343 | | | $ | — | | | $ | — | |
| 1.500% 2025 Convertible Senior Notes redemption | — | | | — | | | 25 | |
NOTE 3 - ACQUISITIONS
STELCO ACQUISITION OVERVIEW
On November 1, 2024, pursuant to the Arrangement Agreement, we completed the Stelco Acquisition, in which we were the acquirer. The Stelco Acquisition expands our existing presence in Canada and diversifies our customer base across service centers, construction and other industrial end markets with higher volumes of spot sales.
Following the Stelco Acquisition, the operating results of Stelco are included in our consolidated financial statements. For the period subsequent to the acquisition (November 1, 2024 through December 31, 2024), Stelco generated Revenues of $329 million and a loss of $58 million included within Net income (loss) attributable to Cliffs shareholders.
Additionally, we incurred acquisition related costs of $42 million for the year ended December 31, 2024, in connection with the Stelco Acquisition, which were recorded in Acquisition-related costs on the Statements of Consolidated Operations.
The Stelco Acquisition was accounted for under the acquisition method of accounting for business combinations.
The fair value of the total purchase consideration was determined as follows:
| | | | | |
| (In millions) | |
| Total cash consideration | $ | 2,450 | |
| Total share exchange consideration | 343 | |
| Total debt consideration | 415 | |
| Total purchase consideration | $ | 3,208 | |
Total consideration shares are calculated as follows:
| | | | | |
| Number of outstanding Stelco shares | 54,448,388 | |
| Number of outstanding share-based compensation awards | 2,516,415 | |
| Total consideration shares | 56,964,803 | |
Total estimated cash consideration is calculated as follows:
| | | | | |
| Number of consideration shares | 56,964,803 | |
| Consideration share price per share (CAD) | $ | 60.00 | |
| Total cash consideration (CAD) (in millions) | 3,418 | |
| Exchange rate (November 1, 2024) | 0.7168 | |
| Total cash consideration (USD) | $ | 2,450 | |
The fair value of share exchange consideration is as follows:
| | | | | |
| Number of consideration shares | 56,964,803 | |
| Fixed share exchange factor | 0.454 | |
| Total Cliffs exchange shares | 25,862,021 | |
| Cliffs share price at closing date (November 1, 2024) | $ | 13.27 | |
| Total share exchange consideration (in millions) | $ | 343 | |
The fair value of debt consideration includes outstanding obligations with preexisting change-in-control provisions requiring repayment at the time of closing. The debt consideration includes amounts repaid in connection with retiring Stelco's asset-based lending facility and inventory monetization arrangement.
VALUATION ASSUMPTION AND PURCHASE PRICE ALLOCATION
We estimated fair values at November 1, 2024 for the preliminary allocation of consideration to the net tangible and intangible assets acquired and liabilities assumed in connection with the Stelco Acquisition. During the measurement period, we will continue to obtain information to assist in finalizing the fair value of assets acquired and liabilities assumed, which may differ materially from these preliminary estimates. If we determine any measurement period adjustments are material, we will apply those adjustments, including any related impacts to net income, in the reporting period in which the adjustments are determined. We are in the process of conducting a valuation of the assets acquired and liabilities assumed related to the Stelco Acquisition, most notably, inventories, personal and real property, leases, deferred taxes, employee benefit commitments, financing obligations, environmental obligations, asset retirement obligations and intangible assets, and the final allocation will be made when completed, including the result of any identified goodwill. Accordingly, the provisional measurements noted below are preliminary and subject to modification in the future.
The preliminary purchase price allocation to assets acquired and liabilities assumed in the Stelco Acquisition was:
| | | | | | | | | |
| (in Millions) | | | | |
| Cash and cash equivalents | $ | 341 | | | | | |
| Accounts receivable | 104 | | | | | |
| Inventories | 726 | | | | | |
| Other current assets | 107 | | | | | |
| Property, plant and equipment | 1,286 | | | | | |
| Intangible assets | 1,025 | | | | | |
| Other non-current assets | 250 | | | | | |
| Accounts payable | (212) | | | | | |
| Accrued employment costs | (29) | | | | | |
| Accrued expenses | (6) | | | | | |
| Other current liabilities | (71) | | | | | |
| Pension and OPEB liability, non-current | (14) | | | | | |
| Deferred income taxes | (449) | | | | | |
| Asset retirement and environmental obligations | (20) | | | | | |
| Other non-current liabilities | (616) | | | | | |
| Net identifiable assets acquired | 2,422 | | | | | |
| Goodwill | 786 | | | | | |
| Total net assets acquired | $ | 3,208 | | | | | |
The goodwill resulting from the Stelco Acquisition primarily represents the growth opportunities through diversification within our customer base across service centers, construction and other industrial end markets with higher volumes of spot sales, as well as any synergistic benefits to be realized from the Stelco Acquisition within our Steelmaking segment. Goodwill is not expected to be deductible for U.S. federal income tax purposes.
The purchase price allocated to identifiable intangible assets acquired was:
| | | | | | | | | | | |
| (In millions) | | Weighted Average Life (In years) |
| Intangible assets: | | | |
| Customer relationships | 953 | | 15 |
| Trade names and trademarks | 72 | | 15 |
| Total identifiable intangible assets | $ | 1,025 | | | 15 |
PRO FORMA RESULTS
The following table provides unaudited pro forma financial information, prepared in accordance with Topic 805, as if Stelco had been acquired as of January 1, 2023:
| | | | | | | | | | | |
| Year Ended December 31, |
| (In millions) | 2024 | | 2023 |
| Revenues | $ | 20,874 | | | $ | 24,158 | |
| Net income (loss) attributable to Cliffs shareholders | (623) | | | 216 | |
The unaudited pro forma financial information has been calculated after applying our accounting policies and adjusting the historical results with pro forma adjustments, net of tax, that assume the Stelco Acquisition occurred on January 1, 2023. Significant non-recurring pro forma adjustments include the following:
1.The 2024 pro forma net loss was adjusted to exclude $23 million of non-recurring inventory acquisition accounting adjustments incurred during the year ended December 31, 2024. The 2023 pro forma net income was adjusted to include $23 million of non-recurring inventory acquisition accounting adjustments for the year ended December 31, 2023.
2.The 2024 pro forma net loss was adjusted to exclude $63 million of transaction costs incurred by Cliffs and Stelco in connection with the Stelco Acquisition for the year ended December 31, 2024. The 2023 pro forma net income was adjusted to include $63 million of transaction cost adjustments for the year ended December 31, 2023.
The unaudited pro forma financial information does not reflect the potential realization of synergies or cost savings, nor does it reflect other costs relating to the integration of the acquired company. This unaudited pro forma financial information should not be
considered indicative of the results that would have actually occurred if the Stelco Acquisition had been consummated on January 1, 2023, nor are they indicative of future results.
NOTE 4 - REVENUES
We generate our revenue through product sales, in which shipping terms indicate when we have fulfilled our performance obligations and transferred control of products to our customer. Our revenue transactions consist of a single performance obligation to transfer promised goods. Our contracts with customers define the mechanism for determining the sales price, which is generally fixed upon transfer of control, but the contracts generally do not impose a specific quantity on either party. Quantities to be delivered to the customer are determined at a point near the date of delivery through purchase orders or other written instructions we receive from the customer. Spot market sales are made through purchase orders or other written instructions. We consider our performance obligation to be complete and recognize revenue when control transfers in accordance with shipping terms.
Revenue is measured as the amount of consideration we expect to receive in exchange for transferring product. We reduce the amount of revenue recognized for estimated returns and other customer credits, such as discounts and volume rebates, based on the expected value to be realized. Payment terms are consistent with terms standard to the markets we serve. Sales taxes collected from customers are excluded from revenues. Revenue by market and product are presented net of intersegment revenues, which are entirely related to the Steelmaking segment.
The following table represents our Revenues by market:
| | | | | | | | | | | | | | | | | |
| Year Ended December 31, |
| (In millions) | 2024 | | 2023 | | 2022 |
| Steelmaking: | | | | | |
| Automotive | $ | 5,571 | | | $ | 7,440 | | | $ | 6,661 | |
| Infrastructure and manufacturing | 5,208 | | | 5,612 | | | 5,869 | |
| Distributors and converters | 5,281 | | | 5,330 | | | 6,388 | |
Steel producers | 2,469 | | | 2,949 | | | 3,465 | |
| Total Steelmaking | 18,529 | | | 21,331 | | | 22,383 | |
| Other Businesses: | | | | | |
| Automotive | 540 | | | 545 | | | 478 | |
| Infrastructure and manufacturing | 39 | | | 38 | | | 52 | |
| Distributors and converters | 77 | | | 82 | | | 76 | |
| Total Other Businesses | 656 | | | 665 | | | 606 | |
| Total revenues | $ | 19,185 | | | $ | 21,996 | | | $ | 22,989 | |
The following table represents our Revenues by product line:
| | | | | | | | | | | | | | | | | |
| Year Ended December 31, |
| (In millions) | 2024 | | 2023 | | 2022 |
| Steelmaking: | | | | | |
| Hot-rolled steel | $ | 4,276 | | | $ | 4,864 | | | $ | 4,529 | |
| Cold-rolled steel | 2,712 | | | 2,658 | | | 3,193 | |
| Coated steel | 5,773 | | | 6,661 | | | 6,905 | |
| Stainless and electrical steel | 1,807 | | | 2,281 | | | 2,284 | |
| Plate | 1,119 | | | 1,444 | | | 1,651 | |
| Slab and other steel products | 1,178 | | | 1,329 | | | 1,492 | |
| Other | 1,664 | | | 2,094 | | | 2,329 | |
| Total Steelmaking | 18,529 | | | 21,331 | | | 22,383 | |
| Other Businesses: | | | | | |
| Other | 656 | | | 665 | | | 606 | |
| Total revenues | $ | 19,185 | | | $ | 21,996 | | | $ | 22,989 | |
NOTE 5 - SEGMENT REPORTING
We are vertically integrated from mined raw materials and direct reduced iron and ferrous scrap to primary steelmaking and downstream finishing, stamping, tooling and tubing. We are organized into four operating segments based on our differentiated products - Steelmaking, Tubular, Tooling and Stamping, and European Operations. We have one reportable segment - Steelmaking. The operating segment results of our Tubular, Tooling and Stamping, and European Operations that do not constitute reportable segments are combined and disclosed in the Other Businesses category. Our Steelmaking segment operates as a leading North America-based steel producer with focus on value-added sheet products, primarily serving the automotive, infrastructure and manufacturing, and distributors and converters markets. Our Other Businesses primarily include the operating segments that provide customer solutions with carbon and stainless steel tubing products, advanced-engineered solutions, tool design and build, hot- and cold-stamped steel components, and complex assemblies. All intersegment transactions were eliminated in consolidation. Corporate assets and capital additions are primarily related to and support the operations of the Steelmaking segment and therefore have been incorporated within the Steelmaking segment total assets and capital additions below. We allocate Corporate Selling, general and administrative expenses to our operating segments.
Our CODM, Lourenco Goncalves, Chairman, President and CEO, evaluates performance on an operating segment basis, as well as a consolidated basis, based on Adjusted EBITDA, which is a non-GAAP measure. This measure is used by our CODM, management, investors, lenders and other external users of our financial statements to assess our operating performance and to compare operating performance to other companies in the steel industry. In addition, our CODM believes Adjusted EBITDA is a useful measure to assess the earnings power of the business without the impact of capital structure and can be used to assess our ability to service debt and fund future capital expenditures in the business.
The following tables provide our results by segment as well as a reconciliation from consolidated Adjusted EBITDA to our consolidated Net income (loss):
| | | | | | | | | | | | | | | | | | | | | | | |
| Year Ended December 31, 2024 |
| (In millions) | Steelmaking | | Other Businesses | | Eliminations | | Total |
| Revenues | $ | 18,620 | | | $ | 656 | | | $ | (91) | | | $ | 19,185 | |
| Cost of goods sold | (18,605) | | | (606) | | | 96 | | | (19,115) | |
| Selling, general and administrative expenses | (457) | | | (29) | | | — | | | (486) | |
| Net periodic benefit credits other than service cost component | 247 | | | — | | | — | | | 247 | |
| Excluding depreciation, depletion and amortization | 919 | | | 32 | | | — | | | 951 | |
Other segment items1 | (2) | | | — | | | — | | | (2) | |
| Total Adjusted EBITDA | $ | 722 | | | $ | 53 | | | $ | 5 | | | $ | 780 | |
| | | | | | | |
| Interest expense, net | | | | | | | $ | (370) | |
| Income tax benefit | | | | | | | 235 | |
| Depreciation, depletion and amortization | | | | | | | (951) | |
EBITDA from noncontrolling interests2 | | | | | | | 76 | |
| Weirton indefinite idle | | | | | | | (217) | |
| Arbitration decision | | | | | | | (71) | |
| Acquisition-related costs | | | | | | | (44) | |
| Changes in fair value of derivatives, net | | | | | | | (41) | |
| Loss on extinguishment of debt | | | | | | | (27) | |
| Amortization of inventory step-up | | | | | | | (26) | |
| Loss on currency exchange | | | | | | | (20) | |
| Loss on disposal of assets | | | | | | | (16) | |
| Other, net | | | | | | | (16) | |
| Net loss | | | | | | | $ | (708) | |
| | | | | | | |
| Capital Additions | $ | 812 | | | $ | 5 | | | $ | — | | | $ | 817 | |
| Assets | $ | 20,327 | | | $ | 620 | | | $ | — | | | $ | 20,947 | |
| | | | | | | |
1 Other segment items primarily consists of the exclusion of EBITDA of noncontrolling interests and the Arbitration decision from Adjusted EBITDA and, to a lesser extent, the inclusion of items within Miscellaneous – net and Other non-operating income (loss). |
2 EBITDA of noncontrolling interests includes net income attributable to noncontrolling interests of $46 million and the exclusion of depreciation, depletion, and amortization of $30 million. |
| | | | | | | | | | | | | | | | | | | | | | | |
| Year Ended December 31, 2023 |
| (In millions) | Steelmaking | | Other Businesses | | Eliminations | | Total |
| Revenues | $ | 21,413 | | | $ | 665 | | | $ | (82) | | | $ | 21,996 | |
| Cost of goods sold | (20,055) | | | (627) | | | 77 | | (20,605) | |
| Selling, general and administrative expenses | (549) | | | (28) | | | — | | | (577) | |
| Net periodic benefit credits other than service cost component | 204 | | — | | | — | | | 204 | |
| Excluding depreciation, depletion and amortization | 938 | | 35 | | — | | | 973 | |
Other segment items1 | (78) | | | (2) | | | — | | | (80) | |
| Total Adjusted EBITDA | $ | 1,873 | | | $ | 43 | | | $ | (5) | | | $ | 1,911 | |
| | | | | | | |
| Interest expense, net | | | | | | | $ | (289) | |
| Income tax expense | | | | | | | (148) | |
| Depreciation, depletion and amortization | | | | | | | (973) | |
EBITDA from noncontrolling interests2 | | | | | | | 83 |
| Acquisition-related costs | | | | | | | (12) | |
| Loss on disposal of assets | | | | | | | (15) | |
| Goodwill impairment | | | | | | | (125) | |
| Other, net | | | | | | | 18 | |
| Net income | | | | | | | $ | 450 | |
| | | | | | | |
| Capital Additions | $ | 782 | | | $ | 3 | | | $ | — | | | $ | 785 | |
| Assets | $ | 16,880 | | | $ | 657 | | | $ | — | | | $ | 17,537 | |
| | | | | | | |
1 Other segment items primarily consists of the exclusion of EBITDA of noncontrolling interests from Adjusted EBITDA and, to a lesser extent, the inclusion of items within Miscellaneous – net and Other non-operating income (loss). |
2 EBITDA of noncontrolling interests includes net income attributable to noncontrolling interests of $51 million and the exclusion of depreciation, depletion, and amortization of $32 million. |
| | | | | | | | | | | | | | | | | | | | | | | |
| Year Ended December 31, 2022 |
| (In millions) | Steelmaking | | Other Businesses | | Eliminations | | Total |
| Revenues | $ | 22,462 | | | $ | 606 | | | $ | (79) | | | $ | 22,989 | |
| Cost of goods sold | (20,004) | | | (557) | | | 90 | | | (20,471) | |
| Selling, general and administrative expenses | (439) | | | (26) | | | — | | | (465) | |
| Net periodic benefit credits other than service cost component | 212 | | — | | | — | | | 212 | |
| Excluding depreciation, depletion and amortization | 994 | | 40 | | | — | | | 1,034 | |
Other segment items1 | (136) | | | 6 | | | — | | | (130) | |
| Total Adjusted EBITDA | $ | 3,089 | | | $ | 69 | | | $ | 11 | | | $ | 3,169 | |
| | | | | | | |
| Interest expense, net | | | | | | | $ | (276) | |
| Income tax expense | | | | | | | (423) | |
| Depreciation, depletion and amortization | | | | | | | (1,034) | |
EBITDA from noncontrolling interests2 | | | | | | | 74 |
| Acquisition-related costs | | | | | | | (1) | |
| Loss on extinguishment of debt | | | | | | | (75) | |
| Loss on disposal of assets | | | | | | | (22) | |
| Other, net | | | | | | | (36) | |
| Net income | | | | | | | $ | 1,376 | |
| | | | | | | |
| Capital Additions | $ | 1,003 | | | $ | 30 | | | $ | — | | | $ | 1,033 | |
| Assets | $ | 17,918 | | | $ | 837 | | | $ | — | | | $ | 18,755 | |
| | | | | | | |
1 Other segment items primarily consists of the exclusion of EBITDA of noncontrolling interests from Adjusted EBITDA and, to a lesser extent, the inclusion of items within Miscellaneous – net and Other non-operating income (loss). |
2 EBITDA of noncontrolling interests includes net income attributable to noncontrolling interests of $41 million and the exclusion of depreciation, depletion, and amortization of $33 million. |
Included in the consolidated financial statements are the following amounts relating to geographic location based on product destination:
| | | | | | | | | | | | | | | | | |
| Year Ended December 31, |
| (In millions) | 2024 | | 2023 | | 2022 |
| Revenues: | | | | | |
| United States | $ | 17,340 | | | $ | 20,000 | | | $ | 20,991 | |
| Canada | 1,067 | | | 1,046 | | | 963 | |
| Other countries | 778 | | | 950 | | | 1,035 | |
| Total revenues | $ | 19,185 | | | $ | 21,996 | | | $ | 22,989 | |
| Property, plant and equipment, net: | | | | | |
| United States | $ | 8,622 | | | $ | 8,816 | | | $ | 8,981 | |
| Canada | 1,319 | | | 78 | | | 88 | |
| Other countries | 1 | | | 1 | | | 1 | |
| Total property, plant and equipment, net | $ | 9,942 | | | $ | 8,895 | | | $ | 9,070 | |
NOTE 6 - PROPERTY, PLANT AND EQUIPMENT
The following table indicates the carrying value of each of the major classes of our depreciable assets:
| | | | | | | | | | | |
| December 31, |
| (In millions) | 2024 | | 2023 |
| Land, land improvements and mineral rights | $ | 1,451 | | | $ | 1,389 | |
| Buildings | 1,104 | | | 946 | |
| Equipment | 11,119 | | | 9,680 | |
| Other | 349 | | | 302 | |
| Construction in progress | 728 | | | 590 | |
Total property, plant and equipment1 | 14,751 | | | 12,907 | |
| Allowance for depreciation and depletion | (4,809) | | | (4,012) | |
| Property, plant and equipment, net | $ | 9,942 | | | $ | 8,895 | |
| | | |
1 Includes right-of-use assets related to finance leases of $505 million and $306 million as of December 31, 2024 and 2023, respectively. |
We recorded depreciation expense of $903 million, $932 million and $988 million for the years ended December 31, 2024, 2023 and 2022, respectively. Depreciation expense for the year ended December 31, 2022 includes $23 million of accelerated depreciation related to the decision to indefinitely idle the coke facility at Middletown Works and $68 million of accelerated depreciation related to the indefinite idle of the Indiana Harbor #4 blast furnace.
The net book value of the mineral and land rights are as follows:
| | | | | | | | | | | |
| December 31, |
| (In millions) | 2024 | | 2023 |
| Mineral rights: | | | |
| Cost | $ | 783 | | | $ | 783 | |
| Depletion | (287) | | | (258) | |
| Net mineral rights | $ | 496 | | | $ | 525 | |
| | | |
| Land rights | $ | 467 | | | $ | 427 | |
We recorded depletion expense of $29 million, $33 million and $38 million for the years ended December 31, 2024, 2023, and 2022, respectively.
NOTE 7 - GOODWILL AND INTANGIBLE ASSETS AND LIABILITIES
GOODWILL
The following is a summary of Goodwill by segment:
| | | | | | | | | | | |
| December 31, |
| (In millions) | 2024 | | 2023 |
| Steelmaking | $ | 1,719 | | | $ | 956 | |
| Other Businesses | 49 | | | 49 | |
| Total goodwill | $ | 1,768 | | | $ | 1,005 | |
The increase in the balance of Goodwill in our Steelmaking segment as of December 31, 2024, compared to December 31, 2023, is due to the preliminary purchase price allocation of goodwill in 2024, related to the Stelco Acquisition.
INTANGIBLE ASSETS AND LIABILITIES
The following is a summary of our intangible assets and liabilities:
| | | | | | | | | | | | | | | | | | | | | | | | | | | | | | | | | | | |
| December 31, 2024 | | December 31, 2023 |
| (In millions) | Gross Amount | | Accumulated Amortization | | Net Amount | | Gross Amount | | Accumulated Amortization | | Net Amount |
Intangible assets1: | | | | | | | | | | | |
| Customer relationships | $ | 1,015 | | | $ | (34) | | | $ | 981 | | | $ | 90 | | | $ | (18) | | | $ | 72 | |
| Developed technology | 60 | | | (17) | | | 43 | | | 60 | | | (14) | | | 46 | |
| Trade names and trademarks | 87 | | | (8) | | | 79 | | | 18 | | | (5) | | | 13 | |
| Mining permits | 72 | | | (29) | | | 43 | | | 72 | | | (28) | | | 44 | |
| Supplier relationships | 29 | | | (5) | | | 24 | | | 29 | | | (3) | | | 26 | |
| Total intangible assets | $ | 1,263 | | | $ | (93) | | | $ | 1,170 | | | $ | 269 | | | $ | (68) | | | $ | 201 | |
Intangible liabilities2: | | | | | | | | | | | |
| Above-market supply contracts | $ | (71) | | | $ | 30 | | | $ | (41) | | | $ | (71) | | | $ | 24 | | | $ | (47) | |
| | | | | | | | | | | |
1 Amortization related to mining permits is recognized in Cost of goods sold. Amortization of all other intangible assets is recognized in Selling, general and administrative expenses. |
2 Intangible liabilities are classified as Other non-current liabilities. Amortization of all intangible liabilities is recognized in Cost of goods sold. |
Amortization expense related to Intangible assets was $24 million and $13 million for the years ended December 31, 2024 and 2023, respectively. Estimated future amortization expense related to intangible assets is $79 million annually for the years 2025 through 2029.
Income from amortization related to intangible liabilities was $5 million for both the years ended December 31, 2024 and 2023. Estimated future amortization income related to the intangible liabilities is $5 million annually for the years 2025 through 2029.
The increase in the balance of Intangible assets as of December 31, 2024, compared to December 31, 2023, is due to the preliminary purchase price allocation to intangible assets in 2024, related to the Stelco Acquisition.
NOTE 8 - DEBT AND CREDIT FACILITIES
The following represents a summary of our long-term debt:
| | | | | | | | | | | | | | | | | | | | | | | | | | |
| (In Millions) |
| Debt Instrument | | Issuer1 | | Annual Effective Interest Rate | | December 31, 2024 | | December 31, 2023 |
| Senior Secured Notes: | | | | | | | | |
6.750% 2026 Senior Secured Notes | | Cliffs | | 6.990% | | — | | | 829 | |
| Senior Unsecured Notes: | | | | | | | | |
7.000% 2027 Senior Notes | | Cliffs | | 9.240% | | 73 | | | 73 | |
7.000% 2027 AK Senior Notes | | AK Steel | | 9.240% | | 56 | | | 56 | |
5.875% 2027 Senior Notes | | Cliffs | | 6.490% | | 556 | | | 556 | |
4.625% 2029 Senior Notes | | Cliffs | | 4.625% | | 368 | | | 368 | |
6.875% 2029 Senior Notes | | Cliffs | | 6.875% | | 900 | | | — | |
6.750% 2030 Senior Notes | | Cliffs | | 6.750% | | 750 | | | 750 | |
4.875% 2031 Senior Notes | | Cliffs | | 4.875% | | 325 | | | 325 | |
7.000% 2032 Senior Notes | | Cliffs | | 7.054% | | 1,425 | | | — | |
7.375% 2033 Senior Notes | | Cliffs | | 7.375% | | 900 | | | — | |
6.250% 2040 Senior Notes | | Cliffs | | 6.340% | | 235 | | | 235 | |
| ABL Facility | | Cliffs2 | | Variable3 | | 1,560 | | | — | |
| Total debt | | | | | | 7,148 | | | 3,192 | |
| Unamortized discounts and issuance costs | | | | | | (83) | | | (55) | |
| Total long-term debt | | | | | | $ | 7,065 | | | $ | 3,137 | |
| | | | | | | | |
|
1 Unless otherwise noted, references in this column and throughout this NOTE 8 - DEBT AND CREDIT FACILITIES to "Cliffs" are to Cleveland-Cliffs Inc., and references to "AK Steel" are to AK Steel Corporation (n/k/a Cleveland-Cliffs Steel Corporation). |
2 Refers to Cleveland-Cliffs Inc. as borrower under our ABL Facility. |
3 Our ABL Facility annual effective interest rate was 5.829% as of December 31, 2024. |
OUTSTANDING SENIOR UNSECURED NOTES
CLEVELAND-CLIFFS INC. 7.000% 2032 SENIOR NOTES - 2024 OFFERING
On March 18, 2024, we entered into an indenture among Cliffs, the guarantors party thereto and U.S. Bank Trust Company, National Association, as trustee, relating to the issuance of $825 million aggregate principal amount of our 7.000% 2032 Senior Notes, which were issued at par. The 7.000% 2032 Senior Notes were issued in a private placement transaction exempt from the registration requirements of the Securities Act.
On August 16, 2024, we issued an additional $600 million aggregate principal amount of our 7.000% 2032 Senior Notes in a private placement transaction exempt from the registration requirements of the Securities Act. These additional notes were issued at a price of 99.25% of their principal amount. Furthermore, the additional notes are treated as the same class and series as the initial notes issued on March 18, 2024, other than with respect to the date of issuance and issue price. The net proceeds from the transaction were used to finance a portion of the cash consideration paid in connection with the Stelco Acquisition, which we completed on November 1, 2024.
The 7.000% 2032 Senior Notes bear interest at a rate of 7.000% per annum, payable semi-annually in arrears on March 15 and September 15 of each year, commencing on September 15, 2024. The 7.000% 2032 Senior Notes mature on March 15, 2032.
The 7.000% 2032 Senior Notes are unsecured senior obligations and rank equally in right of payment with all of our existing and future unsecured and unsubordinated indebtedness. The 7.000% 2032 Senior Notes are guaranteed on a senior unsecured basis by our material direct and indirect wholly owned domestic subsidiaries. The 7.000% 2032 Senior Notes are structurally subordinated to all existing and future indebtedness and other liabilities of our subsidiaries that do not guarantee the 7.000% 2032 Senior Notes.
The 7.000% 2032 Senior Notes may be redeemed, in whole or in part, at any time at our option not less than 10 days nor more than 60 days after prior notice is sent to the holders of the 7.000% 2032 Senior Notes. The 7.000% 2032 Senior Notes are redeemable prior to March 15, 2027, at a redemption price equal to 100% of the principal amount thereof plus a "make-whole" premium set forth in the indenture. We may also redeem up to 35% of the aggregate principal amount of the 7.000% 2032 Senior Notes prior to March 15, 2027, at a redemption price equal to 107.000% of the principal amount thereof with the net cash proceeds of one or more equity offerings. The 7.000% 2032 Senior Notes are redeemable beginning on March 15, 2027, at a redemption price equal to 103.500% of the principal amount thereof, decreasing to 101.750% on March 15, 2028, and are redeemable at par
beginning on March 15, 2029. In each case, we pay the applicable redemption or "make-whole" premiums plus accrued and unpaid interest, if any, to, but not including, the date of redemption.
In addition, if a change in control triggering event, as defined in the indenture, occurs with respect to the 7.000% 2032 Senior Notes, we will be required to offer to repurchase the notes at a purchase price equal to 101% of their principal amount, plus accrued and unpaid interest, if any, to, but not including, the date of repurchase.
The terms of the 7.000% 2032 Senior Notes contain certain customary covenants; however, there are no financial covenants.
CLEVELAND-CLIFFS INC. 6.875% 2029 SENIOR NOTES - 2024 OFFERING
On October 22, 2024, we entered into an indenture among Cliffs, the guarantors party thereto and U.S. Bank Trust Company, National Association, as trustee, relating to the issuance of $900 million aggregate principal amount of our 6.875% 2029 Senior Notes, which were issued at par. The 6.875% 2029 Senior Notes were issued in a private placement transaction that was exempt from the registration requirements of the Securities Act. The net proceeds from the transaction were used to finance a portion of the cash consideration paid in connection with the Stelco Acquisition, which we completed on November 1, 2024.
The 6.875% 2029 Senior Notes bear interest at a rate of 6.875% per annum, payable semi-annually in arrears on May 1 and November 1 of each year, commencing on May 1, 2025. The 6.875% 2029 Senior Notes mature on November 1, 2029.
The 6.875% 2029 Senior Notes are unsecured senior obligations and rank equally in right of payment with all of our existing and future unsecured and unsubordinated indebtedness. The 6.875% 2029 Senior Notes are guaranteed on a senior unsecured basis by our material direct and indirect wholly owned domestic subsidiaries. The 6.875% 2029 Senior Notes are structurally subordinated to all existing and future indebtedness and other liabilities of our subsidiaries that do not guarantee the 6.875% 2029 Senior Notes.
The 6.875% 2029 Senior Notes may be redeemed, in whole or in part, at any time at our option not less than 10 days nor more than 60 days after prior notice is sent to the holders of the 6.875% 2029 Senior Notes. The 6.875% 2029 Senior Notes are redeemable prior to November 1, 2026, at a redemption price equal to 100% of the principal amount thereof plus a "make-whole" premium set forth in the indenture. We may also redeem up to 35% of the aggregate principal amount of the 6.875% 2029 Senior Notes prior to November 1, 2026, at a redemption price equal to 106.875% of the principal amount thereof with the net cash proceeds of one or more equity offerings. The 6.875% 2029 Senior Notes are redeemable beginning on November 1, 2026, at a redemption price equal to 103.438% of the principal amount thereof, decreasing to 100% on November 1, 2028. In each case, we pay the applicable redemption or "make-whole" premiums plus accrued and unpaid interest, if any, to, but not including, the date of redemption.
In addition, if a change in control triggering event, as defined in the indenture, occurs with respect to the 6.875% 2029 Senior Notes, we will be required to offer to repurchase the notes at a purchase price equal to 101% of their principal amount, plus accrued and unpaid interest, if any, to, but not including, the date of repurchase.
The terms of the 6.875% 2029 Senior Notes contain certain customary covenants; however, there are no financial covenants.
CLEVELAND-CLIFFS INC. 7.375% 2033 SENIOR NOTES - 2024 OFFERING
On October 22, 2024, we entered into an indenture among Cliffs, the guarantors party thereto and U.S. Bank Trust Company, National Association, as trustee, relating to the issuance of $900 million aggregate principal amount of our 7.375% 2033 Senior Notes, which were issued at par. The 7.375% 2033 Senior Notes were issued in a private placement transaction that was exempt from the registration requirements of the Securities Act. The net proceeds from the transaction were used to finance a portion of the cash consideration paid in connection with the Stelco Acquisition, which we completed on November 1, 2024.
The 7.375% 2033 Senior Notes bear interest at a rate of 7.375% per annum, payable semi-annually in arrears on May 1 and November 1 of each year, commencing on May 1, 2025. The 7.375% 2033 Senior Notes mature on May 1, 2033.
The 7.375% 2033 Senior Notes are unsecured senior obligations and rank equally in right of payment with all of our existing and future unsecured and unsubordinated indebtedness. The 7.375% 2033 Senior Notes are guaranteed on a senior unsecured basis by our material direct and indirect wholly owned domestic subsidiaries. The 7.375% 2033 Senior Notes are structurally subordinated to all existing and future indebtedness and other liabilities of our subsidiaries that do not guarantee the 7.375% 2033 Senior Notes.
The 7.375% 2033 Senior Notes may be redeemed, in whole or in part, at any time at our option not less than 10 days nor more than 60 days after prior notice is sent to the holders of the 7.375% 2033 Senior Notes. The 7.375% 2029 Senior Notes are redeemable prior to May 1, 2028, at a redemption price equal to 100% of the principal amount thereof plus a "make-whole" premium set forth in the indenture. We may also redeem up to 35% of the aggregate principal amount of the 7.375% 2033 Senior Notes prior to May 1, 2028, at a redemption price equal to 107.375% of the principal amount thereof with the net cash proceeds of one or more equity offerings. The 7.375% 2033 Senior Notes are redeemable beginning on May 1, 2028, at a redemption price equal to 103.688% of the principal amount thereof, decreasing to 100% on November 1, 2028. In each case, we pay the applicable redemption or "make-whole" premiums plus accrued and unpaid interest, if any, to, but not including, the date of redemption.
In addition, if a change in control triggering event, as defined in the indenture, occurs with respect to the 7.375% 2033 Senior Notes, we will be required to offer to repurchase the notes at a purchase price equal to 101% of their principal amount, plus accrued and unpaid interest, if any, to, but not including, the date of repurchase.
The terms of the 7.375% 2033 Senior Notes contain certain customary covenants; however, there are no financial covenants.
CLEVELAND-CLIFFS INC. OTHER OUTSTANDING UNSECURED SENIOR NOTES
The following represents a summary of our other unsecured senior notes' maturity and interest payable due dates:
| | | | | | | | | | | | | | |
| Debt Instrument | | Maturity | | Interest Payable
(until maturity) |
| 7.000% 2027 Senior Notes | | March 15, 2027 | | March 15 and September 15 |
| 5.875% 2027 Senior Notes | | June 1, 2027 | | June 1 and December 1 |
| 4.625% 2029 Senior Notes | | March 1, 2029 | | March 1 and September 1 |
| 6.750% 2030 Senior Notes | | April 15, 2030 | | April 15 and October 15 |
| 4.875% 2031 Senior Notes | | March 1, 2031 | | March 1 and September 1 |
| 6.250% 2040 Senior Notes | | October 1, 2040 | | April 1 and October 1 |
The senior notes are unsecured obligations and rank equally in right of payment with all our other existing and future unsecured and unsubordinated indebtedness. The 7.000% 2027 Senior Notes, 5.875% 2027 Senior Notes, 4.625% 2029 Senior Notes, 6.750% 2030 Senior Notes, and 4.875% 2031 Senior Notes are guaranteed on a senior unsecured basis by our material direct and indirect wholly owned domestic subsidiaries and, therefore, are structurally senior to any of our existing and future indebtedness that is not guaranteed by such guarantors and are structurally subordinated to all existing and future indebtedness and other liabilities of our subsidiaries that do not guarantee the notes. There are no subsidiary guarantees of the interest and principal amounts for the 6.250% 2040 Senior Notes.
The 7.000% 2027 Senior Notes may be redeemed, in whole or in part, at any time at our option upon not less than 30, and not more than 60, days' prior notice sent to the holders. The 7.000% 2027 Senior Notes are currently redeemable at a price equal to 101.167% of the principal amount thereof, and are redeemable at par beginning on March 15, 2025. In each case, we pay the redemption premiums plus accrued and unpaid interest, if any, to, but not including, the date of redemption.
The 5.875% 2027 Senior Notes may be redeemed, in whole or in part, at any time at our option upon not less than 30, and not more than 60, days' prior notice sent to the holders. The 5.875% 2027 Senior Notes are currently redeemable at a price equal to 100.979% of the principal amount thereof, and are redeemable at par beginning on June 1, 2025. In each case, we pay the redemption premiums plus accrued and unpaid interest, if any, to, but not including, the date of redemption.
The 4.625% 2029 Senior Notes may be redeemed, in whole or in part, on not less than 10, nor more than 60, days’ prior notice sent to the holders of the notes. The 4.625% 2029 Senior Notes are currently redeemable at a price equal to 102.313% of the principal amount thereof, decreasing to 101.156% on March 1, 2025, and are redeemable at par beginning on March 1, 2026. In each case, we pay the redemption premiums plus accrued and unpaid interest, if any, to, but not including, the date of redemption.
The 6.750% 2030 Senior Notes may be redeemed, in whole or in part, at any time at our option not less than 10 days nor more than 60 days after prior notice is sent to the holders of the 6.750% 2030 Senior Notes. The 6.750% 2030 Senior Notes are redeemable prior to April 15, 2026, at a redemption price equal to 100% of the principal amount thereof plus a "make-whole" premium set forth in the indenture. We may also redeem up to 35% of the aggregate principal amount of the 6.750% 2030 Senior Notes prior to April 15, 2026 at a redemption price equal to 106.750% of the principal amount thereof with the net cash proceeds of one or more equity offerings. The 6.750% 2030 Senior Notes are redeemable beginning on April 15, 2026, at a redemption price equal to 103.375% of the principal amount thereof, decreasing to 101.688% on April 15, 2027, and are redeemable at par beginning on April 15, 2028. In each case, we pay the applicable redemption and "make-whole" premiums plus accrued and unpaid interest, if any, to, but not including, the date of redemption.
The 4.875% 2031 Senior Notes may be redeemed, in whole or in part, on not less than 10, nor more than 60, days’ prior notice sent to the holders of the notes. The 4.875% 2031 Senior Notes are redeemable prior to March 1, 2026, at a redemption price equal to 100% of the principal amount thereof plus a "make-whole" premium set forth in the indenture. We may also redeem up to 35% of the aggregate principal amount of the 4.875% 2031 Senior Notes prior to March 1, 2026 at a redemption price equal to 104.875% of the principal amount thereof with the net cash proceeds of one or more equity offerings. The 4.875% 2031 Senior Notes are redeemable beginning on March 1, 2026, at a redemption price equal to 102.438% of the principal amount thereof, decreasing to 101.625% on March 1, 2027, and 100.813% on March 1, 2028, and are redeemable at par beginning on March 1, 2029. In each case, we pay the redemption and "make-whole" premiums plus accrued and unpaid interest, if any, to, but not including, the date of redemption.
The 6.250% 2040 Senior Notes may be redeemed any time at our option upon not less than 30, nor more than 60, days' prior notice is sent to the holders. The 6.250% 2040 Senior Notes are redeemable at a redemption price equal to the greater of (1) 100% of the principal amount of the notes to be redeemed or (2) the sum of the present values of the remaining scheduled payments of principal and interest on the notes to be redeemed, discounted to the redemption date on a semi-annual basis at the treasury rate plus 40 basis points, plus accrued and unpaid interest, if any, to, but not including, the date of redemption.
In addition, if a change of control triggering event, as defined in the applicable indenture, occurs with respect to the unsecured notes, we will be required to offer to purchase the notes of the applicable series at a purchase price equal to 101% of the principal amount, plus accrued and unpaid interest, if any, to, but not including, the date of purchase.
The terms of the unsecured notes contain certain customary covenants; however, there are no financial covenants.
AK STEEL CORPORATION UNSECURED SENIOR NOTES
As of December 31, 2024, AK Steel had outstanding a total of $56 million aggregate principal amount of 7.000% 2027 AK Senior Notes. These senior notes are unsecured obligations and rank equally in right of payment with AK Steel's guarantees of Cliffs' unsecured and unsubordinated indebtedness. These notes contain no financial covenants.
The 7.000% 2027 AK Senior Notes may be redeemed, in whole or in part, at any time at our option upon not less than 30, and not more than 60, days' prior notice sent to the holders. The 7.000% 2027 AK Senior Notes are currently redeemable at a price equal to 101.167%, and are redeemable at par beginning on March 15, 2025. In each case, we pay the redemption premiums plus accrued and unpaid interest, if any, to, but not including, the date of redemption.
ABL FACILITY
On July 31, 2024 and September 13, 2024, in connection with the Stelco Acquisition, we entered into the fifth and sixth amendments to our ABL Facility, respectively. The amendments, among other things, (i) amend the normal conditions for borrowing loans to allow for the Stelco Acquisition and permit additional borrowings for the purpose of financing a portion of the Stelco Acquisition purchase price, and (ii) subsequent to the Stelco Acquisition and the satisfaction of customary conditions, divide the existing $4.75 billion of aggregate lending commitments under our ABL Facility into two tranches, (x) a $4.25 billion tranche of lending commitments available to be borrowed by the Company and certain U.S. subsidiaries of the Company that are designated as borrowers from time to time in accordance with the ABL Facility and (y) a $500 million tranche of lending commitments available to be borrowed by certain Canadian subsidiaries of the Company that are designated as borrowers from time to time in accordance with the ABL Facility. The maturity date of the ABL Facility remains the earlier of June 9, 2028, or 91 days prior to the maturity of certain other material debt.
The ABL Facility and certain bank products and hedge obligations are guaranteed by certain of our existing wholly owned U.S. subsidiaries and are required to be guaranteed by certain of our future U.S. subsidiaries. Amounts outstanding under the ABL Facility are secured by (i) a first-priority security interest in the accounts receivable and other rights to payment, inventory, as-extracted collateral, certain investment property, deposit accounts, securities accounts, certain general intangibles and commercial tort claims, certain mobile equipment, commodities accounts and other related assets of ours, the other borrowers and the guarantors, and proceeds and products of each of the foregoing (collectively, the “ABL Collateral”) and (ii) a second-priority security interest in substantially all of our assets and the assets of the other borrowers and the guarantors other than the ABL Collateral.
The ABL Facility contains customary representations and warranties and affirmative and negative covenants including, among others, covenants regarding the maintenance of certain financial ratios if certain conditions are triggered, covenants relating to financial reporting, covenants relating to the payment of dividends on, or purchase or redemption of, our capital stock, covenants relating to the incurrence or prepayment of certain debt, covenants relating to the incurrence of liens or encumbrances, covenants relating to compliance with laws, covenants relating to transactions with affiliates, covenants relating to mergers and sales of all or substantially all of our assets and limitations on changes in the nature of our business. As of December 31, 2024 and 2023, we were in compliance with the ABL Facility liquidity requirements and, therefore, the springing financial covenant requiring a minimum fixed charge coverage ratio of 1.0 to 1.0 was not applicable.
The ABL Facility provides for customary events of default, including, among other things, the event of nonpayment of principal, interest, fees or other amounts, a representation or warranty proving to have been materially incorrect when made, failure to perform or observe certain covenants within a specified period of time, a cross-default to certain material indebtedness, the bankruptcy or insolvency of the Company and certain of its subsidiaries, monetary judgment defaults of a specified amount, invalidity of any loan documentation, a change of control of the Company, and ERISA defaults resulting in liability of a specified amount. If an event of default exists (beyond any applicable grace or cure period), the administrative agent may, and at the direction of the requisite number of lenders shall, declare all amounts owing under the ABL Facility immediately due and payable, terminate such lenders’ commitments to make loans under the ABL Facility and/or exercise any and all remedies and other rights under the ABL Facility. For certain events of default related to insolvency and receivership, the commitments of the lenders will be automatically terminated and all outstanding loans and other amounts will become immediately due and payable.
The following represents a summary of our borrowing capacity under the ABL Facility:
| | | | | |
| December 31, |
| (In millions) | 2024 |
Available borrowing base on ABL Facility1 | $ | 4,158 | |
| Borrowings | (1,560) | |
Letter of credit obligations2 | (62) | |
| Borrowing capacity available | $ | 2,536 | |
| |
1 As of December 31, 2024, the ABL Facility has a maximum borrowing base of $4.75 billion. The available borrowing base is determined by applying customary advance rates to eligible accounts receivable, inventory and certain mobile equipment. |
2 We issued standby letters of credit with certain financial institutions in order to support business obligations, including, but not limited to, operating agreements, employee severance, environmental obligations, workers' compensation, and insurance obligations. |
DEBT EXTINGUISHMENTS
On March 18, 2024, we used a portion of the net proceeds from the initial 7.000% 2032 Senior Notes issuance to repurchase $640 million in aggregate principal amount of our 6.750% 2026 Senior Secured Notes pursuant to a tender offer. On April 3, 2024, we redeemed the remaining $189 million in aggregate principal amount of our then-outstanding 6.750% 2026 Senior Secured Notes with the remaining portion of the net proceeds from the initial 7.000% 2032 Senior Notes issuance and available liquidity.
DEBT MATURITIES
The following represents a summary of our debt instrument maturities based on the principal amounts outstanding at December 31, 2024 (in millions):
| | | | | | | | | | | | | | | | | | | | | | | | | | | | | | | | | | | | | | |
| 2025 | | 2026 | | 2027 | | 2028 | | 2029 | | Thereafter | | Total |
| $ | — | | | $ | — | | | $ | 685 | | | $ | 1,560 | | | $ | 1,268 | | | $ | 3,635 | | | $ | 7,148 | |
NOTE 9 - PENSIONS AND OTHER POSTRETIREMENT BENEFITS
We offer benefits through defined benefit pension plans, defined contribution pension plans and OPEB plans to a significant portion of our employees and retirees. Benefits are also provided through multiemployer plans for certain union members.
DEFINED BENEFIT PENSION PLANS
The defined benefit pension plans are largely noncontributory and limited in participation. Most plans are closed to new participants with only the legacy iron ore hourly and salaried plans still open. The pension benefit calculations vary by plan but are generally based on employees' years of service and compensation or a fixed rate and years of service. Certain salaried plans calculate benefits using a cash balance formula, which earns interest credits and allocations based on a percent of pay.
As a result of the Stelco Acquisition, we assumed the obligations under Stelco's defined benefit pension plans. These Canadian defined benefit pension plans acquired amounted to a benefit obligation, net of assets, of $14 million based on a November 1, 2024 measurement.
OPEB PLANS
We offer postretirement health care and life insurance benefits to retirees through various funded and unfunded plans. The vast majority of our plans are closed to new participants. In lieu of retiree medical coverage, many union-represented employees receive a 401(k) contribution per hour worked to a restricted Retiree Health Care Account. Cost sharing features between the employer and retiree vary by plan and several plans include employer caps. Retiree healthcare coverage is provided through programs administered by insurance companies whose charges are based on benefits paid. Certain labor agreements require the funding of VEBAs, which, depending on funding levels, may be used to reimburse the employer for paid benefits.
OBLIGATIONS AND FUNDED STATUS
The following tables and information provide additional disclosures:
| | | | | | | | | | | | | | | | | | | | | | | |
| (In millions) | Pension Benefits | | OPEB |
| Change in benefit obligations: | 2024 | | 2023 | | 2024 | | 2023 |
| Benefit obligations — beginning of year | $ | 4,571 | | | $ | 4,646 | | | $ | 1,036 | | | $ | 1,233 | |
| Service cost | 28 | | | 31 | | | 8 | | | 10 | |
| Interest cost | 218 | | | 235 | | | 50 | | | 64 | |
| Plan amendments | — | | | 3 | | | 7 | | | 8 | |
| Actuarial loss (gain) | (165) | | | 116 | | | 162 | | | (158) | |
| Benefits paid | (429) | | | (436) | | | (155) | | | (163) | |
| Participant contributions | — | | | — | | | 36 | | | 42 | |
| Acquired through business combinations | 35 | | | — | | | — | | | — | |
| Foreign currency exchange | (1) | | | — | | | — | | | — | |
| Effect of settlement | (9) | | | (24) | | | — | | | — | |
| Other | — | | | — | | | 3 | | | — | |
| Benefit obligations — end of year | $ | 4,248 | | | $ | 4,571 | | | $ | 1,147 | | | $ | 1,036 | |
| | | | | | | |
| Change in plan assets: | | | | | | | |
| Fair value of plan assets — beginning of year | $ | 4,282 | | | $ | 4,338 | | | $ | 739 | | | $ | 728 | |
| Actual return on plan assets | 254 | | | 375 | | | 46 | | | 67 | |
| Participant contributions | — | | | — | | | 36 | | | 42 | |
| Employer contributions | 119 | | | 29 | | | 76 | | | 65 | |
| Benefits paid | (429) | | | (436) | | | (155) | | | (163) | |
| Acquired through business combinations | 21 | | | — | | | — | | | — | |
| Foreign currency exchange | (1) | | | — | | | — | | | — | |
| Effect of settlement | (9) | | | (24) | | | — | | | — | |
| | | | | | | |
| Fair value of plan assets — end of year | $ | 4,237 | | | $ | 4,282 | | | $ | 742 | | | $ | 739 | |
| Funded status | $ | (11) | | | $ | (289) | | | $ | (405) | | | $ | (297) | |
| | | | | | | |
| Amounts recognized in Statements of Financial Position: | | | | | | | |
| Non-current assets | $ | 239 | | | $ | 137 | | | $ | 188 | | | $ | 192 | |
Current liabilities1 | (7) | | | (18) | | | (85) | | | (76) | |
| Non-current liabilities | (243) | | | (408) | | | (508) | | | (413) | |
| Total amount recognized | $ | (11) | | | $ | (289) | | | $ | (405) | | | $ | (297) | |
| | | | | | | |
| Amounts recognized in accumulated other comprehensive loss (income): | | | | | | | |
| Net actuarial gain | $ | (400) | | | $ | (304) | | | $ | (1,720) | | | $ | (2,033) | |
| Prior service cost (credit) | 89 | | | 106 | | | (109) | | | (131) | |
| Net amount recognized | $ | (311) | | | $ | (198) | | | $ | (1,829) | | | $ | (2,164) | |
| | | | | | | |
1 Current liabilities are classified within Other current liabilities on the Statements of Consolidated Financial Position. |
The accumulated benefit obligation for all defined benefit pension plans was $4,236 million and $4,557 million at December 31, 2024 and 2023, respectively.
COMPONENTS OF NET PERIODIC BENEFIT COST (CREDIT)
| | | | | | | | | | | | | | | | | | | | | | | | | | | | | | | | | | | |
| Pension Benefits | | OPEB |
| (In millions) | 2024 | | 2023 | | 2022 | | 2024 | | 2023 | | 2022 |
| Service cost | $ | 28 | | | $ | 31 | | | $ | 45 | | | $ | 8 | | | $ | 10 | | | $ | 35 | |
| Interest cost | 218 | | | 235 | | | 144 | | | 50 | | | 64 | | | 72 | |
| Expected return on plan assets | (320) | | | (315) | | | (355) | | | (43) | | | (43) | | | (37) | |
| Amortization: | | | | | | | | | | | |
| Net actuarial loss (gain) | (1) | | | 3 | | | 13 | | | (154) | | | (145) | | | (43) | |
| Prior service costs (credits) | 18 | | | 18 | | | 5 | | | (15) | | | (17) | | | (3) | |
| Settlements and special termination benefits | (2) | | | (4) | | | (8) | | | 2 | | | — | | | — | |
| Net periodic benefit cost (credit) | $ | (59) | | | $ | (32) | | | $ | (156) | | | $ | (152) | | | $ | (131) | | | $ | 24 | |
For 2025, we estimate net periodic benefit cost (credit) as follows:
| | | | | |
| (In millions) | |
| Defined benefit pension plans | $ | (70) | |
| OPEB plans | (124) | |
| Total | $ | (194) | |
COMPONENTS OF OTHER COMPREHENSIVE LOSS (INCOME)
The following includes details on the significant actuarial losses (gains) impacting the benefit obligation and other components of other comprehensive loss (income):
| | | | | | | | | | | | | | | | | | | | | | | |
| Pension Benefits | | OPEB |
| (In millions) | 2024 | | 2023 | | 2024 | | 2023 |
| Discount rates | $ | (146) | | | $ | 124 | | | $ | (43) | | | $ | 28 | |
Demographic updates1 | (14) | | | (5) | | | 26 | | | (208) | |
| Mortality | — | | | (2) | | | — | | | (11) | |
Per capita healthcare costs and healthcare trend2 | — | | | — | | | 179 | | | 33 | |
| Other | (5) | | | (1) | | | — | | | — | |
| Actuarial loss (gain) on benefit obligation | (165) | | | 116 | | | 162 | | | (158) | |
| Actual returns on assets under (over) expected | 67 | | | (60) | | | (3) | | | (24) | |
| Amortization of net actuarial gain (loss) | 1 | | | (3) | | | 154 | | | 145 | |
| Amortization of prior service credits (costs) | (18) | | | (18) | | | 15 | | | 17 | |
| Settlements | 2 | | | 4 | | | — | | | — | |
| Plan amendments | — | | | 3 | | | 7 | | | 8 | |
| Total recognized in other comprehensive loss (income) | $ | (113) | | | $ | 42 | | | $ | 335 | | | $ | (12) | |
| | | | | | | |
1 In 2023, the OPEB plans generated an actuarial gain relating to updates for demographic experience. We had adjustments relating to retirements, participation, persistency and census data updates. |
2 The loss in per capita healthcare costs in 2024 relating to our OPEB plans is primarily due to unfavorable Medicare Advantage Prescription Drug healthcare rates, which are effective January 1, 2025. Additionally, we increased our short-term Medicare Advantage Prescription Drug trend rate assumption. |
CONTRIBUTIONS
We make both required and discretionary pension contributions. Required contributions are based on minimum funding requirements pursuant to ERISA regulations. Funded OPEB plans are not subject to minimum regulatory funding requirements, but rather amounts are contributed pursuant to bargaining agreements. Contributions toward unfunded OPEB plans are payments made directly from corporate assets and are displayed net of participant contributions and other reimbursements. Company contributions and payments we expect to make in 2025, and made in 2024 and 2023 are as follows:
| | | | | | | | | | | | | | | | | | | | | | | | | | |
| | Pension Benefits | | OPEB |
| (In millions) | | VEBA1 | | Direct Payments | | Total |
| 2023 | | $ | 29 | | | $ | — | | | $ | 65 | | | $ | 65 | |
| 2024 | | 119 | | | — | | | 76 | | | 76 | |
| 2025 (Expected) | | 69 | | | — | | | 74 | | | 74 | |
| | | | | | | | |
1 Pursuant to the applicable bargaining agreements, benefits can be paid from certain VEBAs that are at least 70% funded (all VEBAs were over 70% funded at December 31, 2024). Certain agreements with plans holding VEBA assets have capped healthcare costs. For the Cleveland-Cliffs Steel LLC VEBA, we are required to make contributions based on earnings, and we may withdraw money from the VEBA plan to the extent funds are available for costs in excess of the cap. VEBA withdrawals are represented net of direct payments. There will be no further contributions to the Cleveland-Cliffs Steel LLC VEBA based on earnings for the remainder of the labor agreement with the USW, which expires in September 2026. |
ESTIMATED FUTURE BENEFIT PAYMENTS
| | | | | | | | | | | |
| (In millions) | Pension Benefits | | OPEB1 |
| 2025 | $ | 472 | | | $ | 116 | |
| 2026 | 440 | | | 114 | |
| 2027 | 419 | | | 109 | |
| 2028 | 405 | | | 105 | |
| 2029 | 382 | | | 100 | |
| 2030-2034 | 1,663 | | | 445 | |
| | | |
1 OPEB benefit payments are displayed net of participant contributions. |
ASSUMPTIONS
The discount rates used to measure plan liabilities as of the December 31 measurement date are determined individually for each plan. The discount rates are determined by matching the projected cash flows used to determine the plan liabilities to a projected yield curve of high-quality corporate bonds available at the measurement date. Discount rates for expense are calculated using the granular approach for each plan.
We use company-specific base mortality tables for healthy annuitants in qualified pension plans. We use tables issued by the Society of Actuaries for non-annuitants in qualified pension plans, all nonqualified pension participants and OPEB participants. For tables issued by the Society of Actuaries, we use Pri-2012 mortality tables with adjustments for blue collar, white collar or no collar depending on the plan. Mortality is projected for all plans using Scale MP-2021 with generational projection for both years. In 2024, no changes have been made to the plans' mortality tables. In 2023, we switched two OPEB plans from company-specific base mortality tables to the Pri-2012 mortality tables to align with our other OPEB plans.
The following represents weighted-average assumptions used to determine benefit obligations:
| | | | | | | | | | | | | | | | | | | | | | | | | | | | | | | | | | | |
| Pension Benefits | | OPEB |
| December 31, | | December 31, |
| 2024 | | 2023 | | 2024 | | 2023 |
| Discount rate | 5.55 | % | | 5.12 | % | | 5.59 | % | | 5.15 | % |
| Interest crediting rate | 5.58 | | | 5.46 | | | N/A | | | N/A | |
| Compensation rate increase | 3.00 | | | 3.00 | | | 3.00 | | | 3.00 | |
The following represents weighted-average assumptions used to determine net benefit cost:
| | | | | | | | | | | | | | | | | | | | | | | | | | | | | | | | | | | | | | | | | | | | | | | | | | | | | |
| Pension Benefits | | OPEB |
| December 31, | | December 31, |
| 2024 | | 2023 | | 2022 | | 2024 | | 2023 | | 2022 |
| Obligation discount rate | 5.08 | | % | | 5.47 | | % | | 3.21 | | % | | 5.15 | | % | | 5.52 | | % | | 3.33 | | % |
| Service cost discount rate | 5.29 | | | | 5.61 | | | | 3.49 | | | | 5.28 | | | | 5.65 | | | | 3.91 | | |
| Interest cost discount rate | 5.05 | | | | 5.34 | | | | 2.75 | | | | 5.08 | | | | 5.38 | | | | 3.01 | | |
| | | | | | | | | | | | | | | | | |
| Interest crediting rate | 5.46 | | | | 5.46 | | | | 5.39 | | | | N/A | | | N/A | | | N/A | |
| Expected return on plan assets | 7.85 | | | | 7.66 | | | | 6.87 | | | | 5.95 | | | | 5.87 | | | | 4.86 | | |
| Compensation rate increase | 3.00 | | | | 3.00 | | | | 2.74 | | | | 3.00 | | | | 3.00 | | | | 3.00 | | |
The following represents assumed weighted-average health care cost trend rates:
| | | | | | | | | | | | | | | | | |
| December 31, |
| 2024 | | 2023 |
Health care cost trend rate assumed for next year1 | 11.43 | | % | | 5.49 | | % |
| Ultimate health care cost trend rate | 4.50 | | % | | 4.50 | | % |
| Year that the ultimate rate is reached | 2032 | | | 2032 | |
| | | | | |
1 The health care trend rate is weighted for all of our OPEB plans and factors in our Medicare Advantage Prescription Drug pricing arrangements. In 2024, we maintained our assumed health care cost trend rate for self insured plans at 6.25%, which grades down on a linear basis to 4.50% by 2032. In 2024, the health care trend rate for the Medicare Advantage Prescription Drug plans assumes a 16.25% rate, which is primarily driven by our expectation that the impacts from the Inflation Reduction Act will negatively impact Medicare Advantage Prescription Drug plan costs for the next year. We assume the healthcare trend rate for the Medicare Advantage Prescription Drug plans will realign with the self insured plans after the one time increase. |
PLAN ASSETS
Our investment objectives with respect to our pension and OPEB assets are to maximize investment returns within reasonable and prudent levels of risk and maintain sufficient liquidity to meet benefit obligations over the life of each plan. The asset allocations are tailored to each individual plan and are determined by analyzing each plan's duration of benefit obligations, funded status and risk profile. Our investment strategy utilizes a broad mix of equity, fixed income and alternative investments to generate returns and manage risk. Equity investments are diversified across large-cap, mid-cap and small-cap companies located in the U.S. and worldwide, with a bias towards U.S. companies. Fixed income investments primarily include corporate bonds and government debt securities, which are generally customized based on a plan's obligation duration. Certain plans have strategies that invest in fixed income funds that hold hedging investment products which are designed to protect the fund's funded status. To enhance our diversification, we also invest in hedge funds, private equity, structured credit and real estate. We review investment performance, asset allocations and policy compliance on a quarterly basis.
The expected return on plan assets is calculated on a plan-by-plan basis and take into account each plan's strategic asset allocation. The calculation of rates by asset class are based primarily on our future expected returns and take into consideration the duration of the cash flows, active management and fees.
Assets for OPEB plans include VEBA trusts pursuant to bargaining agreements that are available to fund retired employees’ life insurance obligations and medical benefits. The following table reflects the actual asset allocations for pension and VEBA assets as of December 31, 2024 and 2023, as well as the 2025 weighted average target asset allocations:
| | | | | | | | | | | | | | | | | | | | | | | | | | | | | | | | | | | | | | |
| | Pension Assets | | VEBA Assets |
| Asset Category | | 2025
Target
Allocation | | Actual Asset Allocation at December 31, | | 2025
Target
Allocation | | Actual Asset Allocation at December 31, |
| 2024 | | 2023 | | 2024 | | 2023 |
| Equity securities | | 34.0 | % | | 32.7 | % | | 32.1 | % | | 17.2 | % | | 17.6 | % | | 18.4 | % |
| Fixed income | | 40.8 | | | 38.9 | | | 38.8 | | | 78.4 | | | 76.6 | | | 74.5 | |
| Hedge funds | | 9.4 | | | 9.6 | | | 9.4 | | | 1.0 | | | 1.2 | | | 1.5 | |
| Private equity | | 3.4 | | | 3.6 | | | 3.4 | | | — | | | — | | | — | |
| Structured credit | | 2.5 | | | 4.0 | | | 5.1 | | | 0.3 | | | 0.5 | | | 0.9 | |
| Real estate | | 9.9 | | | 11.2 | | | 11.2 | | | 3.1 | | | 4.1 | | | 4.7 | |
| Total | | 100.0 | % | | 100.0 | % | | 100.0 | % | | 100.0 | % | | 100.0 | % | | 100.0 | % |
FAIR VALUE MEASUREMENTS
Investments classified as Level 1 primarily include equity investments and fixed income mutual funds that are based on observable quoted market prices on an active exchange. Fixed income investments classified as Level 2 include U.S. Treasury STRIPS which are priced daily through a bond pricing vendor as well as corporate bonds, mortgage-backed securities and non-U.S. bonds which have valuations based on their bid-ask spreads or quoted prices of securities with similar characteristics.
Certain investments in hedge funds, private equity, structured credit and real estate are classified as Level 3 due to the absence of quoted market prices and inherent lack of liquidity. These investments are generally valued at estimated fair value based on financial inputs from our investment advisors, investment managers or third party appraisers. Certain Level 3 investments may be lagged up to three months if there are no financial inputs available.
Investment commitments are made in private equity funds and capital calls are made over the life of the funds to fund the commitments. As of December 31, 2024, remaining commitments for our private equity investments total $47 million for our pension and OPEB plans. Committed amounts are funded from plan assets when capital calls are made.
As a practical expedient, in accordance with ASC 820-10, certain investments that are measured at fair value using the NAV per share have not been classified in the fair value hierarchy below. NAV is based on the value of the underlying assets owned by the fund, minus its liabilities, and then divided by its number of shares outstanding.
The fair value of our pension assets by asset category is as follows:
| | | | | | | | | | | | | | | | | | | | | | | | | | | | | | | | | | | | | | | | | | | | |
| (In millions) | Quoted Prices in Active Markets for Identical Assets (Level 1) | | Significant Other Observable Inputs
(Level 2) | | Significant
Unobservable
Inputs
(Level 3) | | Investments Measured at Net Asset Value | | Total |
| Asset Category | 2024 | 2023 | | 2024 | 2023 | | 2024 | 2023 | | 2024 | 2023 | | 2024 | 2023 |
| Equity securities: | | | | | | | | | | | | | | |
| U.S. equities | $ | 816 | | $ | 809 | | | $ | — | | $ | — | | | $ | — | | $ | — | | | $ | — | | $ | — | | | $ | 816 | | $ | 809 | |
| Global equities | 501 | | 502 | | | — | | — | | | — | | — | | | 69 | | 65 | | | 570 | | 567 | |
| Fixed income: | | | | | | | | | | | | | | |
U.S. government securities1 | 32 | | 22 | | | 577 | | 657 | | | — | | — | | | 146 | | 142 | | | 755 | | 821 | |
| U.S. corporate bonds | 583 | | 587 | | | — | | — | | | — | | — | | | 115 | | 94 | | | 698 | | 681 | |
| Non U.S. and other bonds | 9 | | — | | | — | | — | | | — | | — | | | 185 | | 160 | | | 194 | | 160 | |
| Hedge funds | — | | — | | | — | | — | | | 128 | | 118 | | | 280 | | 285 | | | 408 | | 403 | |
| Private equity | — | | — | | | — | | — | | | 151 | | 146 | | | — | | — | | | 151 | | 146 | |
| Structured credit | — | | — | | | — | | — | | | 171 | | 220 | | | — | | — | | | 171 | | 220 | |
| Real estate | — | | — | | | — | | — | | | 242 | | 286 | | | 232 | | 189 | | | 474 | | 475 | |
| Total | $ | 1,941 | | $ | 1,920 | | | $ | 577 | | $ | 657 | | | $ | 692 | | $ | 770 | | | $ | 1,027 | | $ | 935 | | | $ | 4,237 | | $ | 4,282 | |
| | | | | | | | | | | | | | |
1 Includes cash equivalents. |
The fair value of our VEBA assets by asset category is as follows:
| | | | | | | | | | | | | | | | | | | | | | | | | | | | | | | | | | | | | | | | | | | | |
| (In millions) | Quoted Prices in Active Markets for Identical Assets
(Level 1) | | Significant Other Observable Inputs
(Level 2) | | Significant
Unobservable
Inputs
(Level 3) | | Investments Measured at Net Asset Value | | Total |
| Asset Category | 2024 | 2023 | | 2024 | 2023 | | 2024 | 2023 | | 2024 | 2023 | | 2024 | 2023 |
| Equity securities: | | | | | | | | | | | | | | |
| U.S. equities | $ | 99 | | $ | 102 | | | $ | — | | $ | — | | | $ | — | | $ | — | | | $ | — | | $ | — | | | $ | 99 | | $ | 102 | |
| Global equities | 3 | | 3 | | | — | | — | | | — | | — | | | 28 | | 30 | | | 31 | | 33 | |
| Fixed income: | | | | | | | | | | | | | | |
U.S. government securities1 | 130 | | 119 | | | 50 | | 27 | | | — | | — | | | 44 | | 47 | | | 224 | | 193 | |
| U.S. corporate bonds | 216 | | 214 | | | 74 | | 94 | | | — | | — | | | 52 | | 49 | | | 342 | | 357 | |
| Non U.S. and other bonds | 2 | | 3 | | | — | | — | | | — | | — | | | — | | — | | | 2 | | 3 | |
| Hedge funds | — | | — | | | — | | — | | | 10 | | 10 | | | — | | — | | | 10 | | 10 | |
| Structured credit | — | | — | | | — | | — | | | 4 | | 7 | | | — | | — | | | 4 | | 7 | |
| Real estate | — | | — | | | — | | — | | | 5 | | 10 | | | 25 | | 24 | | | 30 | | 34 | |
| Total | $ | 450 | | $ | 441 | | | $ | 124 | | $ | 121 | | | $ | 19 | | $ | 27 | | | $ | 149 | | $ | 150 | | | $ | 742 | | $ | 739 | |
| | | | | | | | | | | | | | |
1 Includes cash equivalents. |
The following represents the fair value measurements of changes in plan assets using significant unobservable inputs (Level 3):
| | | | | | | | | | | | | | | | | | | | | | | |
| Pension Assets | | VEBA Assets |
| (In millions) | 2024 | | 2023 | | 2024 | | 2023 |
| Beginning balance — January 1 | $ | 770 | | | $ | 912 | | | $ | 27 | | | $ | 35 | |
| Actual return on plan assets: | | | | | | | |
| Relating to assets still held at the reporting date | 18 | | | (16) | | | 1 | | | 2 | |
| Relating to assets sold during the period | 7 | | | 10 | | | — | | | 1 | |
| Purchases | 31 | | | 24 | | | — | | | — | |
| Sales | (134) | | | (160) | | | (9) | | | (11) | |
| | | | | | | |
| Ending balance — December 31 | $ | 692 | | | $ | 770 | | | $ | 19 | | | $ | 27 | |
DEFINED CONTRIBUTION PLANS
Most employees are eligible to participate in various defined contribution plans. Certain of these plans have features with matching contributions or other Company contributions based on our financial results. Company contributions to these plans are expensed as incurred. Total expense from these plans was $63 million, $59 million and $52 million in 2024, 2023 and 2022, respectively.
MULTlEMPLOYER PLANS
We contribute to multiemployer pension plans according to collective bargaining agreements that cover certain union-represented employees. The risks of participating in these multiemployer plans are different from the risks of participating in single-employer pension plans in the following respects:
•Assets contributed to a multiemployer plan by one employer may be used to provide benefits to employees of other participating employers.
•If a participating employer stops contributing to a multiemployer plan, the unfunded obligations of the plan may be borne by the remaining participating employers.
•If the multiemployer plan becomes significantly underfunded or is unable to pay its benefits, we may be required to contribute additional amounts in excess of the rate required by the collective bargaining agreements.
•If we choose to stop participating in a multiemployer plan, we may be required to pay that plan an amount based on the underfunded status of the plan, referred to as a withdrawal liability.
Information with respect to multiemployer plans in which we participate follows:
| | | | | | | | | | | | | | | | | | | | | | | | | | | | | |
| Pension Fund | EIN/Pension Plan Number | Pension Protection Act Zone Status1 | FIP/RP Status Pending/Implemented2 | Contributions
(in millions) | Surcharge Imposed3 | Expiration Date of Collective Bargaining Agreement4 |
| | 2024 | 2023 | | 2024 | 2023 | 2022 | | |
| Steelworkers Pension Trust | 23-6648508/499 | Green | Green | No | $ | 117 | | $ | 119 | | $ | 93 | | No | 4/1/2025 to 9/1/2026 |
| IAM National Pension Fund’s National Pension Plan | 51-6031295/002 | Red | Red | Yes | 22 | | 23 | | 22 | | Yes | 5/31/2025 to 5/15/2027 |
Other Plans5 | | | | | 1 | | 1 | | — | | | |
| Total | | | | | $ | 140 | | $ | 143 | | $ | 115 | | | |
| | | | | | | | | |
1 The most recent Pension Protection Act zone status available in 2024 and 2023 is for each plan's year-end at December 31, 2023 and 2022. The plan's actuary certifies the zone status. Generally, plans in the red zone are less than 65% funded, plans in the yellow zone are between 65% and 80% funded, and plans in the green zone are at least 80% funded. The IAM National Pension Fund's National Pension Plan voluntarily elected to place itself in the "Red Zone" in April 2019 and has implemented a rehabilitation plan to address its underfunded status. Additional contributions will be required as part of the rehabilitation plan until the plan exits the "Red Zone". |
2 The "FIP/RP Status Pending/Implemented" column indicates plans for which a financial improvement plan or a rehabilitation plan is either pending or has been implemented, as defined by ERISA. |
3 The surcharge represents an additional required contribution due as a result of the critical funding status of the plan. |
4 We are party to six collective bargaining agreements that require contributions to the Steelworkers Pension Trust and three collective bargaining agreements that require contributions to the IAM National Pension Fund's National Pension Plan. |
5 Plans that are not individually significant to our Company are presented in aggregate. |
We are one of the largest contributors to the Steelworkers Pension Trust. Our contributions exceeded 5% of total combined contributions in 2024 and 2023. As of January 1, 2024 (the last date for which we have information), the Steelworkers Pension Trust had a total actuarial liability of $6,562 million and assets with a market value of $6,494 million, for a funded ratio of about 99%.
NOTE 10 - STOCK COMPENSATION PLANS
At December 31, 2024, we had outstanding awards under two share-based compensation plans: the 2021 Equity Plan and the A&R 2015 Equity Plan. As of December 31, 2024, there were 20.9 million remaining shares available for grant under the 2021 Equity Plan. No additional grants were issued from the A&R 2015 Equity Plan after the date of approval of the 2021 Equity Plan; however, all awards previously granted under predecessor plans will continue in accordance with the terms of the outstanding awards.
Upon vesting of share-based compensation awards, we issue shares from treasury shares before issuing new shares. Forfeitures are recognized when they occur.
STOCK-BASED COMPENSATION EXPENSE
The following table summarizes the total compensation expense recognized for stock-based compensation awards:
| | | | | | | | | | | | | | | | | |
| Year Ended December 31, |
| (In millions, except per share amounts) | 2024 | | 2023 | | 2022 |
| Cost of goods sold | $ | (11) | | | $ | (9) | | | $ | (5) | |
| Selling, general and administrative expenses | (39) | | | (32) | | | (23) | |
| Stock based compensation expense | (50) | | | (41) | | | (28) | |
| Income tax benefit | 13 | | | 10 | | | 7 | |
| Stock based compensation expense, net of tax | $ | (37) | | | $ | (31) | | | $ | (21) | |
| | | | | |
| Decrease in basic earnings per common share | $ | (0.08) | | | $ | (0.06) | | | $ | (0.04) | |
| Decrease in diluted earnings per common share | $ | (0.08) | | | $ | (0.06) | | | $ | (0.04) | |
The total compensation cost related to outstanding awards not yet recognized is $60 million at December 31, 2024. This expense is expected to be recognized over the remaining weighted-average period of 1.7 years.
PERFORMANCE SHARES
The following table summarizes the performance award activity:
| | | | | | | | | | | | | | | | | | | | | | | | | | | | | | | | | | | |
| 2024 | | 2023 | | 2022 |
| (Shares in millions) | Number of Shares | | Weighted Average Grant Date Fair Value | | Number of Shares | | Weighted Average Grant Date Fair Value | | Number of Shares | | Weighted Average Grant Date Fair Value |
| Outstanding at beginning of year | 2.5 | | | $ | 29.09 | | | 2.7 | | | $ | 18.53 | | | 2.4 | | | $ | 14.04 | |
| Granted | 1.2 | | | 30.36 | | | 1.1 | | | 31.88 | | | 1.0 | | | 28.46 | |
| Distributed | (0.5) | | | 25.12 | | | (1.8) | | | 6.50 | | | (1.1) | | | 17.04 | |
| Performance adjustment | (0.1) | | | 25.12 | | | 0.7 | | | 6.43 | | | 0.5 | | | 17.84 | |
| Forfeited/canceled | (0.1) | | | 30.57 | | | (0.2) | | | 28.65 | | | (0.1) | | | 23.74 | |
| Outstanding at end of year | 3.0 | | | $ | 30.33 | | | 2.5 | | | $ | 29.09 | | | 2.7 | | | $ | 18.53 | |
The outstanding performance shares vest over a period of three years and are intended to be paid out in common shares. Performance is measured on the basis of relative TSR for the period and measured against the constituents of the S&P Metals and Mining ETF Index. The number of shares actually earned at the end of the three-year period will vary, based on performance, from 0% to 200% of the number of performance shares granted.
We value our performance shares using a Monte Carlo simulation on the grant date. A correlation matrix of historical and projected stock prices was developed for both the Company and its predetermined peer group of metals and mining companies. The fair value assumes that the performance objective will be achieved. The expected term of the grant represents the time from the grant date to the end of the service period. We estimate the volatility of our common shares and that of the peer group of metals and mining companies using daily price intervals for all companies. The risk-free interest rate is the rate at the grant date on zero-coupon government bonds, with a term commensurate with the remaining performance period.
RESTRICTED STOCK UNITS
The following table summarizes the restricted stock units activity:
| | | | | | | | | | | | | | | | | | | | | | | | | | | | | | | | | | | |
| 2024 | | 2023 | | 2022 |
| (Shares in millions) | Number of Shares | | Weighted Average Grant Date Fair Value | | Number of Shares | | Weighted Average Grant Date Fair Value | | Number of Shares | | Weighted Average Grant Date Fair Value |
| Outstanding at beginning of year | 2.5 | | | $ | 18.87 | | | 2.4 | | | $ | 13.66 | | | 2.1 | | | $ | 10.31 | |
| Granted | 1.2 | | | 19.54 | | | 1.2 | | | 19.30 | | | 1.0 | | | 19.41 | |
| Distributed | (0.6) | | | 17.55 | | | (0.9) | | | 5.99 | | | (0.6) | | | 10.47 | |
| Forfeited/canceled | — | | | 19.62 | | | (0.2) | | | 19.84 | | | (0.1) | | | 17.82 | |
| Outstanding at end of year | 3.1 | | | $ | 19.40 | | | 2.5 | | | $ | 18.87 | | | 2.4 | | | $ | 13.66 | |
We value our restricted stock units using the closing price of our common shares on the grant date. All of the outstanding restricted stock units are subject to continued employment, are retention based, and are payable in common shares or cash in certain circumstances at a time determined by the Compensation Committee at its discretion. Most restricted stock units were granted under three-year cliff vesting terms.
STOCK OPTIONS
The following table summarizes the stock option activity:
| | | | | | | | | | | | | | | | | | | | | | | | | | | | | | | | | | | |
| 2024 | | 2023 | | 2022 |
| (Shares in millions) | Number of Shares | | Weighted Average Exercise Price | | Number of Shares | | Weighted Average Exercise Price | | Number of Shares | | Weighted Average Exercise Price |
| Outstanding at beginning of year | 0.5 | | | $ | 9.59 | | | 0.6 | | | $ | 10.39 | | | 1.0 | | | $ | 12.75 | |
| Exercised | (0.3) | | | 7.79 | | | (0.1) | | | 10.22 | | | (0.3) | | | 16.55 | |
| Forfeited/canceled | — | | | 20.11 | | | — | | | 21.05 | | | (0.1) | | | 22.78 | |
| Outstanding at end of year | 0.2 | | | $ | 11.77 | | | 0.5 | | | $ | 9.59 | | | 0.6 | | | $ | 10.39 | |
| | | | | | | | | | | |
| Exercisable at end of year | 0.2 | | | $ | 11.77 | | | 0.5 | | | $ | 9.59 | | | 0.6 | | | $ | 10.52 | |
Stock options granted to date generally vest over a period from one to three years with an expiration date at ten years from the date of grant. The total intrinsic value of options exercised in 2024 and 2023 was $4 million and $1 million, respectively. As of December 31, 2024, all outstanding options were exercisable. For options outstanding at December 31, 2024, the weighted-average remaining contractual life was 3.0 years and the aggregate intrinsic value was nominal.
The fair value of stock options is estimated on the date of grant using a Black-Scholes model using the grant date price of our common shares, the option exercise price, the option’s expected term, the volatility of our common shares, the risk-free interest rate and the dividend yield over the option’s expected term.
NONEMPLOYEE DIRECTORS
Our nonemployee directors are entitled to receive restricted share awards under the Directors’ Plan. For 2024, 2023 and 2022, nonemployee directors were granted a specified number of restricted shares, with a value equal to $140,000 in each year. The number of shares is based on the closing price of our common shares on the grant date. The restricted share awards issued under the Directors' Plan generally vest 12 months from the grant date. The awards are subject to any deferral election and the terms of the Directors’ Plan and an award agreement.
NOTE 11 - INCOME TAXES
Income (loss) from continuing operations before income taxes includes the following components:
| | | | | | | | | | | | | | | | | | | | |
| | Year Ended December 31, |
| (In millions) | | 2024 | | 2023 | | 2022 |
| United States | | $ | (894) | | | $ | 600 | | | $ | 1,803 | |
| Foreign | | (49) | | | (3) | | | (7) | |
| Total | | $ | (943) | | | $ | 597 | | | $ | 1,796 | |
The components of the income tax expense (benefit) from continuing operations consist of the following:
| | | | | | | | | | | | | | | | | | | | |
| | Year Ended December 31, |
| (In millions) | | 2024 | | 2023 | | 2022 |
| Current provision: | | | | | | |
| United States federal | | $ | (38) | | | $ | 4 | | | $ | 201 | |
| United States state & local | | (6) | | | 26 | | | 131 | |
| Foreign | | 3 | | | 4 | | | 1 | |
| | (41) | | | 34 | | | 333 | |
| Deferred provision (benefit): | | | | | | |
| United States federal | | (152) | | | 97 | | | 117 | |
| United States state & local | | (33) | | | 7 | | | (22) | |
| Foreign | | (9) | | | 10 | | | (5) | |
| Total income tax expense (benefit) from continuing operations | | $ | (235) | | | $ | 148 | | | $ | 423 | |
Reconciliation of our income tax attributable to continuing operations computed at the U.S. federal statutory rate is as follows:
| | | | | | | | | | | | | | | | | | | | | | | | | | | | | | | | | | | | | | |
| (In millions) | | 2024 | | 2023 | | 2022 |
| Tax at U.S. statutory rate | | $ | (198) | | | 21 | % | | $ | 125 | | | 21 | % | | $ | 377 | | | 21 | % |
| Increase (decrease) due to: | | | | | | | | | | | | |
| Percentage depletion in excess of cost depletion | | (20) | | | 2 | | | (32) | | | (5) | | | (49) | | | (3) | |
| | | | | | | | | | | | |
| | | | | | | | | | | | |
| | | | | | | | | | | | |
| | | | | | | | | | | | |
| | | | | | | | | | | | |
| Valuation allowance | | — | | | — | | | 14 | | | 2 | | | — | | | — | |
| Unrecognized tax benefits | | 7 | | | — | | | 7 | | | 1 | | | 2 | | | — | |
| State taxes, net | | (30) | | | 3 | | | 28 | | | 5 | | | 71 | | | 4 | |
| | | | | | | | | | | | |
| Federal & state provision to return | | (4) | | | — | | | (20) | | | (3) | | | 27 | | | 1 | |
| | | | | | | | | | | | |
| Income not subject to tax | | (10) | | | 1 | | | (11) | | | (2) | | | (9) | | | — | |
| Goodwill impairment | | — | | | — | | | 26 | | | 4 | | | — | | | — | |
| Other items, net | | 20 | | | (2) | | | 11 | | | 2 | | | 4 | | | — | |
| Provision for income tax expense (benefit) and effective income tax rate including discrete items | | $ | (235) | | | 25 | % | | $ | 148 | | | 25 | % | | $ | 423 | | | 23 | % |
The increase in income tax benefit in 2024, as compared to income tax expense in 2023, as well as the decrease in income tax expense in 2023 compared to 2022 are predominantly related to the decrease in the pre-tax book income year-over-year.
The components of income taxes for other than continuing operations consisted of the following:
| | | | | | | | | | | | | | | | | | | | |
| (In millions) | | 2024 | | 2023 | | 2022 |
| Other comprehensive income (loss): | | | | | | |
| Pension and OPEB | | $ | 55 | | | $ | 10 | | | $ | (425) | |
| Derivative instruments | | (37) | | | 47 | | | 26 | |
| Total | | $ | 18 | | | $ | 57 | | | $ | (399) | |
| | | | | | |
| | | | | | |
| | | | | | |
| | | | | | |
Significant components of our deferred tax assets and liabilities are as follows:
| | | | | | | | | | | |
| (In millions) | 2024 | | 2023 |
| Deferred tax assets: | | | |
| Operating loss and other carryforwards | $ | 589 | | | $ | 390 | |
| Pension and OPEB liabilities | 129 | | | 155 | |
| | | |
| | | |
| Environmental | 69 | | | 67 | |
| | | |
| Product inventories | 53 | | | 92 | |
| | | |
| State and local | 36 | | | 9 | |
| Lease liabilities | 87 | | | 79 | |
| Other liabilities | 151 | | | 180 | |
| Total deferred tax assets before valuation allowance | 1,114 | | | 972 | |
| Deferred tax asset valuation allowance | (388) | | | (396) | |
| Net deferred tax assets | 726 | | | 576 | |
| Deferred tax liabilities: | | | |
| Investment in ventures | (181) | | | (192) | |
| | | |
| Lease assets | (88) | | | (79) | |
| Property, plant and equipment and mineral rights | (811) | | | (837) | |
| Intangible assets | (441) | | | (27) | |
| Other assets | (59) | | | (76) | |
| Total deferred tax liabilities | (1,580) | | | (1,211) | |
| Net deferred tax liabilities | $ | (854) | | | $ | (635) | |
We had gross domestic (including states) and foreign NOLs of $3,549 million and $1,507 million, respectively, at December 31, 2024. We had gross domestic (including states) and foreign NOLs of $1,704 million and $1,452 million, respectively, at December 31, 2023. The U.S. federal NOLs will begin to expire in 2034, and state NOLs begin to expire in 2025. The foreign NOLs begin to expire in 2035. For the year ended December 31, 2024, we had $92 million gross U.S. interest expense limitation carryforwards. For the year ended December 31, 2023, we had no gross interest expense limitation carryforwards.
The changes in the valuation allowance are presented below:
| | | | | | | | | | | | | | | | | |
| (In millions) | 2024 | | 2023 | | 2022 |
| Balance at beginning of year | $ | 396 | | | $ | 390 | | | $ | 409 | |
| Change in valuation allowance: | | | | | |
| Income tax (benefit) expense | (8) | | | 6 | | | (19) | |
| | | | | |
| | | | | |
| Balance at end of year | $ | 388 | | | $ | 396 | | | $ | 390 | |
At December 31, 2024 and 2023, we have a valuation allowance recorded of $349 million and $356 million, respectively, related to foreign deferred tax assets, and an additional $39 million and $40 million, respectively, against certain state NOLs, which are expected to expire before utilization.
During 2023, we recorded a $14 million valuation allowance against a portion of our Canadian deferred tax assets due to losses in recent years. We intend to maintain a valuation allowance against these deferred tax assets, unless and until sufficient positive evidence exists to support the realization of such assets.
Our losses in Luxembourg in recent periods represent sufficient negative evidence to require a full valuation allowance against the deferred tax assets in that jurisdiction. We intend to maintain a valuation allowance against the deferred tax assets related to these operating losses, unless and until sufficient positive evidence exists to support the realization of such assets.
At December 31, 2024 and 2023, we had no cumulative undistributed earnings of foreign subsidiaries included in retained earnings. Accordingly, no provision has been made for U.S. deferred taxes related to future repatriation of earnings.
A reconciliation of the beginning and ending amount of unrecognized tax benefits is as follows:
| | | | | | | | | | | | | | | | | |
| (In millions) | 2024 | | 2023 | | 2022 |
| Unrecognized tax benefits balance as of January 1 | $ | 76 | | | $ | 58 | | | $ | 35 | |
| Increases for tax positions in current year | 46 | | | 18 | | | 24 | |
| Decrease due to tax positions in prior year | (1) | | | — | | | (1) | |
| Unrecognized tax benefits balance as of December 31 | $ | 121 | | | $ | 76 | | | $ | 58 | |
At December 31, 2024 and 2023, we had unrecognized tax benefits of $121 million and $76 million, respectively. Of these amounts, $75 million and $76 million were included in Other non-current liabilities on the Statements of Consolidated Financial Position. Additionally, $46 million was included in Deferred income taxes at December 31, 2024. If the unrecognized tax benefits were recognized, the $75 million would impact the effective tax rate. Interest and penalties related to unrecognized tax benefits are $7 million for the year ended December 31, 2024. We do not expect that the amount of unrecognized benefits will change significantly within the next 12 months.
Tax years 2016 and forward remain subject to examination for the U.S., and tax years 2020 and forward remain subject to examination for Canada.
NOTE 12 - LEASE OBLIGATIONS
Our operating leases consist primarily of leases for land, office space, rail cars and storage tanks. Our finance leases consist primarily of mining equipment and rail cars. When an implicit discount rate is not readily determinable under our leases, we use our incremental borrowing rate as the discount rate to determine the present value of the lease payments. Our incremental borrowing rate is the rate of interest that we would have to borrow on a collateralized basis over a similar term and amount in a similar economic environment to pay our lease obligations. We determine the incremental borrowing rates for our leases by adjusting the local risk-free interest rate with a credit risk premium corresponding to our credit rating. From time to time, we may enter into arrangements for the construction or purchase of an asset and then enter into a financing arrangement to lease the asset. We recognize leased assets and liabilities under these arrangements when we obtain control of the asset.
The following table summarizes the lease amounts included in our Statements of Consolidated Financial Position as of December 31, 2024 and 2023:
| | | | | | | | | | | | | | | | | | | | |
| | | | Year Ended December 31, |
| (In millions) | | Balance Sheet Location | | 2024 | | 2023 |
| Assets: | | | | | | |
| Finance | | Property, plant and equipment, net | | $ | 505 | | | $ | 306 | |
| Operating | | Other non-current assets | | 351 | | | 228 | |
| Current liabilities | | | | | | |
| Finance | | Other current liabilities | | $ | 63 | | | $ | 49 | |
| Operating | | Other current liabilities | | 50 | | | 41 | |
| Non-current liabilities | | | | | | |
| Finance | | Other non-current liabilities | | $ | 319 | | | $ | 166 | |
| Operating | | Other non-current liabilities | | 275 | | | 197 | |
Lease costs are presented below:
| | | | | | | | | | | | | | | | | |
| Year Ended December 31, |
| (In millions) | 2024 | | 2023 | | 2022 |
| Operating leases | $ | 64 | | | $ | 59 | | | $ | 64 | |
| Finance leases: | | | | | |
| Amortization of right-of-use assets | 38 | | | 92 | | | 103 | |
| Interest on lease liabilities | 15 | | | 11 | | | 8 | |
| Short-term leases | 174 | | | 171 | | | 160 | |
| | | | | |
| Total | $ | 291 | | | $ | 333 | | | $ | 335 | |
Lease terms and discount rates are shown below:
| | | | | |
| December 31, |
| 2024 |
| Weighted average lease term (in years): | |
| Operating leases | 11 |
| Finance leases | 9 |
| Weighted average discount rate: | |
| Operating leases | 7 | % |
| Finance leases | 6 | % |
Other information related to leases was as follows:
| | | | | | | | | | | | | | | | | |
| Year Ended December 31, |
| (In millions) | 2024 | | 2023 | | 2022 |
| Cash paid for amounts included in measurement of lease liabilities: | | | | | |
| Operating leases within cash flows from operating activities | $ | 62 | | $ | 57 | | $ | 62 |
| Finance leases within cash flows from operating activities | 14 | | 11 | | 8 |
| Finance leases within cash flows from financing activities | 49 | | 92 | | 96 |
Right-of-use assets obtained in exchange for new finance lease liabilities1 | 97 | | 93 | | 55 |
Right-of-use assets obtained in exchange for new operating lease liabilities1 | 87 | | 42 | | 31 |
| | | | | |
1Right-of-use assets obtained as a result of the Stelco Acquisition are not included. |
The following is a summary of future minimum lease payments under noncancellable finance and operating leases as of December 31, 2024:
| | | | | | | | | | | |
| (In millions) | Finance Leases | | Operating Leases |
| 2025 | $ | 81 | | | $ | 68 | |
| 2026 | 71 | | | 61 | |
| 2027 | 58 | | | 57 | |
| 2028 | 56 | | | 47 | |
| 2029 | 52 | | | 38 | |
| Thereafter | 193 | | | 188 | |
| Total future minimum lease payments | 511 | | | 459 | |
| Less: imputed interest | 129 | | | 134 | |
| Total lease payments | 382 | | | 325 | |
| Less: current portion of lease liabilities | 63 | | | 50 | |
| Long-term lease liabilities | $ | 319 | | | $ | 275 | |
The current and long-term portions of our finance and operating lease liabilities are included in Other current liabilities and Other non-current liabilities, respectively.
NOTE 13 - ASSET RETIREMENT AND ENVIRONMENTAL OBLIGATIONS
ASSET RETIREMENT OBLIGATIONS
The accrued closure obligation provides for contractual and legal obligations related to our indefinitely idled and closed operations and for the eventual closure of our active operations. The closure date for each of our active mine sites was determined based on the exhaustion date of the remaining mineral reserves, and the amortization of the related asset and accretion of the liability is recognized over the estimated mine lives. The closure date and expected timing of the capital requirements to meet our obligations for our indefinitely idled or closed mines is determined based on the unique circumstances of each property. For indefinitely idled or closed mines, the accretion of the liability is recognized over the anticipated timing of remediation. Asset retirement obligations at our steelmaking operations primarily include the closure and post-closure care for on-site landfills and other waste containment facilities. Asset retirement obligations have been recorded at present values using settlement dates based on when we expect these facilities to reach capacity and close.
The following is a summary of our asset retirement obligations:
| | | | | | | | | | | |
| December 31, |
| (In millions) | 2024 | | 2023 |
Asset retirement obligations1 | $ | 526 | | | $ | 459 | |
| Less: current portion | 25 | | | 15 | |
| Long-term asset retirement obligations | $ | 501 | | | $ | 444 | |
| | | |
1 Includes $302 million and $259 million related to our active operations as of December 31, 2024 and 2023, respectively. |
The following is a roll-forward of our asset retirement obligation:
| | | | | | | | | | | | |
| (In millions) | 2024 | | 2023 | |
| Asset retirement obligation as of January 1 | $ | 459 | | | $ | 520 | | |
| Increase from Stelco Acquisition | 20 | | | — | | |
| Decrease from sale of business | — | | | (76) | | |
| Accretion expense | 22 | | | 26 | | |
| Remediation payments | (33) | | | (21) | | |
| Revision in estimated cash flows | 58 | | | 10 | | |
| Asset retirement obligation as of December 31 | $ | 526 | | | $ | 459 | | |
During the first quarter of 2024, we announced the indefinite idle of our Weirton tinplate production plant, resulting in an increase to our asset retirement obligations as a result of acceleration of the timing and refinement in the cost required.
ENVIRONMENTAL OBLIGATIONS
Our operations currently use, and have in the past used, hazardous materials and substances, and we have generated, and expect to continue to generate, solid and hazardous waste. We have been, and may in the future be, subject to claims under laws and regulations for toxic torts, natural resource damages and other damages, as well as for the investigation and clean-up of soil,
surface water, sediments, groundwater, and other natural resources and reclamation of properties. If we reasonably can, we estimate potential remediation expenditures for those sites where future remediation efforts are probable based on identified conditions, regulatory requirements, or contractual obligations arising from the sale of a business or facility. For sites involving government required investigations, including pursuant to RCRA and CERCLA, we typically make an estimate of potential remediation expenditures only after the investigation is complete and when we better understand the nature and scope of the remediation. In general, the material factors in these estimates include the costs associated with investigations, delineations, risk assessments, remedial work, governmental response and oversight, site monitoring and preparation of reports to the appropriate environmental agencies.
The following is a summary of our environmental obligations:
| | | | | | | | | | | |
| December 31, |
| (In millions) | 2024 | | 2023 |
| Environmental obligations | $ | 114 | | | $ | 134 | |
| Less: current portion | 14 | | | 21 | |
| Long-term environmental obligations | $ | 100 | | | $ | 113 | |
NOTE 14 - FAIR VALUE OF FINANCIAL INSTRUMENTS
The carrying values of certain financial instruments (e.g. Accounts receivable, net, Accounts payable and Other current liabilities) approximate fair value and, therefore, have been excluded from the table below. See NOTE 15 - DERIVATIVE INSTRUMENTS AND HEDGING for information on our derivative instruments, which are accounted for at fair value on a recurring basis.
The following table summarizes the carrying value and fair value of other financial instruments:
| | | | | | | | | | | | | | | | | | | | | | | | | | | | | |
| | | December 31, 2024 | | December 31, 2023 |
| (In millions) | Classification | | Carrying
Value | | Fair Value | | Carrying
Value | | Fair Value |
| Senior notes | Level 1 | | $ | 5,505 | | | $ | 5,496 | | | $ | 3,137 | | | $ | 3,118 | |
| ABL Facility - outstanding balance | Level 2 | | 1,560 | | | 1,560 | | | — | | | — | |
| Total | | | $ | 7,065 | | | $ | 7,056 | | | $ | 3,137 | | | $ | 3,118 | |
The valuation of financial assets classified in Level 2 was determined using a market approach based upon quoted prices for similar assets in active markets or other inputs that were observable.
EMPLOYEE BENEFIT COMMITMENT
In connection with the Stelco Acquisition, we have acquired funding commitments to employee life and health trusts. These obligations pertain to plans previously sponsored by Stelco prior to its bankruptcy. The commitments primarily involve fixed scheduled payments that will continue until 2042, with an additional variable component tied to Stelco's standalone operating performance. The financial liability is recorded at fair value on a recurring basis using a discounted cash flow model, which incorporates observable and unobservable inputs for risk-free interest rates and future operating estimates. The liability is classified as a Level 3 within the fair value hierarchy. The current and non-current portions of the employee benefit commitment are classified within Other current liabilities and Other non-current liabilities on the Statements of Consolidated Financial Position, respectively.
The following table summarizes the changes in fair value of the employee benefit commitment:
| | | | | | | |
| (In millions) | 2024 | | |
| Beginning balance as of January 1 | $ | — | | | |
| Fair value of commitment assumed in connection with Stelco Acquisition | (197) | | | |
| Total losses included in earnings | (2) | | | |
| Payments | 5 | | | |
| Foreign currency translation | 6 | | | |
| Ending balance as of December 31 | $ | (188) | | | |
MINNTAC OPTION
Stelco is party to an option to purchase a 25% ownership interest in the MinnTac iron ore mine and related infrastructure located in Mt. Iron, Minnesota from U. S. Steel for $500 million. This option is exercisable by Stelco at any time until January 31, 2027. This option is recorded as a derivative instrument at fair value on a recurring basis and included within Other non-current assets on the Statements of Consolidated Financial Position. Any gain or loss recorded in relation to the fair value of this option is presented within Other non-operating income (loss). The fair value of the derivative asset is estimated using the Black-Scholes option pricing model, which incorporates observable or unobservable inputs for risk-free interest rates, foreign exchange rates, commodity prices,
discount rates, corresponding market volatility levels and other market-based pricing factors. This option is classified as a Level 3 derivative asset within the fair value hierarchy.
The following table summarizes the changes in fair value of the MinnTac option:
| | | | | | | |
| (In millions) | 2024 | | |
| Beginning balance as of January 1 | $ | — | | | |
| Fair value of option acquired in connection with Stelco Acquisition | 110 | | | |
| Total losses included in earnings | (12) | | | |
| Foreign currency translation | (3) | | | |
| Ending balance as of December 31 | $ | 95 | | | |
NOTE 15 - DERIVATIVE INSTRUMENTS AND HEDGING
We are exposed to price risk associated with fluctuations in the market prices of purchased raw materials and energy sources and the sales price of certain steel products. We may use cash-settled commodity purchase swaps to hedge the market risk associated with the purchase of certain of our raw materials and energy requirements and cash-settled sales swaps to hedge the sales price risk of certain steel products. Our hedging strategy is to reduce the effect on earnings from the price volatility of these various exposures.
Our commodity purchase swaps are designated as cash flow hedges for accounting purposes, and we record the gains and losses for the derivatives in Accumulated other comprehensive income until we reclassify them into Cost of goods sold when we recognize the associated underlying operating costs. Impacts of our designated commodity purchase swaps are reflected within Other, net in the Statements of Consolidated Cash Flows. Refer to NOTE 17 - ACCUMULATED OTHER COMPREHENSIVE INCOME (LOSS) for further information.
Our commodity purchase swaps are classified as Level 2 as values were determined using a market approach based upon quoted prices for similar assets in active markets or other inputs that were observable.
The following table presents the notional amount of our outstanding commodity purchase swaps:
| | | | | | | | | | | | | | | | | | | | | | | | | | |
| | | | | | Notional Amount |
| | | | | | December 31, |
| Commodity Purchase Swaps | | Unit of Measure | | Maturity Dates | | 2024 | | 2023 |
| Natural Gas | | MMBtu | | January 2025 - August 2027 | | 143,250,000 | | 168,590,000 |
| Electricity | | Megawatt hours | | January 2025 - October 2027 | | 3,224,227 | | 3,501,898 |
At December 31, 2024, we estimate $68 million of net losses related to our commodity purchase swaps will reclassify from Accumulated other comprehensive income into Cost of goods sold during the next 12 months. These estimates are based on December 31, 2024 fair values, some of which will change before their actual reclassification into Cost of goods sold.
The following table presents the fair value of our cash flow hedges and the classification on the Statements of Consolidated Financial Position:
| | | | | | | | | | | | | | |
| | December 31, |
| Balance Sheet Location (In millions) | | 2024 | | 2023 |
| Other current assets | | $ | 5 | | | $ | — | |
| Other non-current assets | | 9 | | | 1 | |
| Other current liabilities | | (41) | | | (105) | |
| Other non-current liabilities | | (6) | | | (52) | |
FOREIGN CURRENCY CONTRACTS
On July 15, 2024, we announced that we had entered into the Arrangement Agreement with Stelco Holdings Inc. to acquire all of its common shares in a cash and stock transaction. We hedged a portion of the purchase price by entering into multiple foreign currency contracts. These hedge contracts were considered economic hedges and did not qualify for hedge accounting. During the year ended December 31, 2024, these contracts resulted in a loss of $29 million presented in Other non-operating income (loss) in the Statements of Consolidated Operations and in Other investing activities in the Statements of Consolidated Cash Flows. As of December 31, 2024, no foreign currency contracts are outstanding.
NOTE 16 - CAPITAL STOCK
SHARE REPURCHASE PROGRAMS
During the first quarter of 2024, we fully utilized the remaining portion of our prior $1 billion share repurchase program, which was approved by our Board of Directors on February 10, 2022.
On April 22, 2024, our Board of Directors authorized a new program to repurchase our outstanding common shares in the open market or in privately negotiated transactions, which may include purchases pursuant to Rule 10b5-1 plans or accelerated share repurchases, up to a maximum of $1.5 billion. We are not obligated to make any repurchases, and the program may be suspended or discontinued at any time. The share repurchase program does not have a specific expiration date.
For the years ended December 31, 2024 and 2023, we repurchased 37.9 million and 10.4 million common shares, respectively, at a cost of $733 million and $152 million in the aggregate, respectively. The cost of our share repurchases excludes the excise tax due under the Inflation Reduction Act. As of December 31, 2024, there was $1.4 billion remaining authorization under our active share repurchase program.
PREFERRED STOCK
We have 3 million shares of Serial Preferred Stock, Class A, without par value, authorized, and 4 million shares of Serial Preferred Stock, Class B, without par value, authorized; no preferred shares were issued or outstanding as of December 31, 2024.
STELCO ACQUISITION
As more fully described in NOTE 3 - ACQUISITIONS, we completed the Stelco Acquisition on November 1, 2024. At closing, each Stelco shareholder received CAD $60.00 in cash and 0.454 shares of Cliffs common stock per share of Stelco common stock. Additionally, Stelco equity award holders received CAD $60.00 in cash and 0.454 shares of Cliffs common stock per outstanding restricted share unit and deferred share unit. As a result of the Stelco Acquisition, we issued a total of 25.9 million Cliffs treasury shares at a fair value of $343 million.
NOTE 17 - ACCUMULATED OTHER COMPREHENSIVE INCOME (LOSS)
The components of Accumulated other comprehensive income within Cliffs shareholders’ equity and related tax effects allocated to each are shown below:
| | | | | | | | | | | | | | | | | |
| December 31, |
| (In millions) | 2024 | | 2023 | | 2022 |
| Foreign Currency Translation | | | | | |
| Beginning balance | $ | — | | | $ | (1) | | | $ | 1 | |
| Other comprehensive income (loss) before reclassifications | (70) | | | 1 | | | (2) | |
| Ending balance | $ | (70) | | | $ | — | | | $ | (1) | |
| | | | | |
| Derivative Instruments | | | | | |
| Beginning balance | $ | (170) | | | $ | (16) | | | $ | 68 | |
| Other comprehensive income (loss) before reclassifications | (41) | | | (345) | | | 146 | |
| Income tax | 10 | | | 81 | | | (33) | |
| Other comprehensive income (loss) before reclassifications, net of tax | (31) | | | (264) | | | 113 | |
Losses (gains) reclassified from AOCI to net income1 | 195 | | | 144 | | | (256) | |
Income tax expense (benefit)2 | (47) | | | (34) | | | 59 | |
| Net losses (gains) reclassified from AOCI to net income | 148 | | | 110 | | | (197) | |
| Ending balance | $ | (53) | | | $ | (170) | | | $ | (16) | |
| | | | | |
| Pension and OPEB | | | | | |
| Beginning balance | $ | 1,827 | | | $ | 1,847 | | | $ | 549 | |
Other comprehensive income (loss) before reclassifications4 | (68) | | | 115 | | | 1,759 | |
| Income tax | 17 | | | (39) | | | (434) | |
| Other comprehensive income (loss) before reclassifications, net of tax | (51) | | | 76 | | | 1,325 | |
Gains reclassified from AOCI to net income3 | (154) | | | (145) | | | (36) | |
Income tax expense2 | 38 | | | 49 | | | 9 | |
| Net gains reclassified from AOCI to net income | (116) | | | (96) | | | (27) | |
| Ending balance | $ | 1,660 | | | $ | 1,827 | | | $ | 1,847 | |
| | | | | |
| Total AOCI Ending Balance | $ | 1,537 | | | $ | 1,657 | | | $ | 1,830 | |
|
1 Amounts recognized in Cost of goods sold in the Statements of Consolidated Operations. |
2 Amounts recognized in Income tax benefit (expense) in the Statements of Consolidated Operations. |
3 Amounts recognized in Net periodic benefit credits other than service cost component in the Statements of Consolidated Operations. |
4 Refer to NOTE 9 - PENSIONS AND OTHER POSTRETIREMENT BENEFITS for further information. |
NOTE 18 - VARIABLE INTEREST ENTITIES
SUNCOKE MIDDLETOWN
We purchase all the coke and electrical power generated from SunCoke Middletown’s plant under long-term supply agreements and have committed to purchase all the expected production from the facility through 2032. We consolidate SunCoke Middletown as a VIE because we are the primary beneficiary despite having no ownership interest in SunCoke Middletown. SunCoke Middletown had income before income taxes of $52 million for each of the years ended December 31, 2024 and 2023, which was included in our consolidated Income (loss) from continuing operations before income taxes. Additionally, SunCoke Middletown had cash used for capital expenditures of $24 million for the year ended December 31, 2024, compared to $25 million for the year ended December 31, 2023, that are included in our consolidated Purchase of property, plant and equipment on the Statements of Consolidated Cash Flows.
The assets of the consolidated VIE can only be used to settle the obligations of the consolidated VIE and not obligations of the Company. The creditors of SunCoke Middletown do not have recourse to the assets or general credit of the Company to satisfy liabilities of the VIE. The Statements of Consolidated Financial Position includes the following amounts for SunCoke Middletown:
| | | | | | | | | | | |
| December 31, |
| (In millions) | 2024 | | 2023 |
| | | |
| Inventories | $ | 27 | | | $ | 29 | |
| Property, plant and equipment, net | 288 | | | 288 | |
| Accounts payable | (19) | | | (26) | |
| Other assets (liabilities), net | (47) | | | (39) | |
| Noncontrolling interests | (249) | | | (252) | |
NOTE 19 - EARNINGS PER SHARE
The following table summarizes the computation of basic and diluted EPS:
| | | | | | | | | | | | | | | | | |
| Year Ended December 31, |
| (In millions, except per share amounts) | 2024 | | 2023 | | 2022 |
| Income (loss) from continuing operations | $ | (708) | | | $ | 449 | | | $ | 1,373 | |
| Income from continuing operations attributable to noncontrolling interest | (46) | | | (51) | | | (41) | |
| Net income (loss) from continuing operations attributable to Cliffs shareholders | (754) | | | 398 | | | 1,332 | |
| Income from discontinued operations, net of tax | — | | | 1 | | | 3 | |
| Net income (loss) attributable to Cliffs shareholders | $ | (754) | | | $ | 399 | | | $ | 1,335 | |
| | | | | |
| Weighted average number of shares: | | | | | |
| Basic | 480 | | | 510 | | | 519 | |
| Convertible senior notes | — | | | — | | | 2 | |
| Employee stock plans | — | | | 1 | | | 3 | |
| Diluted | 480 | | | 511 | | | 524 | |
| | | | | |
| Earnings (loss) per common share attributable to Cliffs common shareholders - basic: | | | | | |
| Continuing operations | $ | (1.57) | | | $ | 0.78 | | | $ | 2.57 | |
| Discontinued operations | — | | | — | | | — | |
| $ | (1.57) | | | $ | 0.78 | | | $ | 2.57 | |
| Earnings (loss) per common share attributable to Cliffs common shareholders - diluted: | | | | | |
| Continuing operations | $ | (1.57) | | | $ | 0.78 | | | $ | 2.55 | |
| Discontinued operations | — | | | — | | | — | |
| $ | (1.57) | | | $ | 0.78 | | | $ | 2.55 | |
The following table summarizes the potentially dilutive shares that were excluded from the computation of diluted earnings per share because their effect would have been anti-dilutive:
| | | | | | | | | | | | | | | | | |
| Year Ended December 31, |
| (In millions) | 2024 | | 2023 | | 2022 |
| Employee stock plans | 2 | | 2 | | | — | |
NOTE 20 - COMMITMENTS AND CONTINGENCIES
PURCHASE COMMITMENTS
We purchase portions of the principal raw materials required for our steel manufacturing operations under annual and multi-year agreements, some of which have minimum quantity requirements. We also use large volumes of natural gas, electricity and industrial gases in our operations. We negotiate most of our purchases of chrome, industrial gases and a portion of our electricity under multi-year agreements. Our purchases of coke and iron ore are made under annual or multi-year agreements with periodic price adjustments. We typically purchase coal under annual fixed price agreements. We also purchase certain transportation services under multi-year contracts with minimum quantity requirements.
Unconditional purchase obligations, including take-or-pay agreements, are as follows (in millions):
| | | | | | | | | | | | | | | | | | | | | | | | | | | | | | | | |
| 2025 | | 2026 | | 2027 | | 2028 | | 2029 | | Thereafter |
| $ | 3,073 | | | $ | 1,618 | | | $ | 1,439 | | | $ | 1,044 | | | $ | 913 | | | $ | 4,694 | |
OTHER COMMERCIAL COMMITMENTS
We use surety bonds and letters of credit to provide financial assurance for certain obligations and statutory requirements. As of December 31, 2024, we had $271 million of surety-backed letters of credit and surety bonds outstanding. Additionally, as of December 31, 2024, we had $62 million of outstanding letters of credit issued under our ABL Facility.
CONTINGENCIES
We are currently the subject of, or party to, various claims and legal proceedings incidental to our current and historical operations. These claims and legal proceedings are subject to inherent uncertainties and unfavorable rulings could occur. An unfavorable ruling could include monetary damages, additional funding requirements or an injunction. If an unfavorable ruling were to occur, there exists the possibility of a material adverse effect on our financial position and results of operations for the period in which the ruling occurs or future periods. However, based on currently available information, we do not believe that any pending claims or legal proceedings will result in a material adverse effect in relation to our consolidated financial statements.
ENVIRONMENTAL CONTINGENCIES
Our environmental remediation obligations for known environmental matters at active and closed operations have been recognized based on estimates of the cost of investigation and remediation at each facility. We cannot predict the ultimate costs for each site with certainty because of the evolving nature of the investigation and remediation process. Rather, to estimate the probable costs, we must make certain assumptions. The most significant of these assumptions is for the nature and scope of the work that will be necessary to investigate and remediate a particular site and the cost of that work. Other significant assumptions include the cleanup technology that will be used, whether and to what extent any other parties will participate in paying the investigation and remediation costs, reimbursement of past response costs and future oversight costs by governmental agencies, and the reaction of the governing environmental agencies to the proposed work plans. Costs for future investigation and remediation are not discounted to their present value, unless the amount and timing of the cash disbursements are readily known. To the extent that we have been able to reasonably estimate future liabilities, we do not believe that there is a reasonable possibility that we will incur a loss or losses that exceed the amounts we accrued that would, either individually or in the aggregate, have a material adverse effect on our consolidated financial condition, results of operations or cash flows. However, since we recognize amounts in the consolidated financial statements in accordance with GAAP that exclude potential losses that are not probable or that may not be currently estimable, the ultimate costs of these environmental matters may be higher than the liabilities we currently have recorded in our consolidated financial statements.
Pursuant to RCRA, which governs the treatment, handling and disposal of hazardous waste, the EPA and authorized state environmental agencies may conduct inspections of RCRA-regulated facilities to identify areas where there have been releases of hazardous waste or hazardous constituents into the environment and may order the facilities to take corrective action to remediate such releases. Likewise, the EPA or the states may require closure or post-closure care of residual, industrial and hazardous waste management units. Environmental regulators have the authority to inspect all of our facilities. While we cannot predict the future actions of these regulators, it is possible that they may identify conditions in future inspections of these facilities that they believe require corrective action.
Pursuant to CERCLA, the EPA and state environmental authorities have conducted site investigations at some of our facilities and other third-party facilities, portions of which previously may have been used for disposal of materials that are currently regulated. The results of certain of these investigations remain pending, and we could be directed to spend funds for remedial activities at the former disposal areas. Because of the uncertain status of these investigations, however, we cannot reasonably predict whether or when such spending might be required or its magnitude.
In addition to the foregoing matters, we are or may be involved in proceedings with various regulatory authorities that may require us to pay fines, comply with more rigorous standards or other requirements or incur capital and operating expenses for environmental compliance. We believe that the ultimate disposition of any such proceedings will not have, individually or in the aggregate, a material adverse effect on our consolidated financial condition, results of operations or cash flows.
TAX MATTERS
The calculation of our tax liabilities involves dealing with uncertainties in the application of complex tax regulations. We recognize liabilities for anticipated tax audit issues based on our estimate of whether, and the extent to which, additional taxes will be due. If we ultimately determine that payment of these amounts is unnecessary, we reverse the liability and recognize a tax benefit during the period in which we determine that the liability is no longer necessary. We also recognize tax benefits to the extent that it is more likely than not that our positions will be sustained when challenged by the taxing authorities. To the extent we prevail in matters for which liabilities have been established, or are required to pay amounts in excess of our liabilities, our effective tax rate in a given period could be materially affected. An unfavorable tax settlement would require use of our cash and result in an increase in our effective tax rate in the year of resolution. A favorable tax settlement would be recognized as a reduction in our effective tax rate in the year of resolution. Refer to NOTE 11 - INCOME TAXES for further information.
OTHER CONTINGENCIES
In addition to the matters discussed above, there are various pending and potential claims against us and our subsidiaries involving antitrust, product liability, personal injury, commercial, employee benefits and other matters arising in the ordinary course of business. Because of the considerable uncertainties that exist for any claim, it is difficult to reliably or accurately estimate what the amount of a loss would be if a claimant prevails. If material assumptions or factual understandings we rely on to evaluate exposure for these contingencies prove to be inaccurate or otherwise change, we may be required to record a liability for an adverse outcome. If, however, we have reasonably evaluated potential future liabilities for all of these contingencies, including those described more specifically above, it is our opinion, unless we otherwise noted, that the ultimate liability from these contingencies, individually or in the aggregate, should not have a material adverse effect on our consolidated financial position, results of operations or cash flows.
NOTE 21 - SUBSEQUENT EVENTS
On February 6, 2025, we issued $850 million aggregate principal amount of 7.500% Senior Notes due 2031 at par in a private placement transaction exempt from the registration requirements of the Securities Act. The net proceeds will be used for general corporate purposes, including the repayment of borrowings under our ABL Facility.
REPORT OF INDEPENDENT REGISTERED PUBLIC ACCOUNTING FIRM
To the shareholders and the Board of Directors of
Cleveland-Cliffs Inc.
OPINION ON THE FINANCIAL STATEMENTS
We have audited the accompanying statements of consolidated financial position of Cleveland-Cliffs Inc. and subsidiaries (the "Company") as of December 31, 2024 and 2023, the related statements of consolidated operations, comprehensive income, cash flows, and changes in equity, for each of the three years in the period ended December 31, 2024, and the related notes (collectively referred to as the "financial statements"). In our opinion, the financial statements present fairly, in all material respects, the financial position of the Company as of December 31, 2024 and 2023, and the results of its operations and its cash flows for each of the three years in the period ended December 31, 2024, in conformity with accounting principles generally accepted in the United States of America.
We have also audited, in accordance with the standards of the Public Company Accounting Oversight Board (United States) (PCAOB), the Company's internal control over financial reporting as of December 31, 2024, based on criteria established in Internal Control — Integrated Framework (2013) issued by the Committee of Sponsoring Organizations of the Treadway Commission and our report dated February 25, 2025, expressed an unqualified opinion on the Company's internal control over financial reporting.
BASIS FOR OPINION
These financial statements are the responsibility of the Company's management. Our responsibility is to express an opinion on the Company's financial statements based on our audits. We are a public accounting firm registered with the PCAOB and are required to be independent with respect to the Company in accordance with the U.S. federal securities laws and the applicable rules and regulations of the Securities and Exchange Commission and the PCAOB.
We conducted our audits in accordance with the standards of the PCAOB. Those standards require that we plan and perform the audit to obtain reasonable assurance about whether the financial statements are free of material misstatement, whether due to error or fraud. Our audits included performing procedures to assess the risks of material misstatement of the financial statements, whether due to error or fraud, and performing procedures that respond to those risks. Such procedures included examining, on a test basis, evidence regarding the amounts and disclosures in the financial statements. Our audits also included evaluating the accounting principles used and significant estimates made by management, as well as evaluating the overall presentation of the financial statements. We believe that our audits provide a reasonable basis for our opinion.
CRITICAL AUDIT MATTER
The critical audit matters communicated below are matters arising from the current-period audit of the financial statements that were communicated or required to be communicated to the audit committee and that (1) relate to accounts or disclosures that are material to the financial statements and (2) involved our especially challenging, subjective, or complex judgments. The communication of critical audit matters does not alter in any way our opinion on the financial statements, taken as a whole, and we are not, by communicating the critical audit matters below, providing separate opinions on the critical audit matters or on the accounts or disclosures to which they relate.
GOODWILL - A REPORTING UNIT WITHIN THE STEELMAKING SEGMENT - REFER TO NOTES 1 AND 7 TO THE FINANCIAL STATEMENTS
Critical Audit Matter Description
The Company’s evaluation of goodwill for impairment involves the comparison of the fair value of each reporting unit to its carrying value. The Company determines the fair value of its reporting units using a discounted cash flow methodology and a guideline public company methodology. The determination of the fair value using these methodologies requires management to make significant estimates and assumptions related to forecasts of future revenues and earnings before interest, taxes, depreciation, and amortization (EBITDA), discount rates and market multiples. The fair value of all reporting units exceeded their carrying value as of the measurement date and, therefore, no impairment was recognized.
Given the nature of operations for one reporting unit within the Steelmaking segment, the sensitivity of this reporting unit to changes in the market price of steel, this reporting unit’s historical performance as compared to projections, and the difference between its fair value and the carrying value, auditing management’s judgments regarding forecasts of future revenues and EBITDA, selection of the discount rate, and selection of market multiples applied to management’s forecast for this reporting unit, required a high degree of auditor judgment and an increased extent of effort, including the need to involve our fair value specialists.
How the Critical Audit Matter Was Addressed in the Audit
Our audit procedures related to the forecasts of future revenues and EBITDA, the selection of the discount rate, and selection of market multiples applied to management’s forecasts for this reporting unit included the following, among others:
•We tested the design and effectiveness of controls over management’s goodwill impairment evaluation, such as controls related to management’s forecasts, the selection of the discount rate, and market multiples used.
•We evaluated management’s ability to accurately forecast by comparing actual results to management’s historical forecasts.
•We evaluated the reasonableness of management’s forecasts by comparing the current forecasts to historical results and forecasted information included in analyst and industry reports of the Company and companies in its peer group.
•With the assistance of our fair value specialists, we evaluated the discount rate, including testing the underlying source information and the mathematical accuracy of the calculations, and developing a range of independent estimates and comparing those to the discount rate selected by management.
•We evaluated the market multiples, including testing the underlying source information and mathematical accuracy of the calculations, and comparing the multiples selected by management to its guideline companies.
ACQUISITIONS - STELCO - REFER TO NOTES 1 AND 3 TO THE FINANCIAL STATEMENTS
Critical Audit Matter Description
The Company completed the acquisition of Stelco Holdings, Inc. on November 1, 2024. The Company accounted for the acquisition under the acquisition method of accounting for business combinations and accordingly, allocated the purchase price to the assets acquired and liabilities assumed based on their estimated fair values as of the date of acquisition. Identifiable intangible assets acquired included customer relationships intangible assets and trade names and trademarks intangible assets. The excess purchase consideration over the fair value of identifiable assets acquired and liabilities assumed was recorded as goodwill.
We identified the fair value determination of the customer relationship intangible assets for the business combination as a critical audit matter due to the significant judgment required in determining their estimated fair values. The determination of fair value requires management to make significant estimates and assumptions related to the forecasts of future revenues and EBITDA, as well as the selection of the discount rate. There was a high degree of auditor judgment and subjectivity in applying audit procedures and evaluating the significant assumptions relating to the estimates, including the need to involve our fair value specialists.
How the Critical Audit Matter Was Addressed in the Audit
Our audit procedures related to the forecasts and the selection of the discount rate included the following, among others:
•We tested the design and effectiveness of internal controls over the business combination, such as controls related to management’s forecasts and the selection of the discount rate.
•We evaluated the reasonableness of management’s forecasts by comparing the forecasts to Stelco’s historical results and forecasted information included in industry reports and companies in its peer group .
•With the assistance of our fair value specialists, we evaluated the discount rate, including testing the underlying source information and the mathematical accuracy of the calculations, and developing a range of independent estimates and comparing those to the discount rate selected by management.
•We evaluated whether management’s forecasts were consistent with evidence obtained in other areas of the audit.
/s/ DELOITTE & TOUCHE LLP
Cleveland, Ohio
February 25, 2025
We have served as the Company's auditor since 2004.
| | |
|
| ITEM 9. CHANGES IN AND DISAGREEMENTS WITH ACCOUNTANTS ON ACCOUNTING AND FINANCIAL DISCLOSURE |
None.
| | |
|
| ITEM 9A. CONTROLS AND PROCEDURES |
We maintain disclosure controls and procedures that are designed to ensure that information required to be disclosed in our Exchange Act reports is recorded, processed, summarized and reported within the time periods specified in the SEC’s rules and forms, and that such information is accumulated and communicated to our management, including our President and Chief Executive Officer and Chief Financial Officer, as appropriate, to allow timely decisions regarding required disclosure based solely on the definition of “disclosure controls and procedures” in Rule 13a-15(e) promulgated under the Exchange Act. In designing and evaluating the disclosure controls and procedures, management recognized that any controls and procedures, no matter how well designed and operated, can provide only reasonable assurance of achieving the desired control objectives, and management necessarily was required to apply its judgment in evaluating the cost-benefit relationship of possible controls and procedures.
As of the end of the period covered by this report, we carried out an evaluation under the supervision and with the participation of our management, including our President and Chief Executive Officer and our Chief Financial Officer, of the effectiveness of the design and operation of our disclosure controls and procedures. Based on the foregoing, our President and Chief Executive Officer and Chief Financial Officer concluded that our disclosure controls and procedures were effective.
MANAGEMENT'S REPORT ON INTERNAL CONTROL OVER FINANCIAL REPORTING
Our management is responsible for establishing and maintaining adequate internal control over financial reporting as such term is defined under Rule 13a-15(f) promulgated under the Exchange Act.
Internal control over financial reporting is a process designed to provide reasonable assurance regarding the reliability of financial reporting and the preparation of the Company's consolidated financial statements for external purposes in accordance with generally accepted accounting principles.
Internal control over financial reporting includes those policies and procedures that (i) pertain to the maintenance of records that, in reasonable detail, accurately and fairly reflect the transactions and dispositions of the assets of the Company; (ii) provide reasonable assurance that transactions are recorded as necessary to permit the preparation of the consolidated financial statements in accordance with generally accepted accounting principles, and that receipts and expenditures of the Company are being made only in accordance with appropriate authorizations of management and directors of the Company; and (iii) provide reasonable assurance regarding prevention or timely detection of unauthorized acquisition, use or disposition of the Company's assets that could have a material effect on the consolidated financial statements.
Because of its inherent limitations, internal control over financial reporting may not prevent or detect misstatements. Also, projections of any evaluation of effectiveness to future periods are subject to the risk that controls may become inadequate because of changes in conditions, or that the degree of compliance with the policies or procedures may deteriorate.
Management conducted an assessment of the Company's internal control over financial reporting as of December 31, 2024 using the framework specified in Internal Control - Integrated Framework (2013), published by the Committee of Sponsoring Organizations of the Treadway Commission. We have excluded from our assessment the internal control over financial reporting at Stelco, which was acquired on November 1, 2024, and whose assets as of December 31, 2024 constituted 20% of the Company’s consolidated total assets as of December 31, 2024, and whose revenues for the period from November 1, 2024 through December 31, 2024, inclusive, constituted 2% of the Company’s consolidated revenues for the year ended December 31, 2024.
Based on such assessment, management has concluded that the Company's internal control over financial reporting was effective as of December 31, 2024.
The effectiveness of the Company's internal control over financial reporting as of December 31, 2024 has been audited by Deloitte & Touche LLP (PCAOB ID No. 34), an independent registered public accounting firm, as stated in their report that appears herein.
February 25, 2025
CHANGES IN INTERNAL CONTROL OVER FINANCIAL REPORTING
There have been no changes in our internal control over financial reporting or in other factors that occurred during our last fiscal quarter that have materially affected, or are reasonably likely to materially affect, our internal control over financial reporting.
REPORT OF INDEPENDENT REGISTERED PUBLIC ACCOUNTING FIRM
To the shareholders and the Board of Directors of
Cleveland-Cliffs Inc.
OPINION ON INTERNAL CONTROL OVER FINANCIAL REPORTING
We have audited the internal control over financial reporting of Cleveland-Cliffs Inc. and subsidiaries (the "Company") as of December 31, 2024, based on criteria established in Internal Control — Integrated Framework (2013) issued by the Committee of Sponsoring Organizations of the Treadway Commission (COSO). In our opinion, the Company maintained, in all material respects, effective internal control over financial reporting as of December 31, 2024, based on criteria established in Internal Control — Integrated Framework (2013) issued by COSO.
We have also audited, in accordance with the standards of the Public Company Accounting Oversight Board (United States) (PCAOB), the consolidated financial statements as of and for the year ended December 31, 2024, of the Company and our report dated February 25, 2025, expressed an unqualified opinion on those financial statements.
As described in Management’s Report on Internal Control Over Financial Reporting, management excluded from its assessment the internal control over financial reporting at Stelco, which was acquired on November 1, 2024, and whose assets as of December 31, 2024 constituted 20% of the Company’s consolidated total assets as of December 31, 2024, and whose revenues for the period from November 1, 2024 through December 31, 2024, inclusive, constituted 2% of the Company’s consolidated revenues for the year ended December 31, 2024. Accordingly, our audit did not include the internal control over financial reporting at Stelco.
BASIS FOR OPINION
The Company’s management is responsible for maintaining effective internal control over financial reporting and for its assessment of the effectiveness of internal control over financial reporting, included in the accompanying Management’s Report on Internal Control Over Financial Reporting. Our responsibility is to express an opinion on the Company’s internal control over financial reporting based on our audit. We are a public accounting firm registered with the PCAOB and are required to be independent with respect to the Company in accordance with the U.S. federal securities laws and the applicable rules and regulations of the Securities and Exchange Commission and the PCAOB.
We conducted our audit in accordance with the standards of the PCAOB. Those standards require that we plan and perform the audit to obtain reasonable assurance about whether effective internal control over financial reporting was maintained in all material respects. Our audit included obtaining an understanding of internal control over financial reporting, assessing the risk that a material weakness exists, testing and evaluating the design and operating effectiveness of internal control based on the assessed risk, and performing such other procedures as we considered necessary in the circumstances. We believe that our audit provides a reasonable basis for our opinion.
DEFINITION AND LIMITATIONS OF INTERNAL CONTROL OVER FINANCIAL REPORTING
A company’s internal control over financial reporting is a process designed to provide reasonable assurance regarding the reliability of financial reporting and the preparation of financial statements for external purposes in accordance with generally accepted accounting principles. A company’s internal control over financial reporting includes those policies and procedures that (1) pertain to the maintenance of records that, in reasonable detail, accurately and fairly reflect the transactions and dispositions of the assets of the company; (2) provide reasonable assurance that transactions are recorded as necessary to permit preparation of financial statements in accordance with generally accepted accounting principles, and that receipts and expenditures of the company are being made only in accordance with authorizations of management and directors of the company; and (3) provide reasonable assurance regarding prevention or timely detection of unauthorized acquisition, use, or disposition of the company’s assets that could have a material effect on the financial statements.
Because of its inherent limitations, internal control over financial reporting may not prevent or detect misstatements. Also, projections of any evaluation of effectiveness to future periods are subject to the risk that controls may become inadequate because of changes in conditions, or that the degree of compliance with the policies or procedures may deteriorate.
/s/ DELOITTE & TOUCHE LLP
Cleveland, Ohio
February 25, 2025
| | |
|
| ITEM 9B. OTHER INFORMATION |
During the quarter ended December 31, 2024, no director or officer (as defined in Rule 16a-1(f) promulgated under the Exchange Act) of the Company adopted or terminated a "Rule 10b5-1 trading arrangement" or "non-Rule 10b5-1 trading arrangement" (as each term is defined in Item 408 of Regulation S-K).
| | |
|
| ITEM 9C. DISCLOSURE REGARDING FOREIGN JURISDICTIONS THAT PREVENT INSPECTIONS |
Not applicable.
PART III
| | |
|
| ITEM 10. DIRECTORS, EXECUTIVE OFFICERS AND CORPORATE GOVERNANCE |
The information required to be furnished by this Item will be set forth in the definitive proxy statement for our 2025 Annual Meeting of Shareholders (the "Proxy Statement") under the headings "Board Meetings and Committees — Audit Committee", "Code of Business Conduct and Ethics", "Insider Trading Policy", "Independence and Related Party Transactions" and "Information Concerning Director Nominees” and is incorporated herein by reference and made a part hereof from the Proxy Statement. The information regarding executive officers required by this Item is set forth in Part I - Item 1. Business hereof under the heading “Information About Our Executive Officers”, which information is incorporated herein by reference and made a part hereof.
| | |
|
| ITEM 11. EXECUTIVE COMPENSATION |
The information required to be furnished by this Item will be set forth in the Proxy Statement under the headings “Director Compensation”, "Compensation Discussion and Analysis", “Compensation Committee Report”, “Compensation Committee Interlocks and Insider Participation”, "Compensation-Related Risk Assessment" and “Executive Compensation” and is incorporated herein by reference and made a part hereof from the Proxy Statement.
| | |
|
| ITEM 12. SECURITY OWNERSHIP OF CERTAIN BENEFICIAL OWNERS AND MANAGEMENT AND RELATED STOCKHOLDER MATTERS |
The information required to be furnished by this Item will be set forth in the Proxy Statement under the headings "Ownership of Equity Securities of the Company" and "Equity Compensation Plan Information" and is incorporated herein by reference and made a part hereof from the Proxy Statement.
| | |
|
| ITEM 13. CERTAIN RELATIONSHIPS AND RELATED TRANSACTIONS, AND DIRECTOR INDEPENDENCE |
The information required to be furnished by this Item will be set forth in the Proxy Statement under the heading “Independence and Related Party Transactions” and is incorporated herein by reference and made a part hereof from the Proxy Statement.
| | |
|
| ITEM 14. PRINCIPAL ACCOUNTANT FEES AND SERVICES |
The information required to be furnished by this Item will be set forth in the Proxy Statement under the heading “Ratification of Independent Registered Public Accounting Firm” and is incorporated herein by reference and made a part hereof from the Proxy Statement.
PART IV
| | |
|
| ITEM 15. EXHIBITS AND FINANCIAL STATEMENT SCHEDULES |
(a)(1) - List of Financial Statements
The following consolidated financial statements of Cleveland-Cliffs Inc. are included at ITEM 8. FINANCIAL STATEMENTS AND SUPPLEMENTARY DATA above:
•Statements of Consolidated Financial Position - December 31, 2024 and 2023
•Statements of Consolidated Operations - Years ended December 31, 2024, 2023 and 2022
•Statements of Consolidated Comprehensive Income (Loss) - Years ended December 31, 2024, 2023 and 2022
•Statements of Consolidated Cash Flows - Years ended December 31, 2024, 2023 and 2022
•Statements of Consolidated Changes in Equity - Years ended December 31, 2024, 2023 and 2022
•Notes to Consolidated Financial Statements
(a)(2) - Financial Statement Schedules
All schedules for which provision is made in the applicable accounting regulation of the SEC are not required under the related instructions or are inapplicable, and therefore have been omitted or are contained in the applicable financial statements or the notes thereto.
(a)(3) List of Exhibits
All documents referenced below have been filed pursuant to the Securities Exchange Act of 1934 by Cleveland-Cliffs Inc., file number 1-09844, unless otherwise indicated.
| | | | | |
| Exhibit Number | Exhibit |
| Plan of acquisition, reorganization, arrangement, liquidation or succession |
| ** Arrangement Agreement, dated as of July 14, 2024, by and between Stelco Holdings Inc., 13421422 Canada Inc. and Cleveland-Cliffs Inc. (filed as Exhibit 2.1 to Cliffs' Form 10-Q for the period ended June 30, 2024 and incorporated herein by reference). |
| Articles of Incorporation and Regulations of Cleveland-Cliffs Inc. |
| Fourth Amended Articles of Incorporation of Cliffs, as filed with the Secretary of State of the State of Ohio on September 25, 2020 (filed as Exhibit 3.2 to Cliffs’ Form 8-K on September 28, 2020 and incorporated herein by reference). |
| Certificate of Amendment to Fourth Amended Articles of Incorporation of Cliffs, as filed with the Secretary of State of the State of Ohio on December 7, 2020 (filed as Exhibit 3.1 to Cliffs' Form 8-K on December 9, 2020 and incorporated herein by reference). |
| Certificate of Amendment to Fourth Amended Articles of Incorporation of Cliffs, as amended, as filed with the Secretary of State of the State of Ohio on April 29, 2021 (filed as Exhibit 3.1 to Cliffs' Form 8-K on April 30, 2021 and incorporated herein by reference). |
| Regulations of Cliffs (filed as Exhibit 3.2 to Cliffs’ Form 10-K for the period ended December 31, 2011 and incorporated herein by reference). |
| Instruments defining rights of security holders, including indentures |
| Indenture, dated as of March 17, 2010, between Cliffs Natural Resources Inc. (n/k/a Cleveland-Cliffs Inc.) and U.S. Bank National Association, as trustee (filed as Exhibit 4.3 to Cliffs’ Registration Statement on Form S-3 (Registration No. 333-186617) on February 12, 2013 and incorporated herein by reference). |
| Third Supplemental Indenture, dated as of September 20, 2010, between Cliffs Natural Resources Inc. (n/k/a Cleveland-Cliffs Inc.) and U.S. Bank National Association, as trustee, including Form of 6.25% Notes due 2040 (filed as Exhibit 4.4 to Cliffs’ Form 8-K on September 17, 2010 and incorporated herein by reference). |
| Fifth Supplemental Indenture, dated as of March 31, 2011, between Cliffs Natural Resources Inc. (n/k/a Cleveland-Cliffs Inc.) and U.S. Bank National Association, as trustee (filed as Exhibit 4(b) to Cliffs’ Form 10-Q for the period ended June 30, 2011 and incorporated herein by reference). |
| Seventh Supplemental Indenture, dated as of May 7, 2013, between Cliffs Natural Resources Inc. (n/k/a Cleveland-Cliffs Inc.) and U.S. Bank National Association, as trustee (filed as Exhibit 4.1 to Cliffs' Form 10-Q for the period ended June 30, 2013 and incorporated herein by reference). |
| | | | | |
| Exhibit Number | Exhibit |
| Indenture, dated as of May 13, 2019, among Cleveland-Cliffs Inc., the Guarantors party thereto and U.S. Bank National Association, as trustee, including Form of 5.875% Senior Notes due 2027 (filed as Exhibit 4.1 to Cliffs' Form 8-K on May 14, 2019 and incorporated herein by reference). |
| First Supplemental Indenture, dated as of March 13, 2020, among Cleveland-Cliffs Inc., the Additional Guarantors party thereto and U.S. Bank National Association, as trustee (filed as Exhibit 4.4 to Cliffs' Form 10-Q for the period ended March 31, 2020 and incorporated herein by reference). |
| Second Supplemental Indenture, dated as of May 22, 2020, among Cleveland-Cliffs Inc., the Additional Guarantors party thereto and U.S. Bank National Association, as trustee (filed as Exhibit 4.6 to Cliffs’ Form 10-Q for the period ended June 30, 2020 and incorporated herein by reference). |
| Third Supplemental Indenture, dated as of December 9, 2020, among Cleveland-Cliffs Inc., the Additional Guarantors party thereto and U.S. Bank National Association, as trustee (filed as Exhibit 4.24 to Cliffs’ Form 10-K for the period ended December 31, 2020 and incorporated herein by reference). |
| Fourth Supplemental Indenture, dated as of December 18, 2020, among Cleveland-Cliffs Inc., the Additional Guarantors party thereto and U.S. Bank National Association, as trustee (filed as Exhibit 4.25 to Cliffs’ Form 10-K for the period ended December 31, 2020 and incorporated herein by reference). |
| Fifth Supplemental Indenture, dated as of December 22, 2021, among Cleveland-Cliffs Inc., the Additional Guarantor party thereto and U.S. Bank National Association, as trustee (filed as Exhibit 4.11 to Cliffs’ Form 10-K for the period ended December 31, 2021 and incorporated herein by reference). |
| Sixth Supplemental Indenture, dated as of July 31, 2023, among Cleveland-Cliffs Inc., the Additional Guarantors party thereto and U.S. Bank Trust Company, National Association (successor in interest to U.S. Bank National Association), as trustee (filed as Exhibit 4.1 to Cliffs' Form 10-Q for the period ended September 30, 2023 and incorporated herein by reference). |
| Indenture, dated as of March 16, 2020, among Cleveland-Cliffs Inc., the Guarantors party thereto and U.S. Bank National Association, as trustee, including Form of 7.00% Senior Notes due 2027 (filed as Exhibit 4.7 to Cliffs’ Form 10-Q for the period ended March 31, 2020 and incorporated herein by reference). |
| First Supplemental Indenture, dated as of May 22, 2020, among Cleveland-Cliffs Inc., the Additional Guarantors party thereto and U.S. Bank National Association, as trustee (filed as Exhibit 4.7 to Cliffs’ Form 10-Q for the period ended June 30, 2020 and incorporated herein by reference). |
| Second Supplemental Indenture, dated as of December 9, 2020, among Cleveland-Cliffs Inc., the Additional Guarantors party thereto and U.S. Bank National Association, as trustee (filed as Exhibit 4.38 to Cliffs’ Form 10-K for the period ended December 31, 2020 and incorporated herein by reference). |
| Third Supplemental Indenture, dated as of December 18, 2020, among Cleveland-Cliffs Inc., the Additional Guarantors party thereto and U.S. Bank National Association, as trustee (filed as Exhibit 4.39 to Cliffs’ Form 10-K for the period ended December 31, 2020 and incorporated herein by reference). |
| Fourth Supplemental Indenture, dated as of December 22, 2021, among Cleveland-Cliffs Inc., the Additional Guarantor party thereto and U.S. Bank National Association, as trustee (filed as Exhibit 4.22 to Cliffs’ Form 10-K for the period ended December 31, 2021 and incorporated herein by reference). |
| Fifth Supplemental Indenture, dated as of July 31, 2023, among Cleveland-Cliffs Inc., the Additional Guarantors party thereto and U.S. Bank Trust Company, National Association (successor in interest to U.S. Bank National Association), as trustee (filed as Exhibit 4.3 to Cliffs' Form 10-Q for the period ended September 30, 2023 and incorporated herein by reference). |
| Indenture, dated as of February 17, 2021, among Cleveland-Cliffs Inc., the Guarantors party thereto and U.S. Bank National Association, as trustee, including Forms of 4.625% Senior Notes due 2029 and 4.875% Senior Notes due 2031 (filed as Exhibit 4.1 to Cliffs' Form 10-Q for the period ended March 31, 2021 and incorporated herein by reference). |
| First Supplemental Indenture, dated as of December 22, 2021, among Cleveland-Cliffs Inc., the Additional Guarantor party thereto and U.S. Bank National Association, as trustee (filed as Exhibit 4.30 to Cliffs’ Form 10-K for the period ended December 31, 2021 and incorporated herein by reference). |
| Second Supplemental Indenture, dated as of July 31, 2023, among Cleveland-Cliffs Inc., the Additional Guarantors party thereto and U.S. Bank Trust Company, National Association (successor in interest to U.S. Bank National Association), as trustee (filed as Exhibit 4.4 to Cliffs' Form 10-Q for the period ended September 30, 2023 and incorporated herein by reference). |
| Indenture, dated as of April 14, 2023, among Cleveland-Cliffs Inc., the Guarantors party thereto and U.S. Bank Trust Company, National Association, as trustee, including Form of 6.750% Senior Notes due 2030 (filed as Exhibit 4.1 to Cliffs' Form 10-Q for the period ended June 30, 2023 and incorporated herein by reference). |
| First Supplemental Indenture, dated as of July 31, 2023, among Cleveland-Cliffs Inc., the Additional Guarantors party thereto and U.S. Bank Trust Company, National Association, as trustee (filed as Exhibit 4.5 to Cliffs' Form 10-Q for the period ended September 30, 2023 and incorporated herein by reference). |
| | | | | |
| Exhibit Number | Exhibit |
| Indenture, dated as of March 18, 2024, among Cleveland-Cliffs Inc., the Guarantors party thereto and U.S. Bank Trust Company, National Association, as trustee, including Form of 7.000% Senior Notes due 2032 (filed as Exhibit 4.1 to Cliffs' Form 10-Q for the period ended March 31, 2024 and incorporated herein by reference). |
| First Supplemental Indenture, dated as of August 16, 2024, among Cleveland-Cliffs Inc., the Guarantors party thereto and U.S. Bank Trust Company, National Association, as trustee (filed as Exhibit 4.1 to Cliffs' Form 10-Q for the period ended September 30, 2024 and incorporated herein by reference). |
| Indenture, dated as of October 22, 2024, among Cleveland-Cliffs Inc., the Guarantors party thereto and U.S. Bank Trust Company, National Association, as trustee, including Forms of 6.875% Senior Notes due 2029 and 7.375% Senior Notes due 2033 (filed as Exhibit 4.2 to Cliffs' Form 10-Q for the period ended September 30, 2024 and incorporated herein by reference). |
| Form of Common Share Certificate (filed as Exhibit 4.1 to Cliffs’ Form 10-Q for the period ended September 30, 2019 and incorporated herein by reference). |
| Description of Securities Registered under Section 12 of the Securities Exchange Act of 1934 (filed as Exhibit 4.25 to Cliffs’ Form 10-K for the period ended December 31, 2022 and incorporated herein by reference). |
| Material contracts |
| * Form of 2014 Change in Control Severance Agreement (filed as Exhibit 10.4 to Cliffs’ Form 8-K/A on September 16, 2014 and incorporated herein by reference). |
| * Form of 2016 Change in Control Severance Agreement (filed as Exhibit 10.1 to Cliffs’ Form 10-Q for the period ended September 30, 2016 and incorporated herein by reference). |
| * Cleveland-Cliffs Inc. 2012 Non-Qualified Deferred Compensation Plan (Amended and Restated effective as of July 24, 2024) (filed as Exhibit 10.1 to Cliffs’ Form 10-Q for the period ended September 30, 2024 and incorporated herein by reference). |
| * Form of Director and Officer Indemnification Agreement between Cleveland-Cliffs Inc. and Directors and Officers (filed as Exhibit 10.2 to Cliffs’ Form 10-Q for the period ended March 31, 2019 and incorporated herein by reference). |
| * Cleveland-Cliffs Inc. 2021 Nonemployee Directors’ Compensation Plan (filed as Exhibit 10.2 to Cliffs’ Form 8-K on April 30, 2021 and incorporated herein by reference). |
| * Form of Restricted Shares Agreement for Nonemployee Directors (filed as Exhibit 10.1 to Cliffs’ Form 10-Q for the period ended June 30, 2023 and incorporated herein by reference). |
| * Form of Deferred Shares Agreement for Nonemployee Directors (filed as Exhibit 10.2 to Cliffs’ Form 10-Q for the period ended June 30, 2023 and incorporated herein by reference). |
| * Trust Agreement No. 1 (Amended and Restated effective June 1, 1997), dated June 12, 1997, by and between Cleveland-Cliffs Inc and KeyBank National Association, Trustee, with respect to the Cleveland-Cliffs Inc Supplemental Retirement Benefit Plan, Severance Pay Plan for Key Employees and certain executive agreements (filed as Exhibit 10.10 to Cliffs’ Form 10-K for the period ended December 31, 2011 and incorporated herein by reference). |
| * Trust Agreement No. 1 Amendments to Exhibits, effective as of January 1, 2000, by and between Cleveland-Cliffs Inc and KeyBank National Association, as Trustee (filed as Exhibit 10.11 to Cliffs’ Form 10-K for the period ended December 31, 2011 and incorporated herein by reference). |
| * First Amendment to Trust Agreement No. 1, effective September 10, 2002, by and between Cleveland-Cliffs Inc and KeyBank National Association, as Trustee (filed as Exhibit 10.12 to Cliffs’ Form 10-K for the period ended December 31, 2011 and incorporated herein by reference). |
| * Second Amendment to Trust Agreement No. 1 between Cliffs Natural Resources Inc. (f/k/a Cleveland-Cliffs Inc) and KeyBank National Association, Trustee, entered into and effective as of December 31, 2008 (filed as Exhibit 10(y) to Cliffs’ Form 10-K for the period ended December 31, 2008 and incorporated herein by reference). |
| * Third Amendment to Trust Agreement No. 1 between Cliffs Natural Resources Inc. (f/k/a Cleveland-Cliffs Inc) and KeyBank National Association, Trustee, entered into and effective as of July 28, 2014 (filed as Exhibit 10.15 to Cliffs’ Form 10-K for the period ended December 31, 2014 and incorporated herein by reference). |
| * Amended and Restated Trust Agreement No. 2, effective as of October 15, 2002, by and between Cleveland-Cliffs Inc and KeyBank National Association, Trustee, with respect to Executive Agreements and Indemnification Agreements with the Company’s Directors and certain Officers, the Company’s Severance Pay Plan for Key Employees, and the Retention Plan for Salaried Employees (filed as Exhibit 10.14 to Cliffs’ Form 10-K for the period ended December 31, 2011 and incorporated herein by reference). |
| * Second Amendment to Amended and Restated Trust Agreement No. 2 between Cliffs Natural Resources Inc. (f/k/a Cleveland-Cliffs Inc) and KeyBank National Association, Trustee, entered into and effective as of December 31, 2008 (filed as Exhibit 10(aa) to Cliffs’ Form 10-K for the period ended December 31, 2008 and incorporated herein by reference). |
| | | | | |
| Exhibit Number | Exhibit |
| * Third Amendment to Amended and Restated Trust Agreement No. 2 between Cliffs Natural Resources Inc. (f/k/a Cleveland-Cliffs Inc) and KeyBank National Association, Trustee, entered into and effective as of July 28, 2014 (filed as Exhibit 10.18 to Cliffs’ Form 10-K for the period ended December 31, 2014 and incorporated herein by reference). |
| * Trust Agreement No. 7, dated as of April 9, 1991, by and between Cleveland-Cliffs Inc and KeyBank National Association, Trustee, with respect to the Cleveland-Cliffs Inc Supplemental Retirement Benefit Plan (filed as Exhibit 10.23 to Cliffs’ Form 10-K for the period ended December 31, 2011 and incorporated herein by reference). |
| * First Amendment to Trust Agreement No. 7, by and between Cleveland-Cliffs Inc and KeyBank National Association, Trustee, dated as of March 9, 1992 (filed as Exhibit 10.24 to Cliffs’ Form 10-K for the period ended December 31, 2011 and incorporated herein by reference). |
| * Second Amendment to Trust Agreement No. 7, dated November 18, 1994, by and between Cleveland-Cliffs Inc and KeyBank National Association, Trustee (filed as Exhibit 10.25 to Cliffs’ Form 10-K for the period ended December 31, 2011 and incorporated herein by reference). |
| * Third Amendment to Trust Agreement No. 7, dated May 23, 1997, by and between Cleveland-Cliffs Inc and KeyBank National Association, Trustee (filed as Exhibit 10.26 to Cliffs’ Form 10-K for the period ended December 31, 2011 and incorporated herein by reference). |
| * Fourth Amendment to Trust Agreement No. 7, dated July 15, 1997, by and between Cleveland-Cliffs Inc and KeyBank National Association, Trustee (filed as Exhibit 10.27 to Cliffs’ Form 10-K for the period ended December 31, 2011 and incorporated herein by reference). |
| * Amendment to Exhibits to Trust Agreement No. 7, effective as of January 1, 2000, by and between Cleveland-Cliffs Inc and KeyBank National Association, Trustee (filed as Exhibit 10.28 to Cliffs’ Form 10-K for the period ended December 31, 2011 and incorporated herein by reference). |
| * Sixth Amendment to Trust Agreement No. 7 between Cliffs Natural Resources Inc. (f/k/a Cleveland-Cliffs Inc) and KeyBank National Association, Trustee, entered into and effective as of December 31, 2008 (filed as Exhibit 10(oo) to Cliffs’ Form 10-K for the period ended December 31, 2008 and incorporated herein by reference). |
| * Seventh Amendment to Trust Agreement No. 7 between Cliffs Natural Resources Inc. (f/k/a Cleveland-Cliffs Inc) and KeyBank National Association, Trustee, entered into and effective as of July 28, 2014 (filed as Exhibit 10.34 to Cliffs’ Form 10-K for the period ended December 31, 2014 and incorporated herein by reference). |
| * Trust Agreement No. 10, dated as of November 20, 1996, by and between Cleveland-Cliffs Inc and KeyBank National Association, Trustee, with respect to the Cleveland-Cliffs Inc Nonemployee Directors’ Compensation Plan (filed as Exhibit 10.36 to Cliffs’ Form 10-K for the period ended December 31, 2011 and incorporated herein by reference). |
| * First Amendment to Trust Agreement No. 10 between Cliffs Natural Resources Inc. (f/k/a Cleveland-Cliffs Inc) and KeyBank National Association, Trustee, entered into and effective as of December 31, 2008 (filed as Exhibit 10(ww) to Cliffs’ Form 10-K for the period ended February 26, 2009 and incorporated herein by reference). |
| * Second Amendment to Trust Agreement No. 10 between Cliffs Natural Resources Inc. (f/k/a Cleveland-Cliffs Inc) and KeyBank National Association, Trustee, entered into and effective as of July 28, 2014 (filed as Exhibit 10.45 to Cliffs’ Form 10-K for the period ended December 31, 2014 and incorporated herein by reference). |
| * Letter Agreement, by and between Lourenco Goncalves and Cliffs Natural Resources Inc., signed as of September 11, 2014 (filed as Exhibit 10.1 to Cliffs’ Form 8-K/A on September 16, 2014 and incorporated herein by reference). |
| * Cleveland-Cliffs Inc and Subsidiaries Management Performance Incentive Plan Summary, effective January 1, 2004 (filed as Exhibit 10.47 to Cliffs’ Form 10-K for the period ended December 31, 2011 and incorporated herein by reference). |
| * Cliffs Natural Resources Inc. 2017 Executive Management Performance Incentive Plan effective January 1, 2017 (filed as Exhibit 10.2 to Cliffs' Form 8-K on April 27, 2017 and incorporated herein by reference). |
| * Cliffs Natural Resources Inc. Amended and Restated 2015 Equity and Incentive Compensation Plan (filed as Exhibit 10.1 to Cliffs’ Form 8-K on April 27, 2017 and incorporated herein by reference). |
| * Cleveland-Cliffs Inc. 2021 Equity and Incentive Compensation Plan (filed as Exhibit 10.1 to Cliffs’ Form 8-K on April 30, 2021 and incorporated herein by reference). |
| * Form of Cleveland-Cliffs Inc. 2021 Equity and Incentive Compensation Plan Restricted Stock Unit Award Memorandum and Restricted Stock Unit Award Agreement (filed as Exhibit 10.1 to Cliffs’ Form 10-Q for the period ended March 31, 2023 and incorporated herein by reference). |
| * Form of Cleveland-Cliffs Inc. 2021 Equity and Incentive Compensation Plan Performance Share Award Memorandum (TSR) and Performance Share Award Agreement (filed as Exhibit 10.2 to Cliffs’ Form 10-Q for the period ended March 31, 2023 and incorporated herein by reference). |
| | | | | |
| Exhibit Number | Exhibit |
| * Form of Cleveland-Cliffs Inc. 2021 Equity and Incentive Compensation Plan Cash Incentive Award Memorandum (TSR) and Cash Incentive Award Agreement (TSR) (filed as Exhibit 10.3 to Cliffs’ Form 10-Q for the period ended March 31, 2023 and incorporated herein by reference). |
| * Form of Cleveland-Cliffs Inc. 2021 Equity and Incentive Compensation Plan Restricted Stock Unit Award Memorandum and Restricted Stock Unit Award Agreement (filed as Exhibit 10.1 to Cliffs’ Form 10-Q for the period ended March 31, 2024 and incorporated herein by reference). |
| * Form of Cleveland-Cliffs Inc. 2021 Equity and Incentive Compensation Plan Performance Share Award Memorandum (TSR) and Performance Share Award Agreement (filed as Exhibit 10.2 to Cliffs’ Form 10-Q for the period ended March 31, 2024 and incorporated herein by reference). |
| * Form of Cleveland-Cliffs Inc. 2021 Equity and Incentive Compensation Plan Cash Incentive Award Memorandum (TSR) and Cash Incentive Award Agreement (TSR) (filed as Exhibit 10.3 to Cliffs’ Form 10-Q for the period ended March 31, 2024 and incorporated herein by reference). |
| * Cleveland-Cliffs Inc. Supplemental Retirement Benefit Plan (as Amended and Restated effective October 26, 2021) (filed as Exhibit 10.40 to Cliffs’ Form 10-K for the period ended December 31, 2021 and incorporated herein by reference). |
| * Amendment No. 1 to Cleveland-Cliffs Inc. Supplemental Retirement Benefit Plan, dated December 14, 2023 (filed as Exhibit 10.42 to Cliffs’ Form 10-K for the period ended December 31, 2023 and incorporated herein by reference). |
| Asset-Based Revolving Credit Agreement, dated as of March 13, 2020, among Cleveland-Cliffs Inc., the lenders party thereto from time to time and Bank of America, N.A., as administrative agent (filed as Exhibit 10.1 to Cliffs’ Form 10-Q for the period ended March 31, 2020 and incorporated herein by reference). |
| First Amendment to Asset-Based Revolving Credit Agreement, dated as of March 27, 2020, among Cleveland-Cliffs Inc., the lenders party thereto from time to time and Bank of America, N.A., as administrative agent (filed as Exhibit 10.2 to Cliffs’ Form 10-Q for the period ended March 31, 2020 and incorporated herein by reference). |
| Second Amendment to Asset-Based Revolving Credit Agreement, dated as of December 9, 2020, among Cleveland-Cliffs Inc., the lenders party thereto from time to time and Bank of America, N.A., as administrative agent (filed as Exhibit 10.42 to Cliffs’ Form 10-K for the period ended December 31, 2020 and incorporated herein by reference). |
| Third Amendment to Asset-Based Revolving Credit Agreement, dated as of December 17, 2021, among Cleveland-Cliffs Inc., the lenders party thereto from time to time and Bank of America, N.A., as administrative agent (filed as Exhibit 10.1 to Cliffs’ Form 8-K on December 23, 2021 and incorporated herein by reference). |
| Fourth Amendment to Asset-Based Revolving Credit Agreement, dated as of June 9, 2023, among Cleveland-Cliffs Inc., the lenders party thereto from time to time and Bank of America, N.A., as administrative agent (filed as Exhibit 10.3 to Cliffs’ Form 10-Q for the period ended June 30, 2023 and incorporated herein by reference). |
| Fifth Amendment to Asset-Based Revolving Credit Agreement, dated as of July 31, 2024, among Cleveland-Cliffs Inc., the lenders party thereto from time to time and Bank of America, N.A., as administrative agent (filed as Exhibit 10.2 to Cliffs’ Form 10-Q for the period ended September 30, 2024 and incorporated herein by reference). |
| Sixth Amendment to Asset-Based Revolving Credit Agreement, dated as of September 13, 2024, among Cleveland-Cliffs Inc., the lenders party thereto from time to time and Bank of America, N.A., as administrative agent (filed as Exhibit 10.3 to Cliffs’ Form 10-Q for the period ended September 30, 2024 and incorporated herein by reference). |
| Cleveland-Cliffs Inc. and Associated Companies Insider Trading and Material Inside Information Policy effective October 25, 2023 (filed herewith). |
| Subsidiaries of the Registrant (filed herewith). |
| Schedule of the obligated group, including the parent and issuer and the subsidiary guarantors that have guaranteed the obligations under the 5.875% 2027 Senior Notes, the 7.000% 2027 Senior Notes, the 4.625% 2029 Senior Notes, the 6.875% 2029 Senior Notes, the 6.750% 2030 Senior Notes, the 4.875% 2031 Senior Notes, the 7.000% 2032 Senior Notes and the 7.375% 2033 Senior Notes issued by Cleveland-Cliffs Inc. (filed herewith). |
| Consent of Independent Registered Public Accounting Firm (filed herewith). |
| Consent of SLR International Corporation regarding Hibbing Taconite Property, Minnesota, USA (filed herewith). |
| Consent of SLR International Corporation regarding Minorca Property, Minnesota, USA (filed herewith). |
| Consent of SLR International Corporation regarding Northshore Property, Minnesota, USA (filed herewith). |
| Consent of SLR International Corporation regarding United Taconite Property, Minnesota, USA (filed herewith). |
| Consent of SLR International Corporation regarding Tilden Property, Michigan, USA (filed herewith). |
| Power of Attorney (filed herewith). |
| Certification Pursuant to 15 U.S.C. Section 7241, as Adopted Pursuant to Section 302 of the Sarbanes-Oxley Act of 2002, signed and dated by Lourenco Goncalves as of February 25, 2025 (filed herewith). |
| Certification Pursuant to 15 U.S.C. Section 7241, as Adopted Pursuant to Section 302 of the Sarbanes-Oxley Act of 2002, signed and dated by Celso L. Goncalves Jr. as of February 25, 2025 (filed herewith). |
| | | | | |
| Exhibit Number | Exhibit |
| Certification Pursuant to 18 U.S.C. Section 1350, as Adopted Pursuant to Section 906 of the Sarbanes-Oxley Act of 2002, signed and dated by Lourenco Goncalves, Chairman, President and Chief Executive Officer of Cleveland-Cliffs Inc., as of February 25, 2025 (filed herewith). |
| Certification Pursuant to 18 U.S.C. Section 1350, as Adopted Pursuant to Section 906 of the Sarbanes-Oxley Act of 2002, signed and dated by Celso L. Goncalves Jr., Executive Vice President, Chief Financial Officer of Cleveland-Cliffs Inc., as of February 25, 2025 (filed herewith). |
| Mine Safety Disclosures (filed herewith). |
| Technical Report Summary on the Hibbing Taconite Property, Minnesota, USA, prepared for the Company by SLR International Corporation with an effective date of December 31, 2021 (filed as Exhibit 96.1 to Cliffs’ Form 8-K on February 11, 2022 and incorporated herein by reference). |
| Technical Report Summary on the Minorca Property, Minnesota, USA, prepared for the Company by SLR International Corporation with an effective date of December 31, 2021 (filed as Exhibit 96.2 to Cliffs’ Form 8-K on February 11, 2022 and incorporated herein by reference). |
| Technical Report Summary on the Northshore Property, Minnesota, USA, prepared for the Company by SLR International Corporation with an effective date of December 31, 2021 (filed as Exhibit 96.3 to Cliffs’ Form 8-K on February 11, 2022 and incorporated herein by reference). |
| Technical Report Summary on the United Taconite Property, Minnesota, USA, prepared for the Company by SLR International Corporation with an effective date of December 31, 2021 (filed as Exhibit 96.4 to Cliffs’ Form 8-K on February 11, 2022 and incorporated herein by reference). |
| Technical Report Summary on the Tilden Property, Michigan, USA, prepared for the Company by SLR International Corporation with an effective date of December 31, 2021 (filed as Exhibit 96.5 to Cliffs’ Form 10-K for the period ended December 31, 2021 and incorporated herein by reference). |
| Cleveland-Cliffs Inc. Compensation Clawback Policy, effective October 2, 2023 (filed as Exhibit 97 to Cliffs’ Form 10-K for the period ended December 31, 2023 and incorporated herein by reference). |
| 101 | The following financial information from Cleveland-Cliffs Inc.'s Annual Report on Form 10-K for the year ended December 31, 2024 formatted in Inline XBRL (Extensible Business Reporting Language) includes: (i) the Statements of Consolidated Financial Position, (ii) the Statements of Consolidated Operations, (iii) the Statements of Consolidated Comprehensive Income, (iv) the Statements of Consolidated Cash Flows, (v) the Statements of Consolidated Changes in Equity, and (vi) Notes to the Consolidated Financial Statements. |
| 104 | The cover page from this Annual Report on Form 10-K, formatted in Inline XBRL. |
| |
| * | Indicates management contract or other compensatory arrangement. |
| ** | Certain immaterial schedules and exhibits to this exhibit have been omitted pursuant to the provisions of Regulation S-K, Item 601(a)(5). A copy of any of the omitted schedules and exhibits will be furnished to the U.S. Securities and Exchange Commission upon request. |
| | |
|
| ITEM 16. FORM 10-K SUMMARY |
None.
SIGNATURES
Pursuant to the requirements of Section 13 or 15(d) of the Securities Exchange Act of 1934, the registrant has duly caused this report to be signed on its behalf by the undersigned, thereunto duly authorized.
| | | | | | | | | | | | | | | | | | | | |
| | | CLEVELAND-CLIFFS INC. |
| | | | |
| | | By: | | /s/ K. A. Floriani |
| | | | | Name: | Kimberly A. Floriani |
| | | | | Title: | Senior Vice President, Controller &
Chief Accounting Officer |
| Date: | February 25, 2025 | | | | | |
Pursuant to the requirements of the Securities Exchange Act of 1934, this report has been signed below by the following persons on behalf of the registrant and in the capacities and on the dates indicated.
| | | | | | | | | | | | | | | | | |
| Signatures | Title | Date |
| | |
| /s/ L. Goncalves | Chairman, President and
Chief Executive Officer
(Principal Executive Officer) | February 25, 2025 |
| L. Goncalves |
|
| /s/ C. L. Goncalves Jr. | Executive Vice President,
Chief Financial Officer
(Principal Financial Officer) | February 25, 2025 |
| C. L. Goncalves Jr. |
|
| /s/ K. A. Floriani | Senior Vice President, Controller
& Chief Accounting Officer
(Principal Accounting Officer) | February 25, 2025 |
| K. A. Floriani |
|
| * | Director | February 25, 2025 |
| J. T. Baldwin |
| * | Director | February 25, 2025 |
| R. A. Bloom |
| Director | |
| J. M. Cronin |
| * | Director | February 25, 2025 |
| S. M. Green |
| * | Director | February 25, 2025 |
| R. S. Michael, III |
| * | Director | February 25, 2025 |
| B. Oren |
| * | Director | February 25, 2025 |
| G. Stoliar |
| * | Director | February 25, 2025 |
| D. C. Taylor |
| * | Director | February 25, 2025 |
| A. M. Yocum |
* The undersigned, by signing his name hereto, does sign and execute this Annual Report on Form 10-K pursuant to a Power of Attorney executed on behalf of the above-indicated directors of the registrant and filed herewith as Exhibit 24 on behalf of the registrant.
| | | | | |
| By: | /s/ C. L. Goncalves Jr. |
| (C. L. Goncalves Jr., as Attorney-in-Fact) |