 Technical Report Summary on the Northshore Property, Minnesota, USA
S-K 1300 ReportCleveland-Cliffs Inc.
SLR Project No: 138.02467.00001
February 7, 2022
Effective Date: December 31, 2021
Technical Report Summary on the Northshore Property, Minnesota, USA
SLR Project No: 138.02467.00001
Prepared by
SLR International Corporation
1658 Cole Blvd, Suite 100
Lakewood, CO 80401
for
Cleveland-Cliffs Inc.
200 Public Square, Suite 3300
Cleveland, OH 44114-2544
USA
Effective Date – December 31, 2021
Signature Date - February 7, 2022
Distribution: 1 copy – Cleveland-Cliffs Inc.
1 copy – SLR International Corporation
CONTENTS
| | | | | |
| |
| |
| |
| |
| |
| |
| |
| |
| |
| |
| |
| |
| |
| |
| |
| |
| |
| |
| |
| |
| |
| |
| |
| |
| |
| |
| |
| |
6.3 Property Geology | 40 |
6.4 Mineralization | 40 |
6.5 Deposit Types | 42 |
| |
| |
| |
7.3 Hydrogeology and Geotechnical Data | 48 |

Cleveland-Cliffs Inc. | Northshore Property, SLR Project No: 138.02467.00001Technical Report Summary - February 7, 2022 i
| | | | | |
| |
| |
| |
| |
| |
| |
| |
| |
| |
| |
| |
| |
| |
| |
| |
11.4 Resource Assays | 68 |
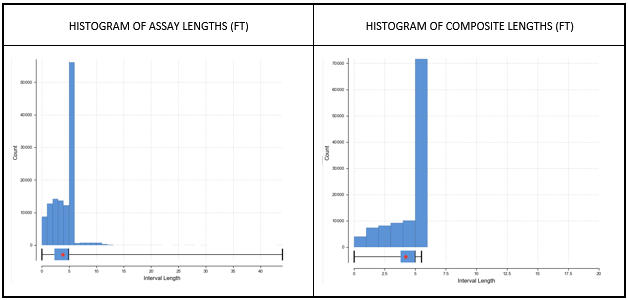
11.5 Compositing and Capping | 69 |
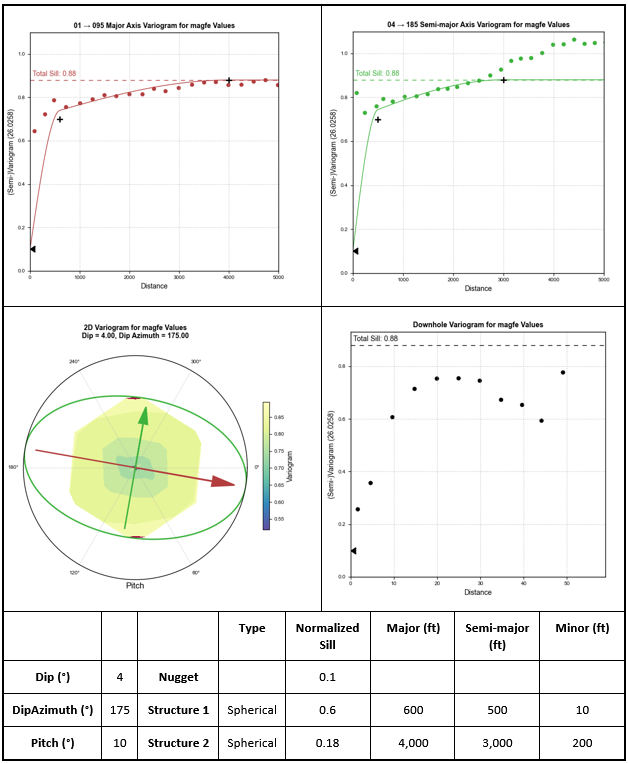
11.6 Trend Analysis | 71 |
11.7 Block Model | 73 |
11.8 Estimation Methodology | 73 |
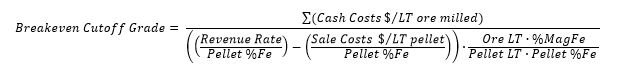
11.9 Cut-Off Grade | 76 |
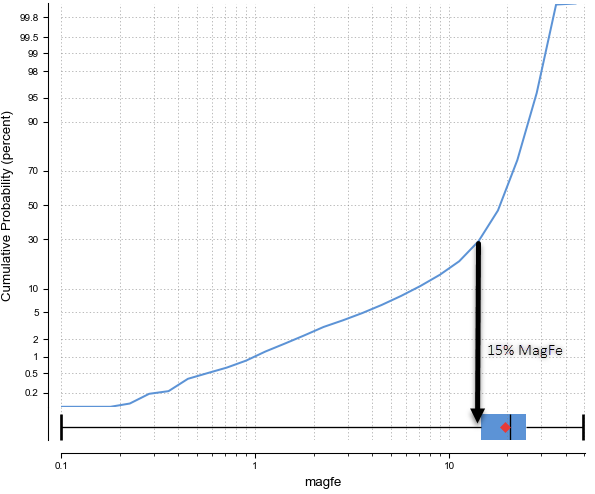
11.10 Classification | 77 |
11.11 Model Validation | 80 |
11.12 Model Reconciliation | 84 |
11.13 Mineral Resource Statement | 86 |
| |
| |
| |
| |
| |
| |
| |
| |
| |
| |
13.4 Production Schedule | 106 |
13.5 Overburden and Waste Rock Stockpiles | 108 |
Cleveland-Cliffs Inc. | Northshore Property, SLR Project No: 138.02467.00001Technical Report Summary - February 7, 2022 ii
| | | | | |
13.6 Mining Fleet | 111 |
13.7 Mine Workforce | 112 |
| |
| |
| |
14.3 Pellet Plant | 118 |
14.4 Major Equipment | 121 |
14.5 Plant Performance | 122 |
14.6 Pellet Quality | 122 |
14.7 Consumable Requirements | 124 |
14.8 Process Workforce | 125 |
| |
| |
| |
| |
| |
| |
| |
| |
| |
| |
| |
| |
| |
| |
| |
| |
| |
| |
| |
| |
| |
| |
| |
| |
| |
Cleveland-Cliffs Inc. | Northshore Property, SLR Project No: 138.02467.00001Technical Report Summary - February 7, 2022 iii
Cleveland-Cliffs Inc. | Northshore Property, SLR Project No: 138.02467.00001Technical Report Summary - February 7, 2022 iv
TABLES
| | | | | |
| |
| |
| |
| 6 |
| |
| |
| |
| |
| |
| |
| |
| |
| |
Table 6-1: Thickness of Biwabik IF Members | 41 |
Table 6-2: Characteristics of Main Mineralized Subunits at the Peter Mitchell Mine | 41 |
| |
| |
| |
| |
| |
Table 11-3: Assay Statistics of Mineralized Stratigraphic Domains | 68 |
Table 11-4: Composite Statistics of Mineralized Stratigraphic Domains | 69 |
Table 11-5: Block Model Parameters | 73 |
Table 11-6: Estimation Parameters | 74 |
Table 11-7: Block Model Material Type Designation | 74 |
Table 11-8: Density by Lithology | 75 |
Table 11-9: Northshore Classification Criteria | 77 |
Table 11-10: MagFe Block and Composite Statistics within LOM Pit | 80 |
Table 11-11: Block and Composite Grindability Statistics within LOM Pit | 83 |
Table 11-12: Model Reconciliation 2014-2020 | 85 |
Table 11-13: Summary of Northshore Mineral Resources - December 31, 2021 | 86 |
| |
| |
| |
| |
Cleveland-Cliffs Inc. | Northshore Property, SLR Project No: 138.02467.00001Technical Report Summary - February 7, 2022 v
| | | | | |
| |
| |
| |
| |
| |
| |
| |
Table 13-7: LOM Mine Production Schedule | 107 |
Table 13-8: Stockpile Parameters | 109 |
Table 13-9: Waste Rock and Overburden Stockpile Capacities | 109 |
Table 13-10: Major Mining Equipment | 111 |
Table 14-1: Major Processing Equipment | 121 |
Table 14-2: Crude to Pellet Recoveries | 122 |
Table 14-3: Standard Pellets – Cargo Specification | 123 |
Table 14-4: DR-Grade Coated Pellets – Cargo Specification | 123 |
Table 14-5: DR-Grade Uncoated Pellets – Cargo Specification | 124 |
Table 14-6: Energy Usage Per Long Ton of Pellets | 124 |
Table 14-7: Consumable Usage | 125 |
| |
| |
| |
| |
| |
| |
| |
| |
| |
| |
| |
Cleveland-Cliffs Inc. | Northshore Property, SLR Project No: 138.02467.00001Technical Report Summary - February 7, 2022 vi
FIGURES
| | | | | |
| |
| |
| |
| |
| |
| |
| |
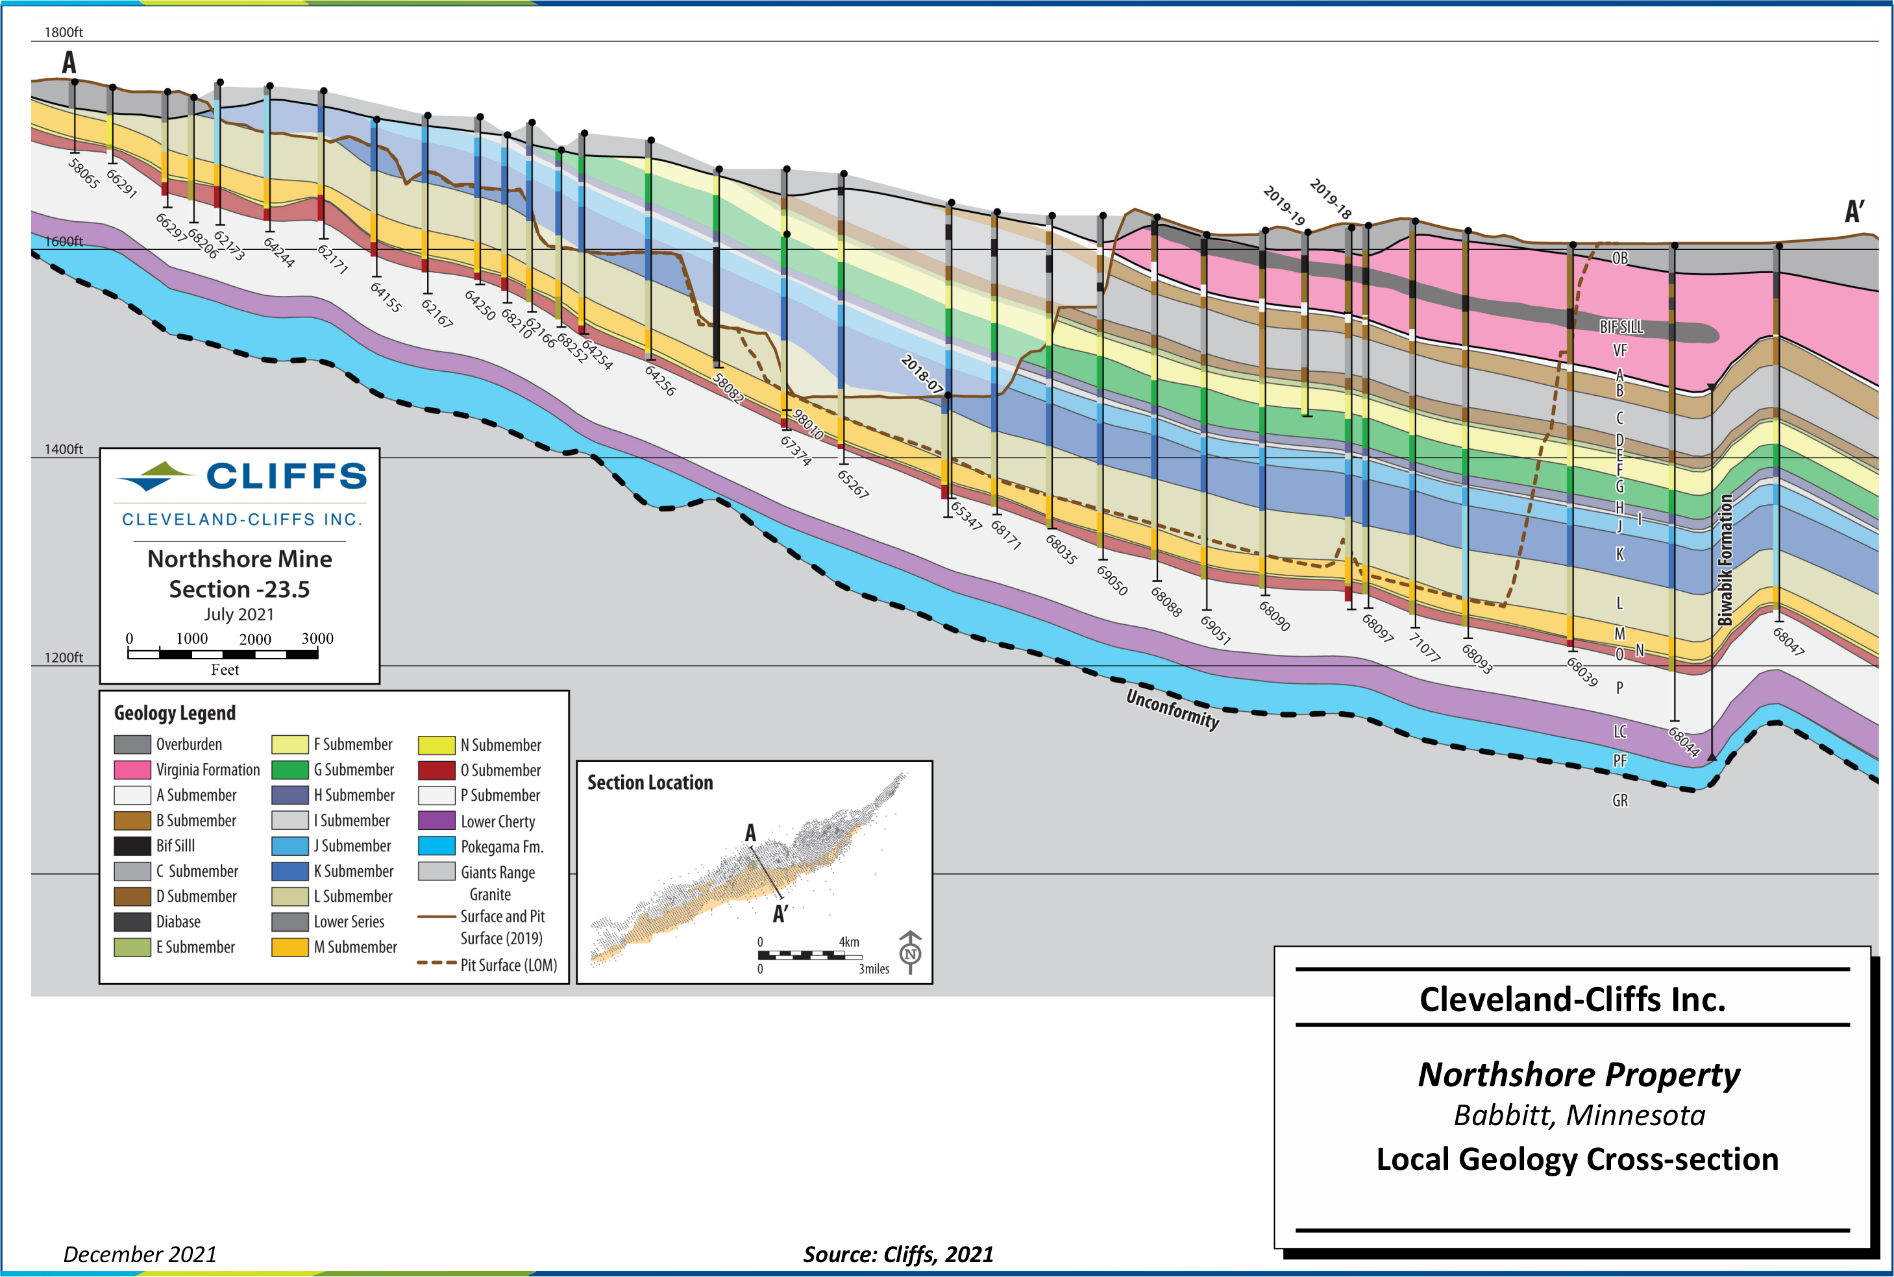
Figure 6-5: Local Geology Cross-section | 39 |
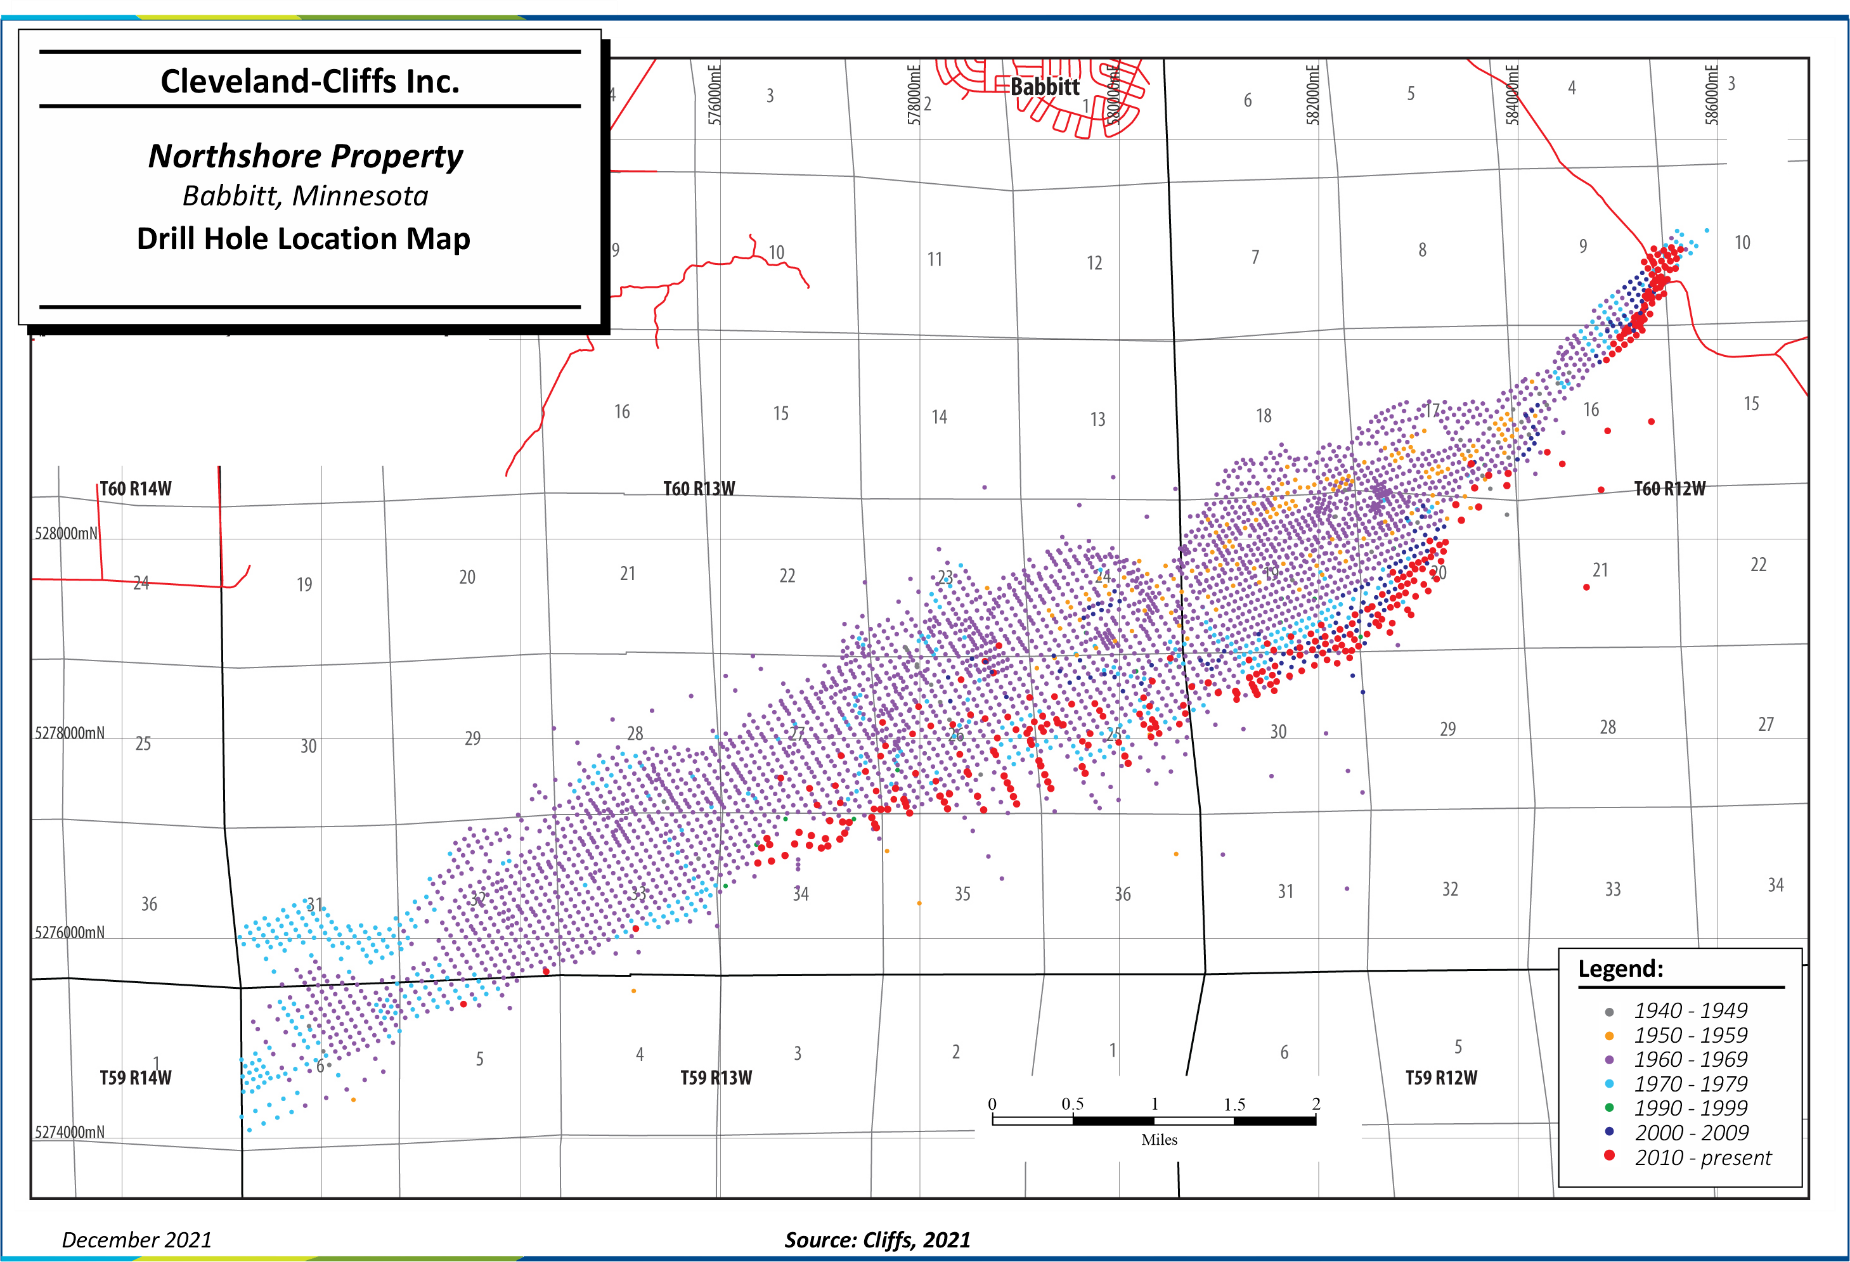
Figure 7-1: Drill Hole Location Map | 46 |
| |
| |
| |
| |
| |
| |
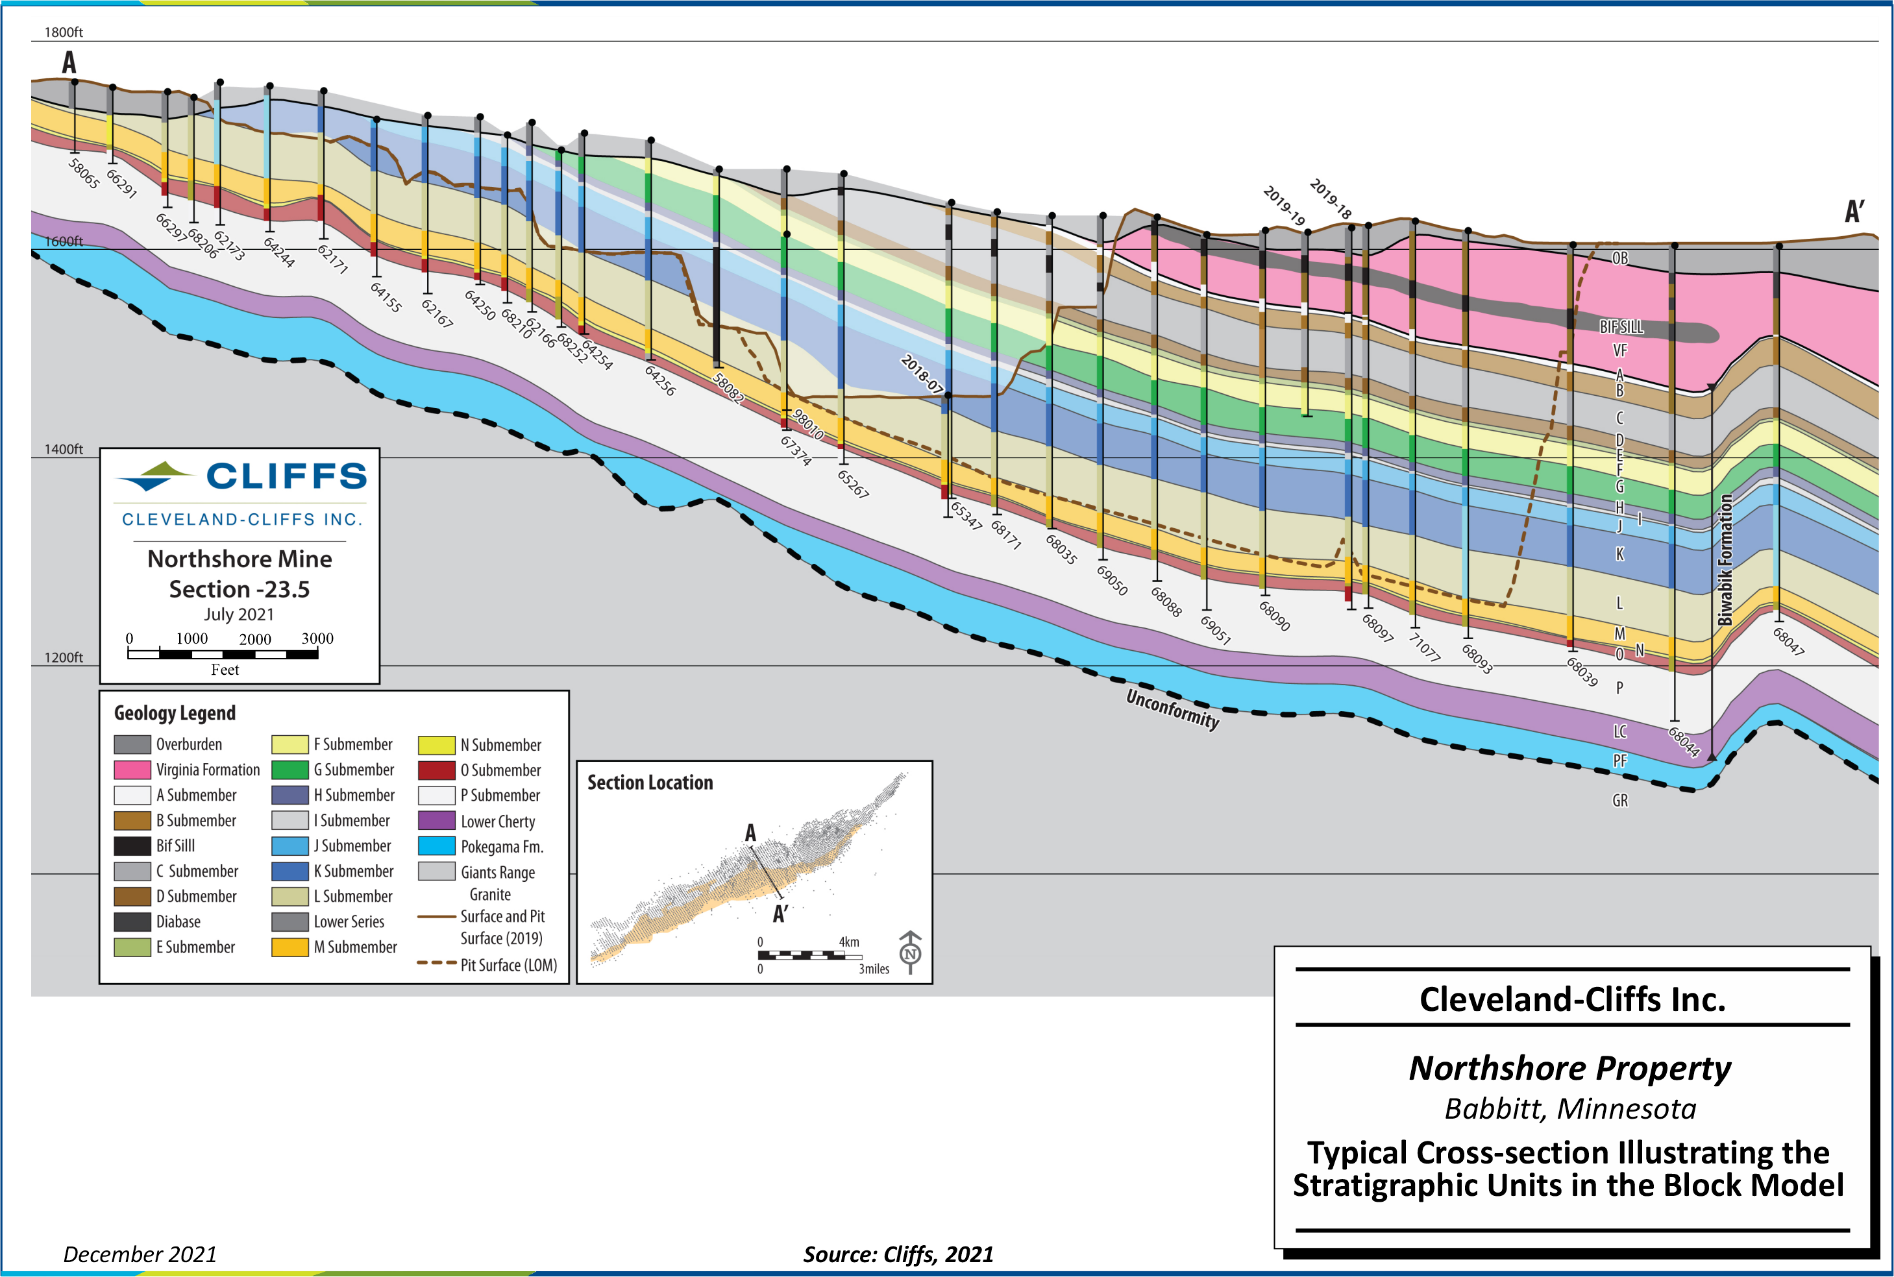
Figure 11-1: Typical Cross-section Illustrating the Stratigraphic Units in the Block Model | 67 |
Figure 11-2: Comparison of Assay and Composite Lengths within Mineralized Units | 70 |
Figure 11-3: Subunit K MagFe Variogram Model | 72 |
Figure 11-4: Cut-Off Grade Formula | 76 |
Figure 11-5: Log Probability Plot of MagFe Composite Values at Northshore | 77 |
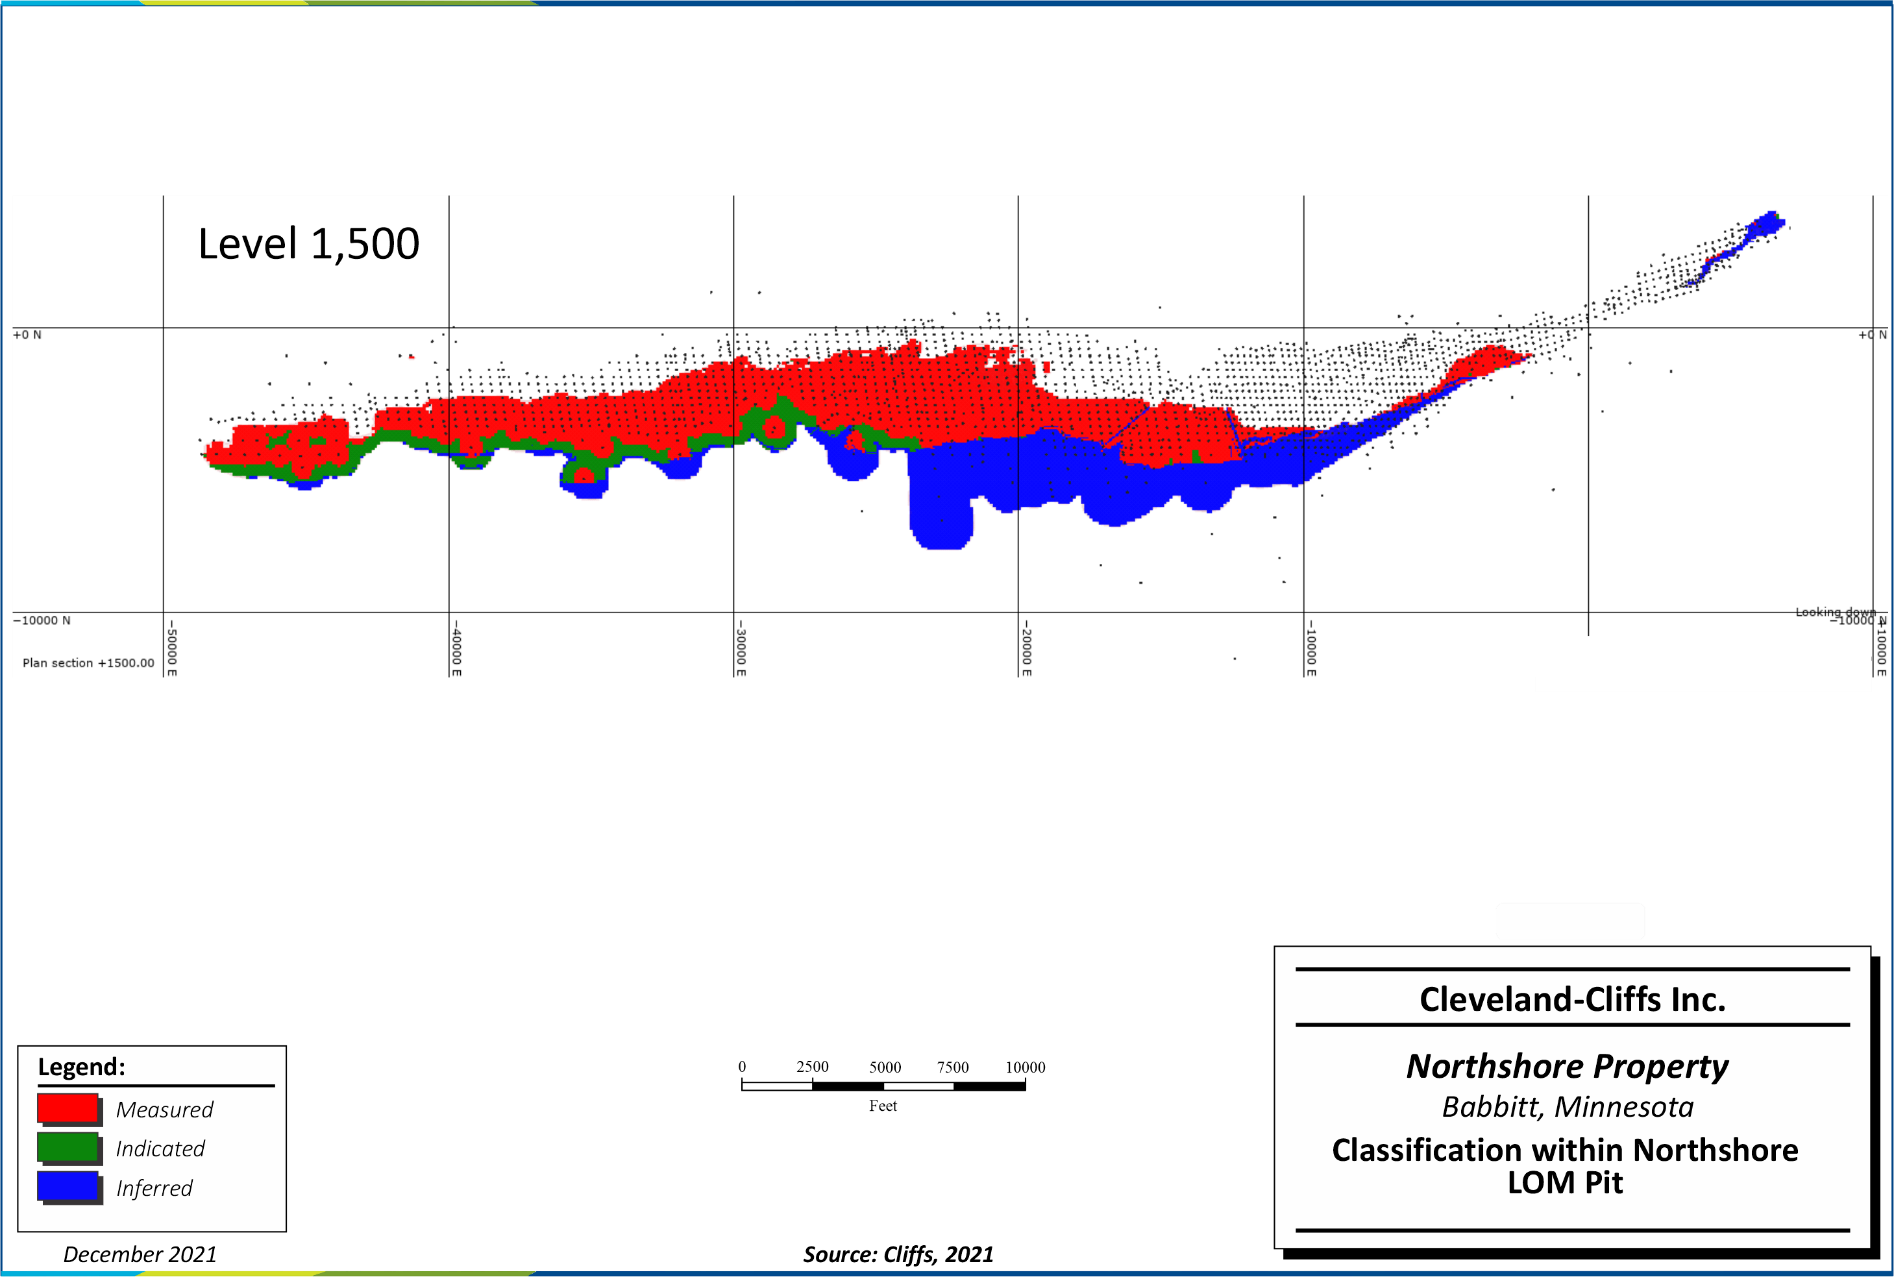
Figure 11-6: Classification within Northshore LOM Pit | 79 |
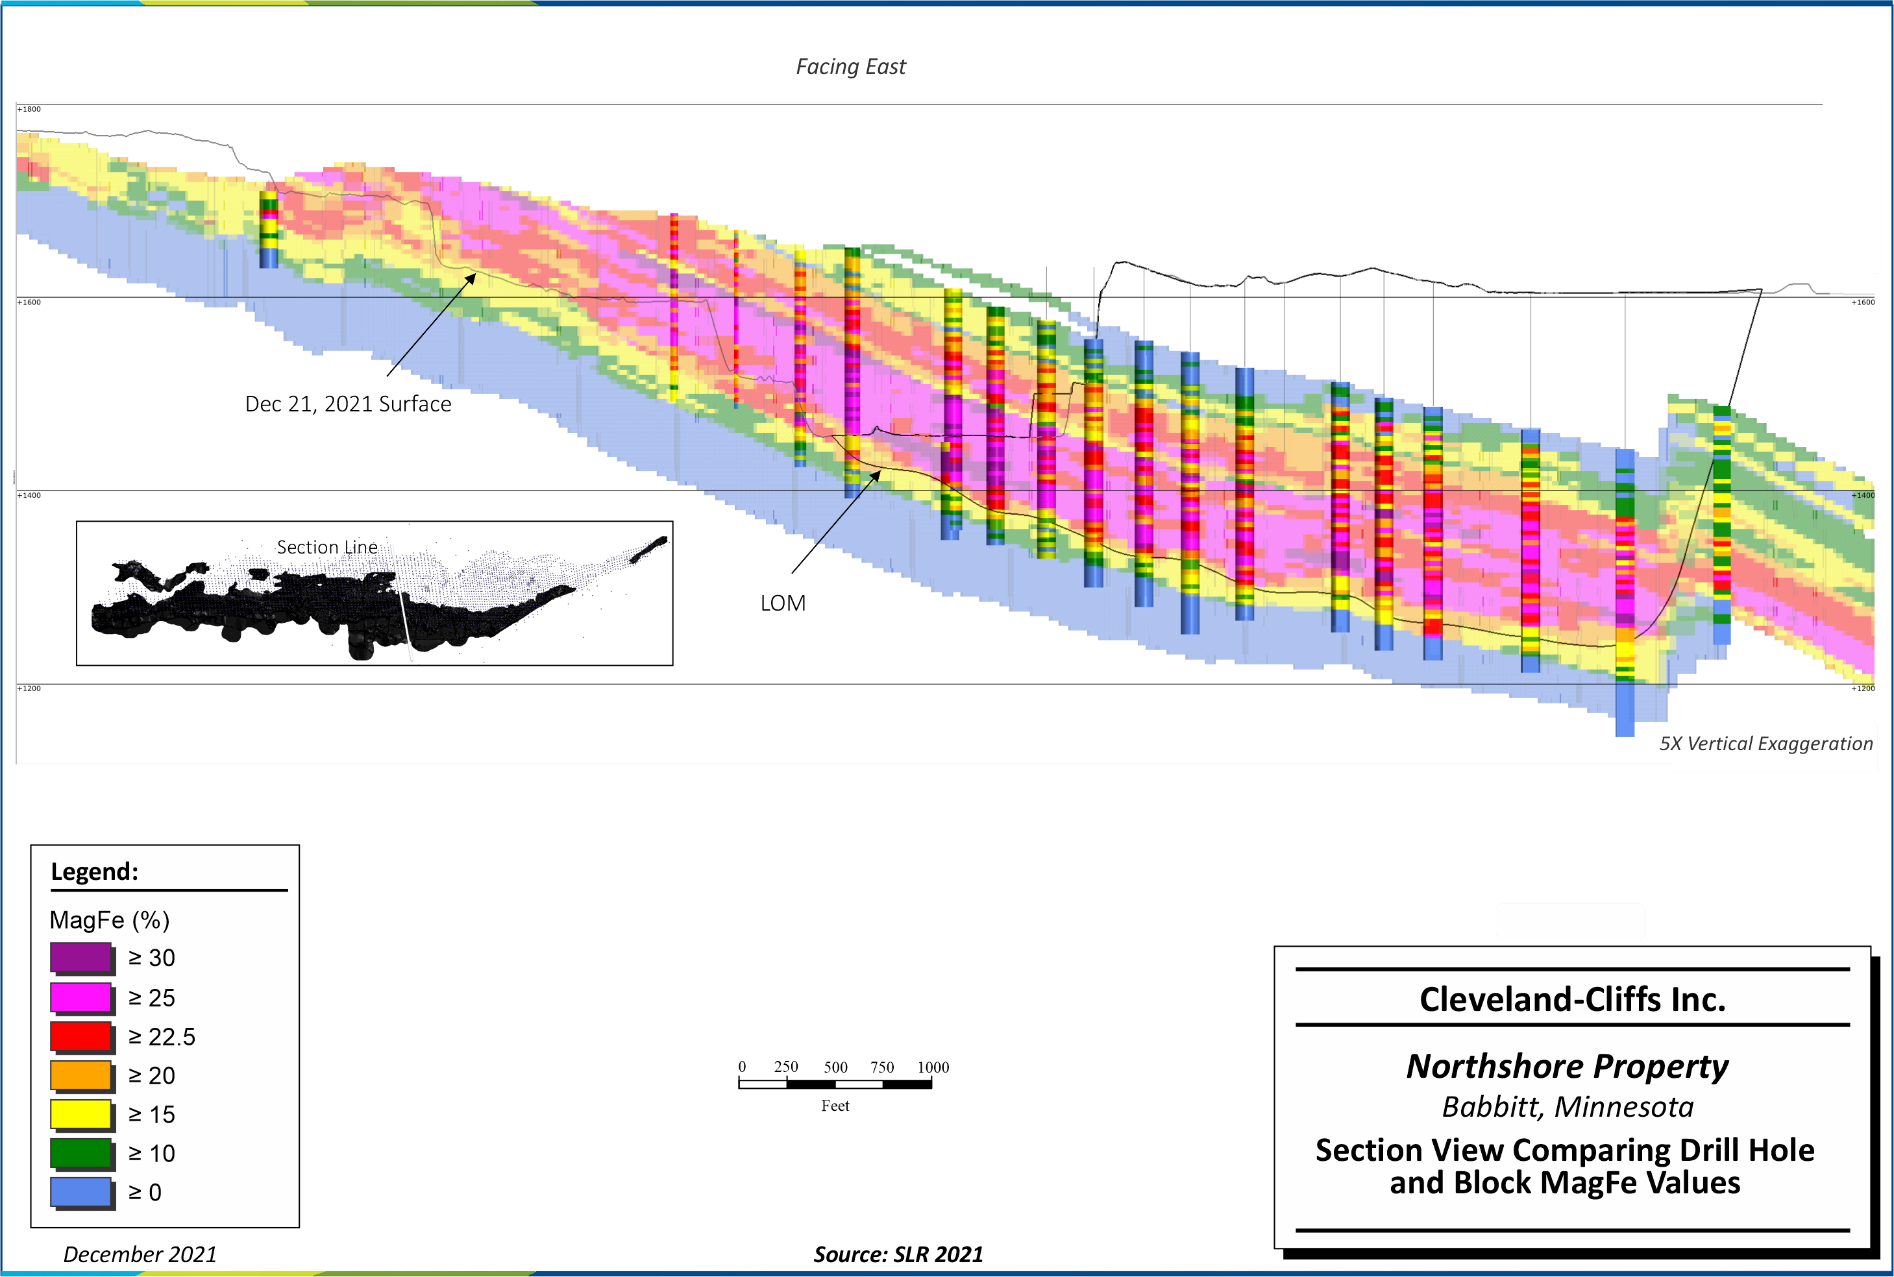
Figure 11-7: Section View Comparing Drill Hole and Block MagFe Values | 81 |
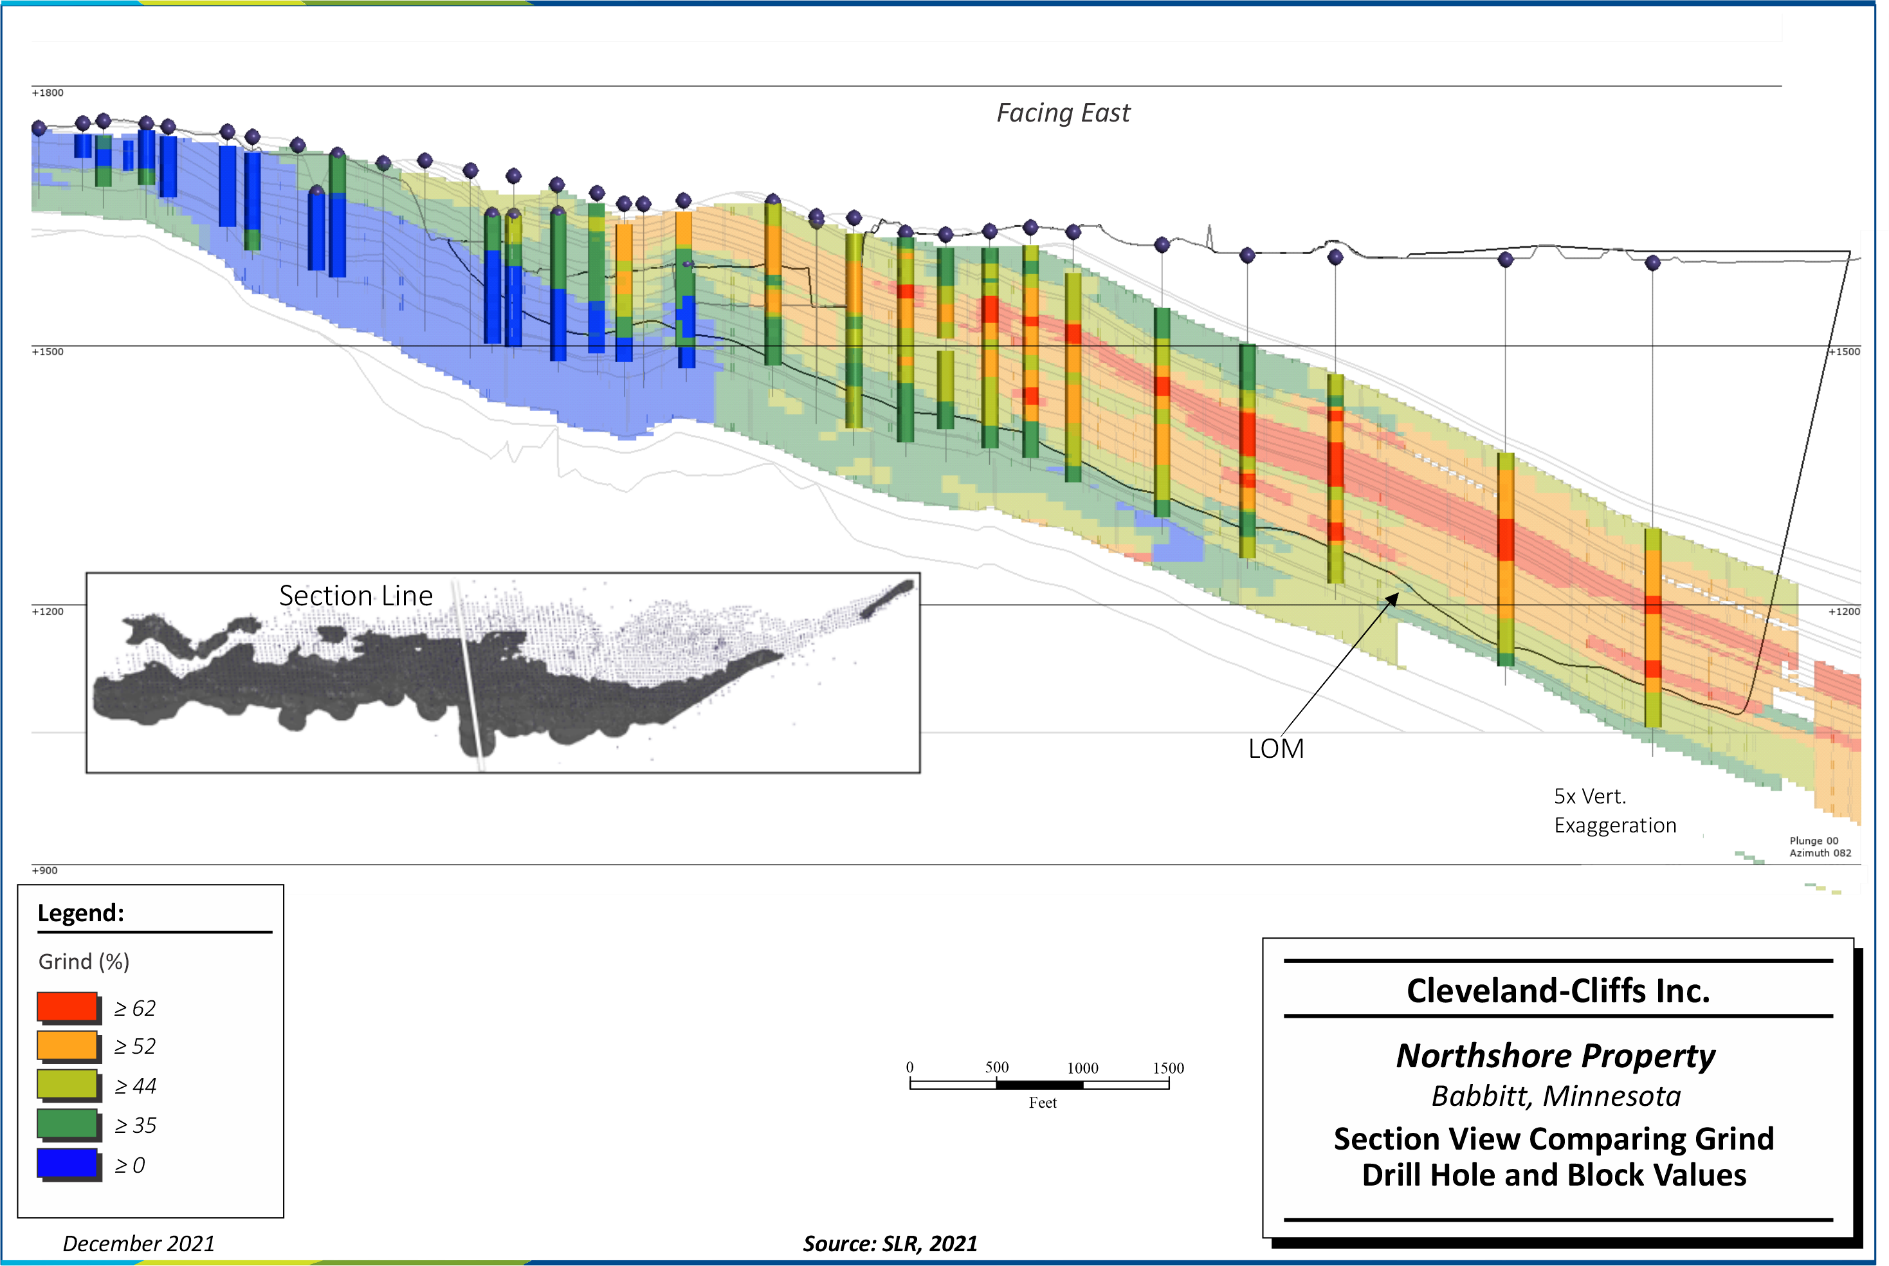
Figure 11-8: Section View Comparing Drill Hole and Block Grindability Values | 82 |
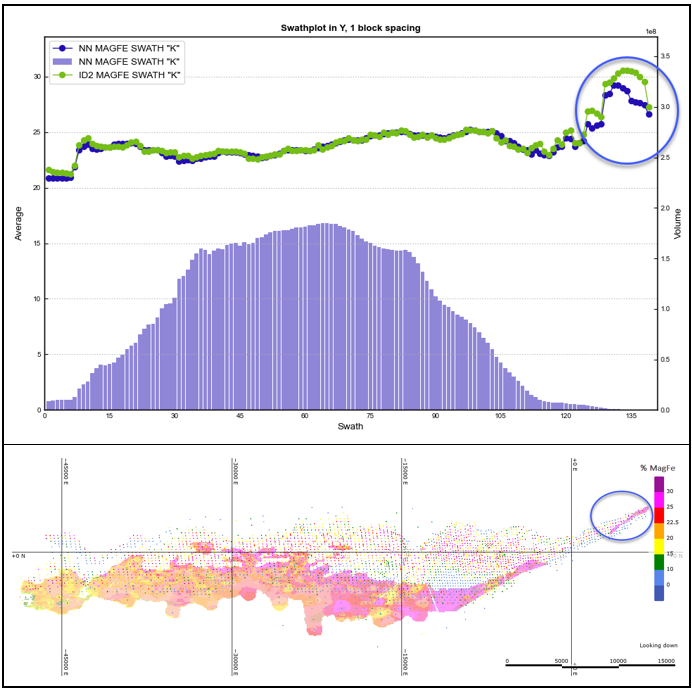
Figure 11-9: Swath Plot (Northings) of MagFe ID2 and NN Blocks of Subunit K within LOM Pit | 84 |
| |
| |
| |
| |
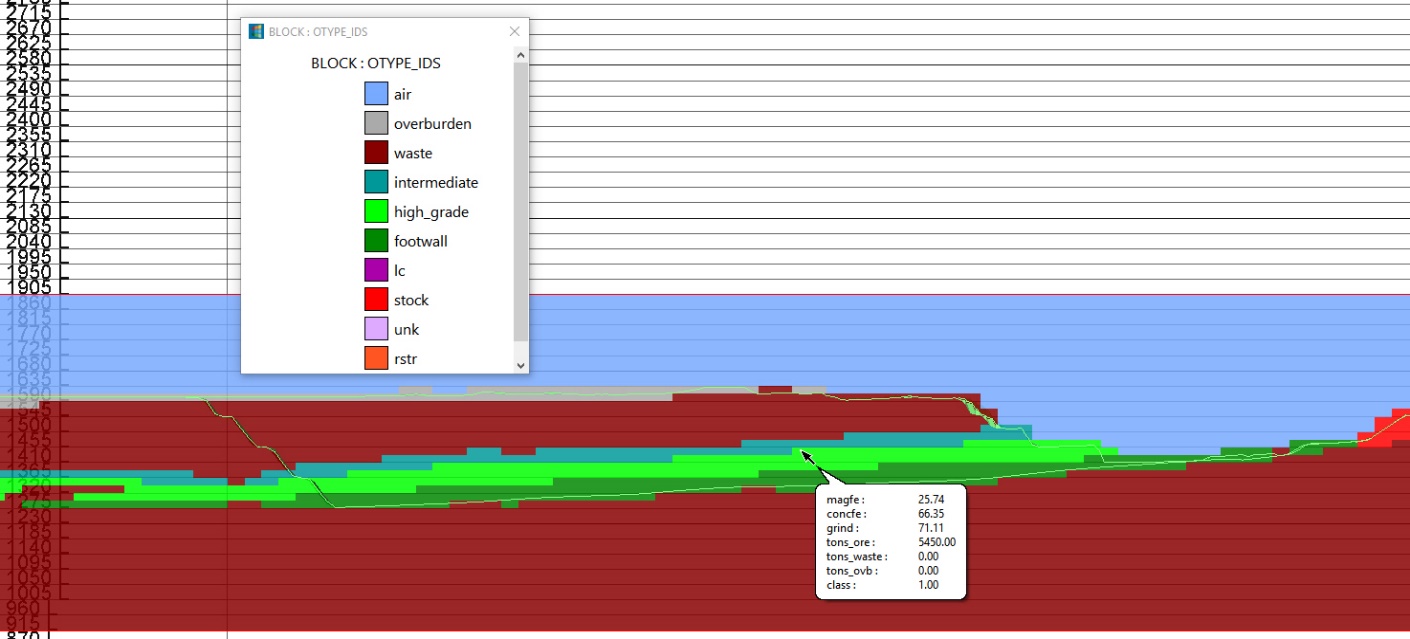
Figure 13-3: Example Final Pit Cross-section Looking Southwest | 103 |
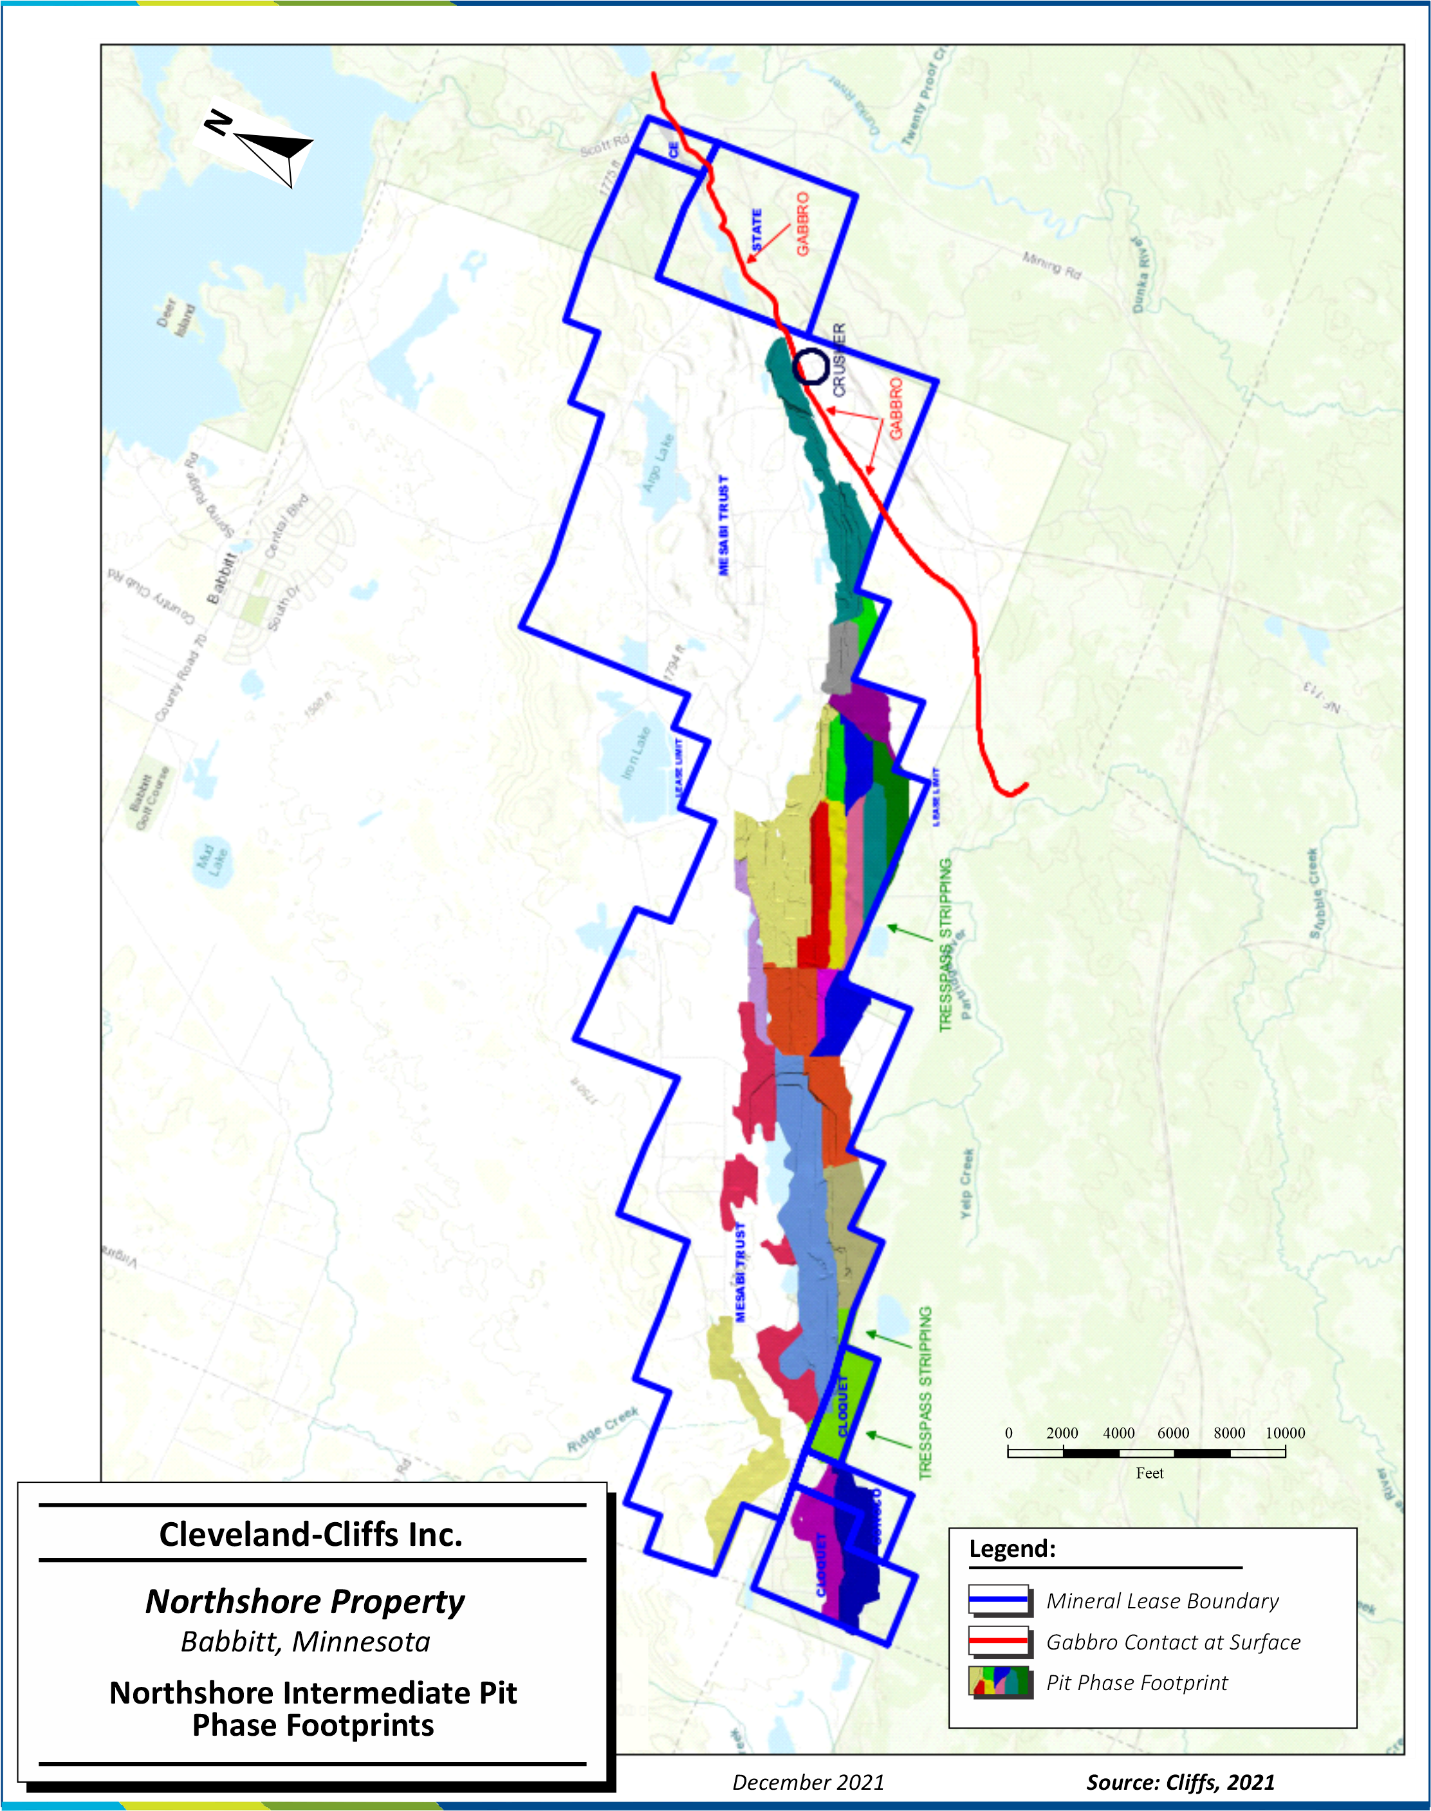
Figure 13-4: Northshore Intermediate Pit Phase Footprints | 105 |
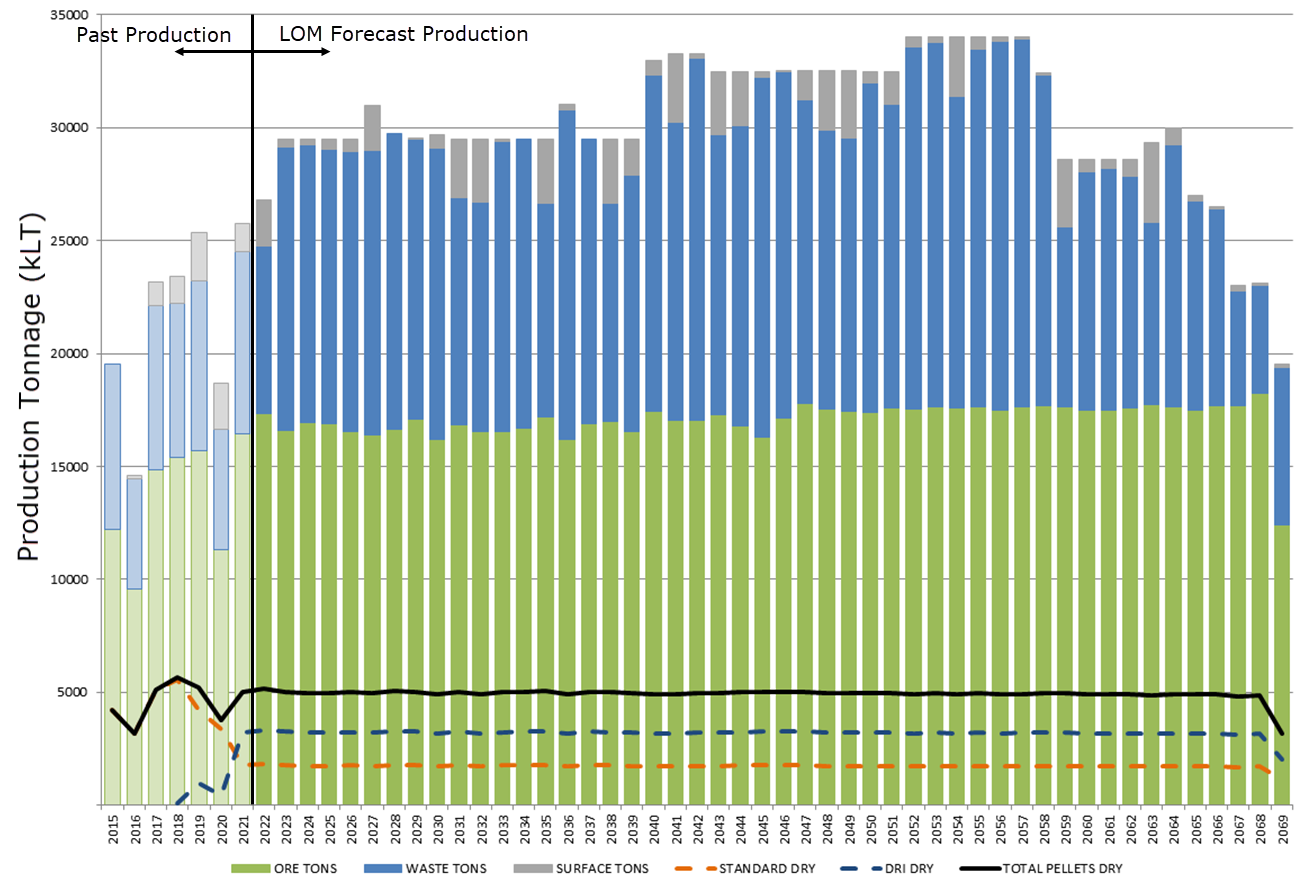
Figure 13-5: Past and Forecast LOM Production | 108 |
Cleveland-Cliffs Inc. | Northshore Property, SLR Project No: 138.02467.00001Technical Report Summary - February 7, 2022 vii
| | | | | |
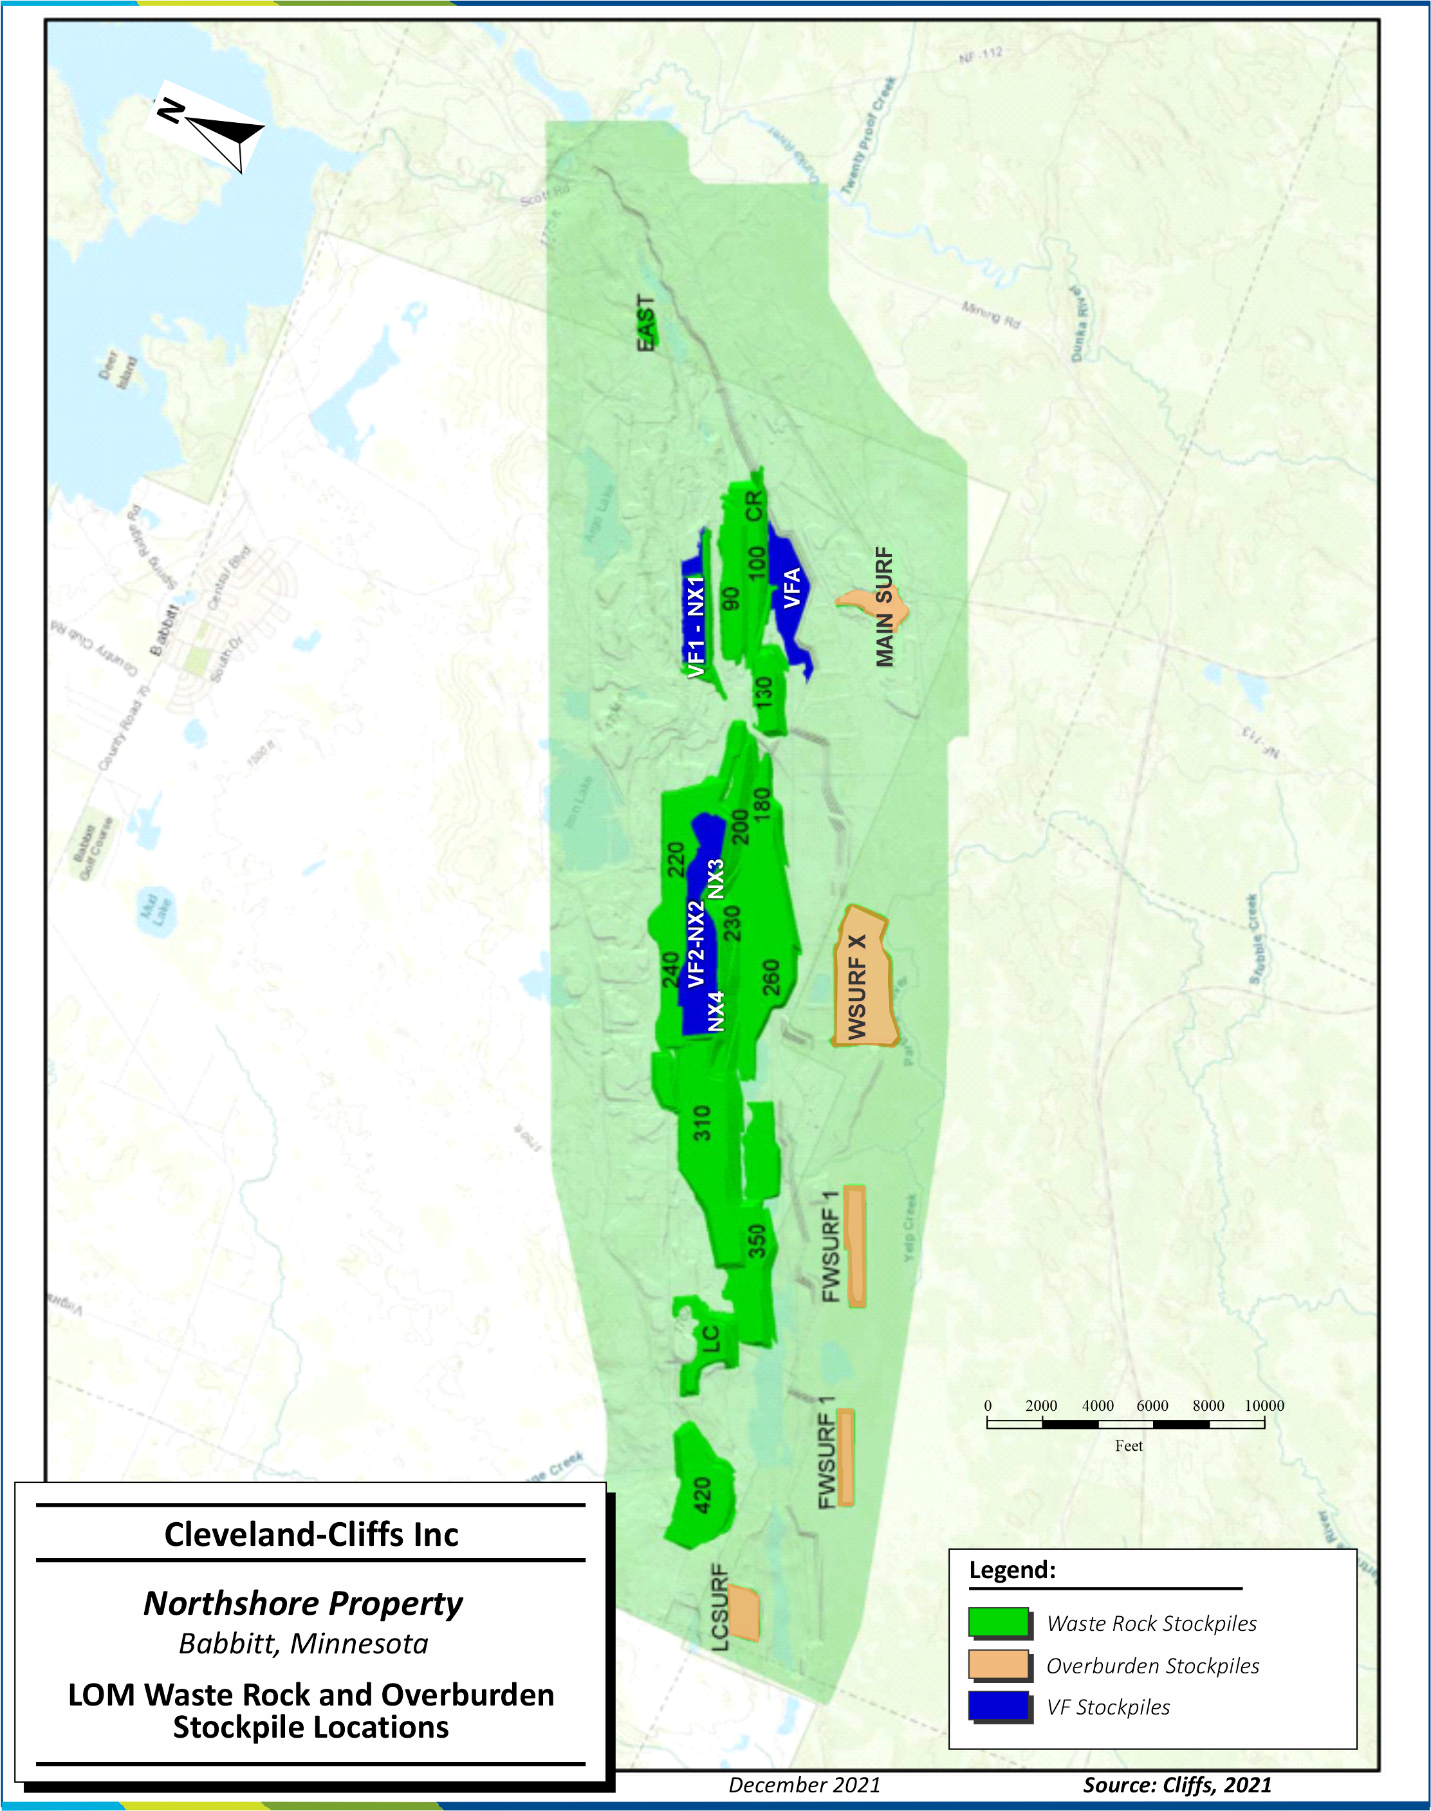
Figure 13-6: LOM Waste Rock and Overburden Stockpile Locations | 110 |
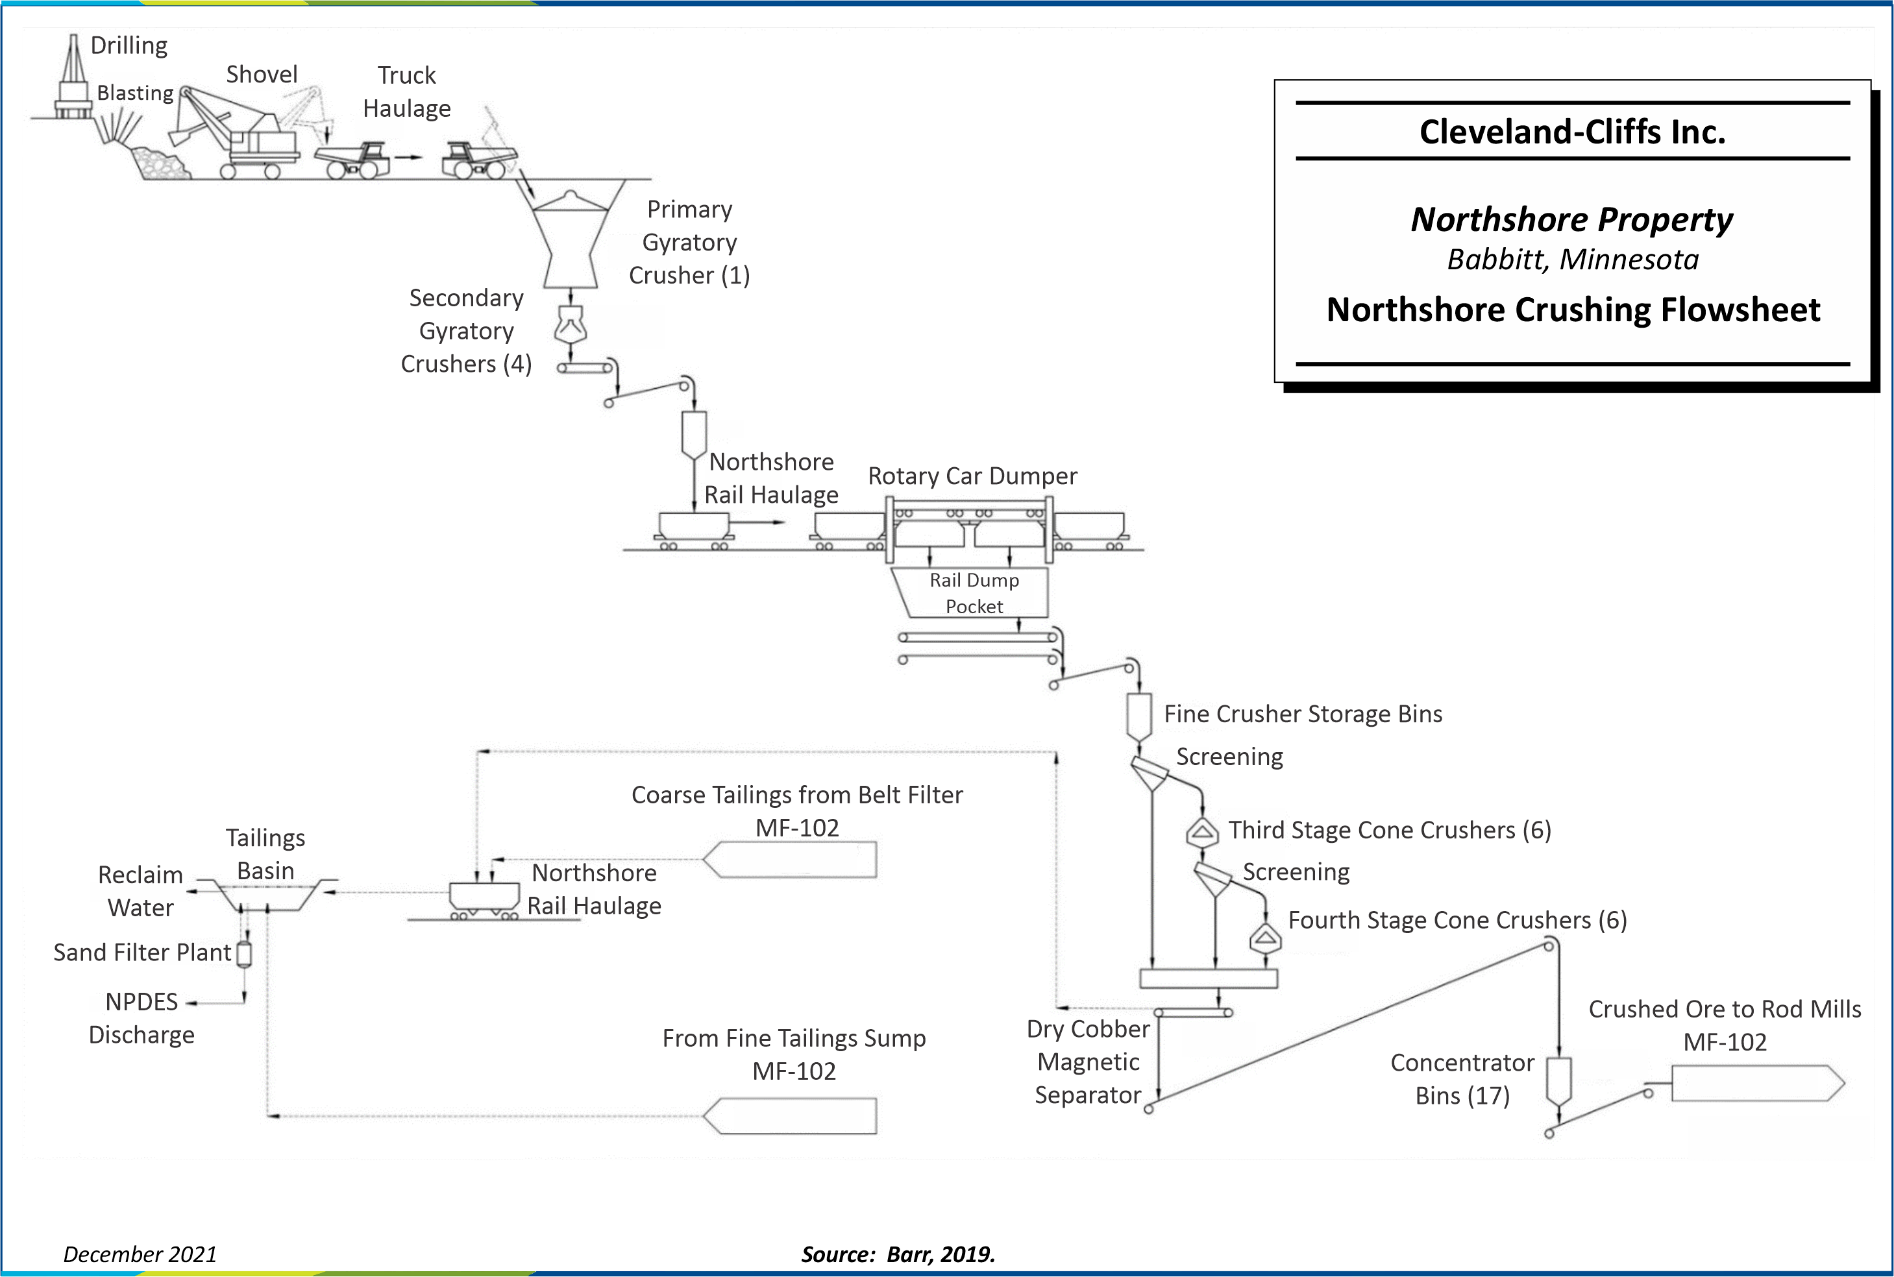
Figure 14-1: Northshore Crushing Flowsheet | 116 |
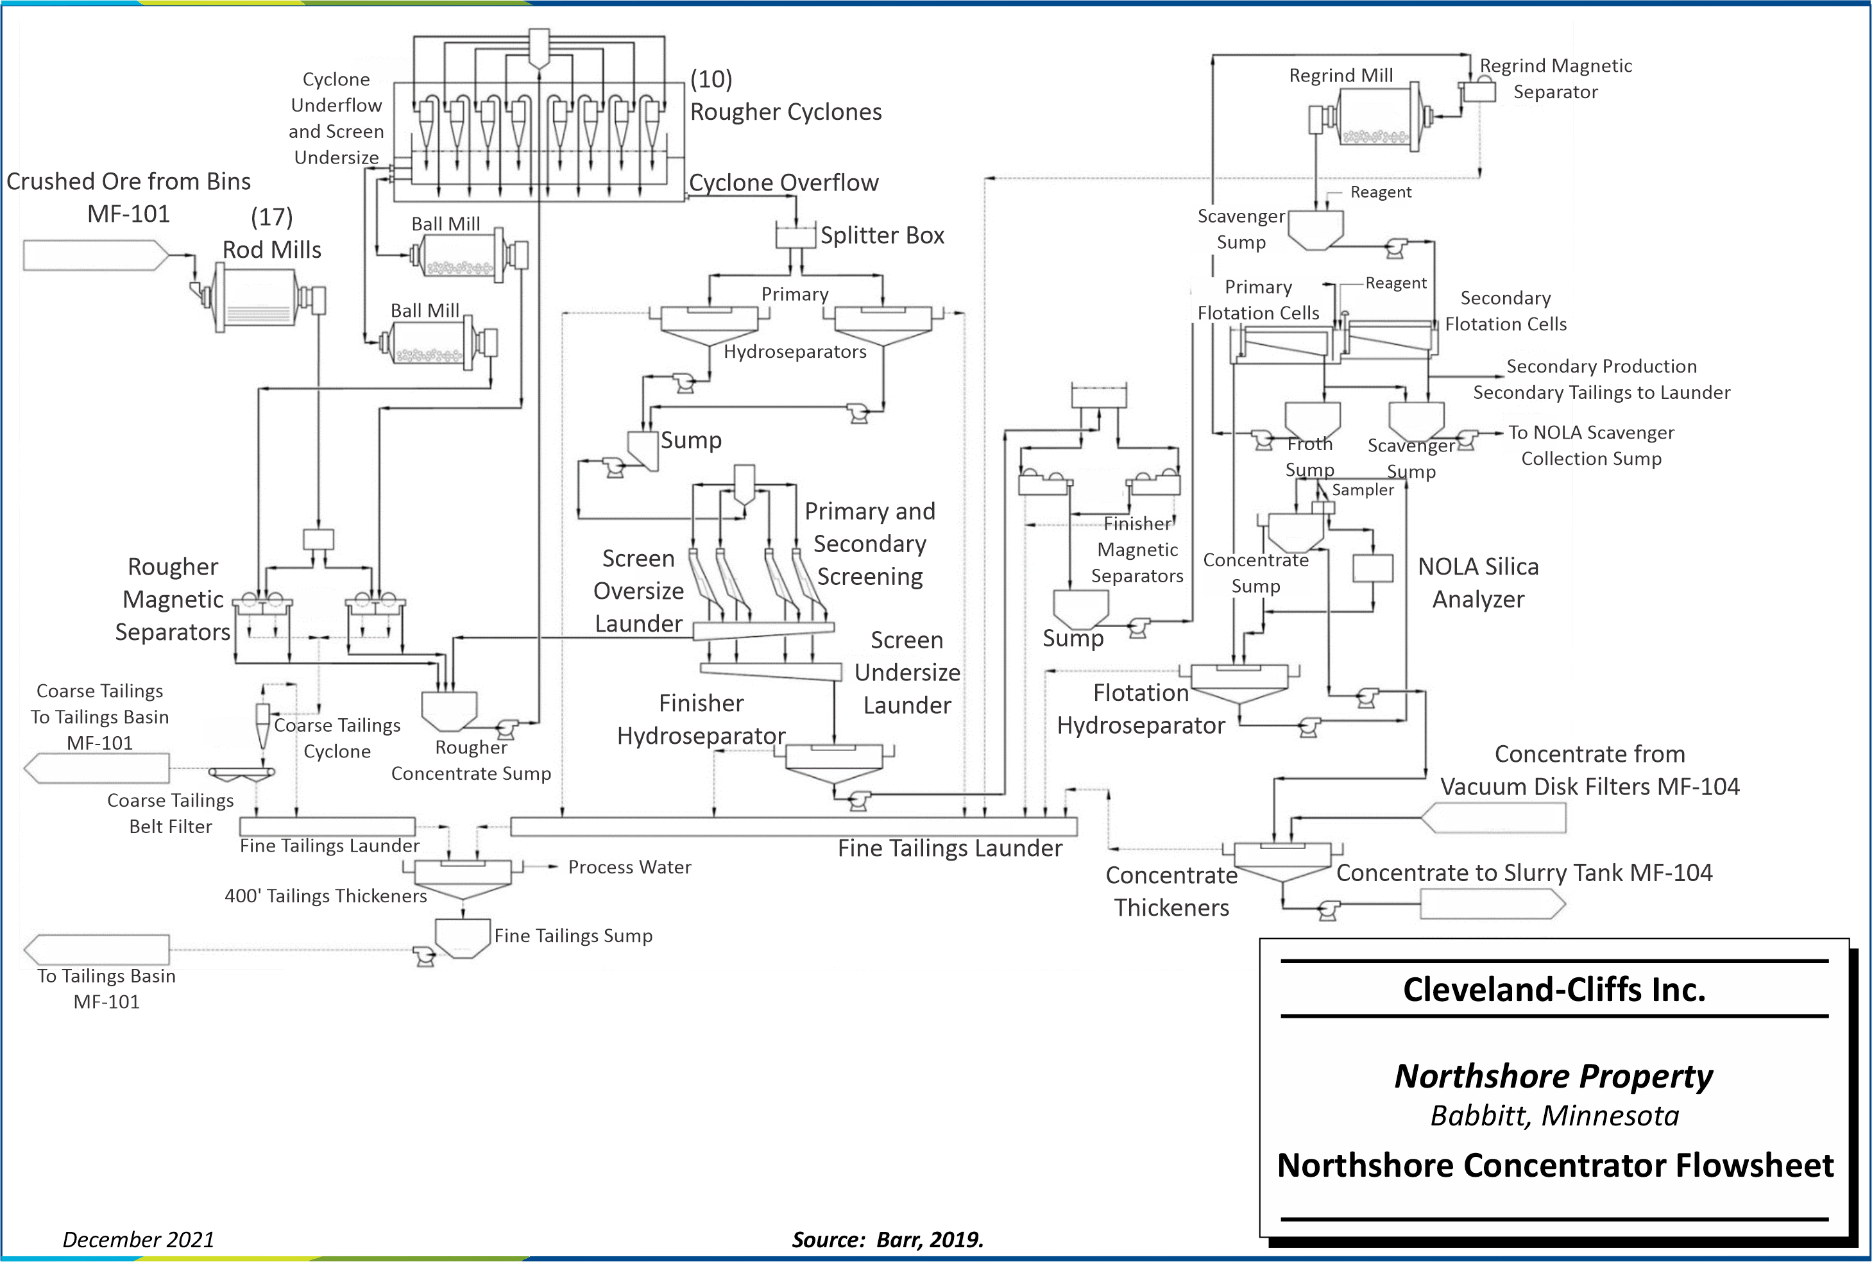
Figure 14-2: Northshore Concentrator Flowsheet | 117 |
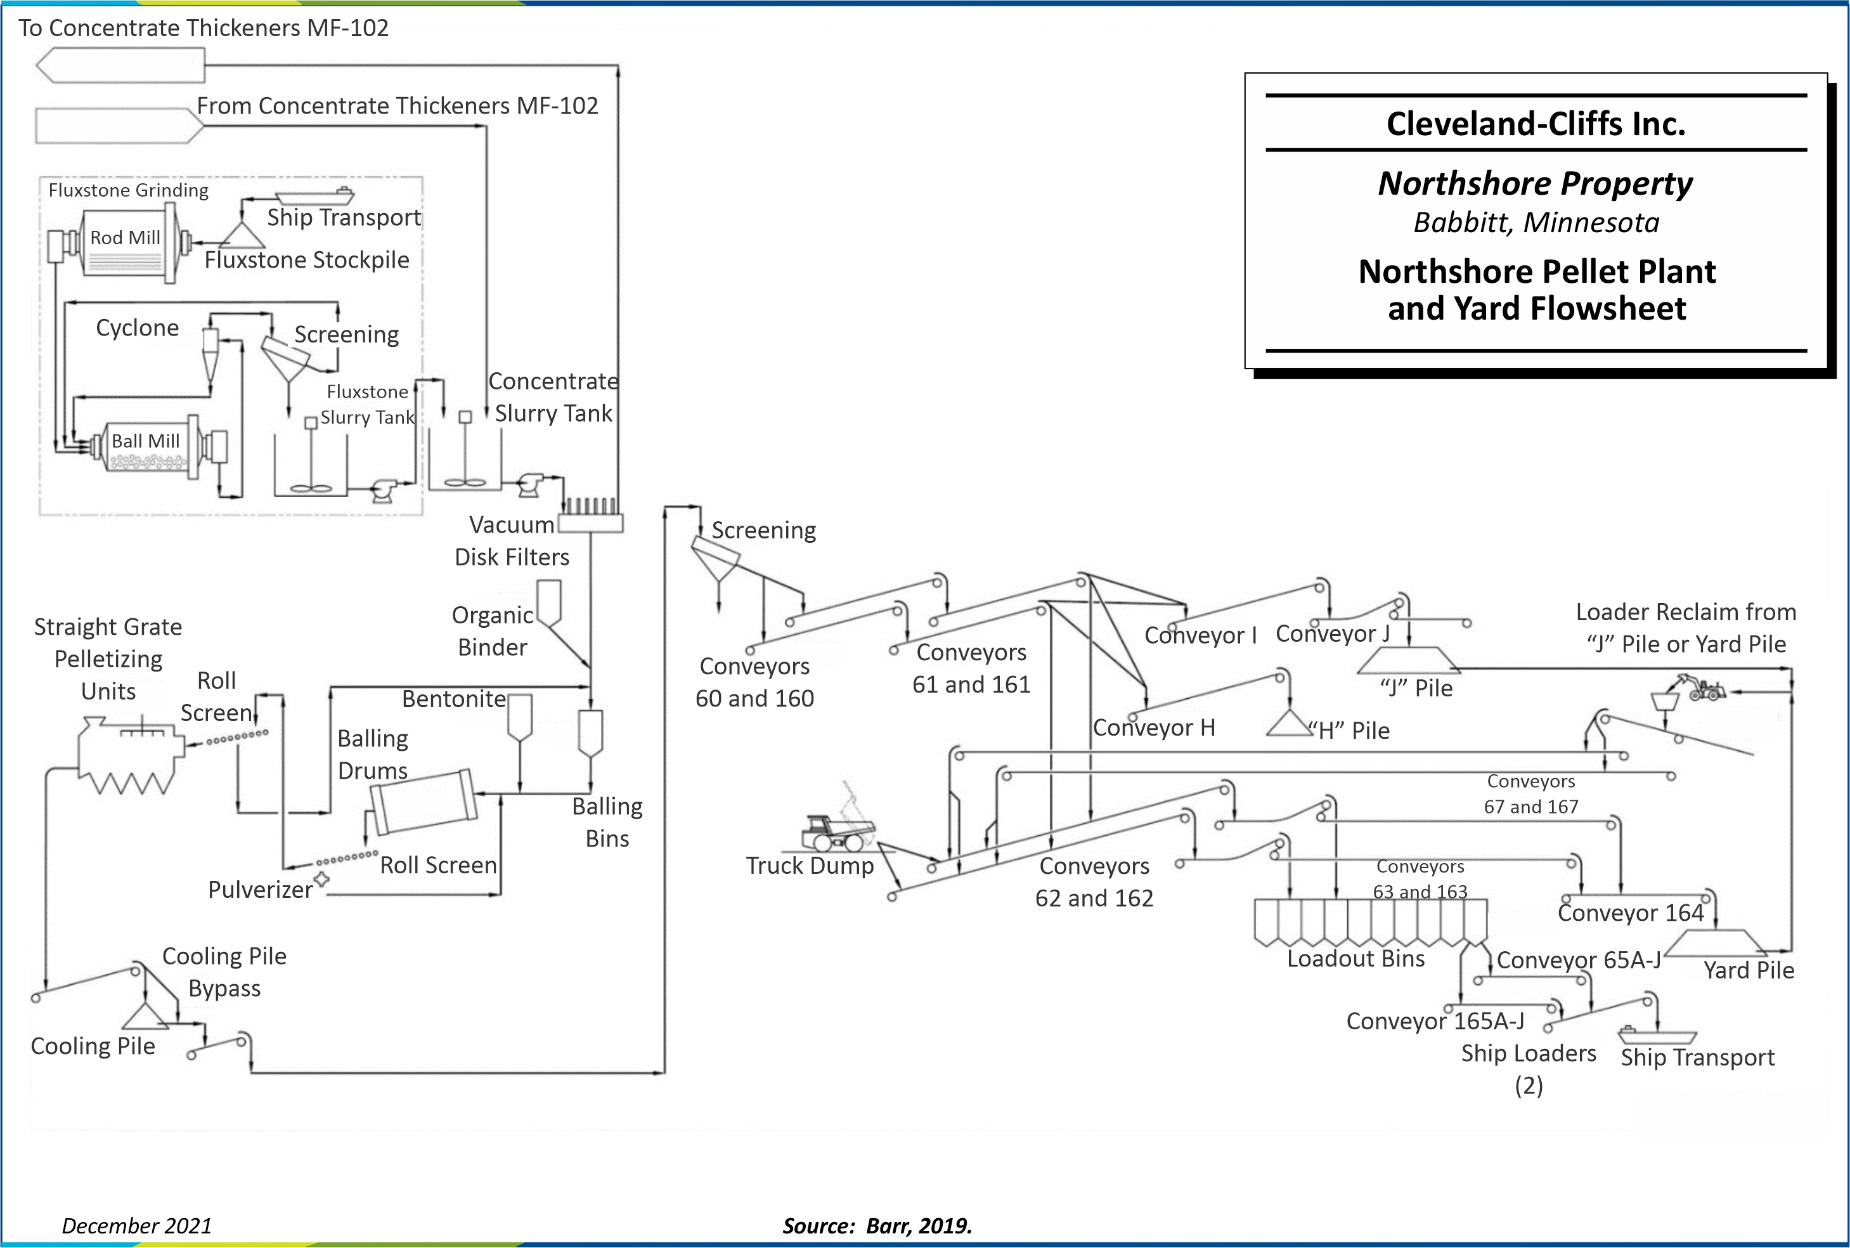
Figure 14-3: Pellet Plant and Yard Flowsheet | 120 |
| |
| |
| |
| |
| |
| |
| |
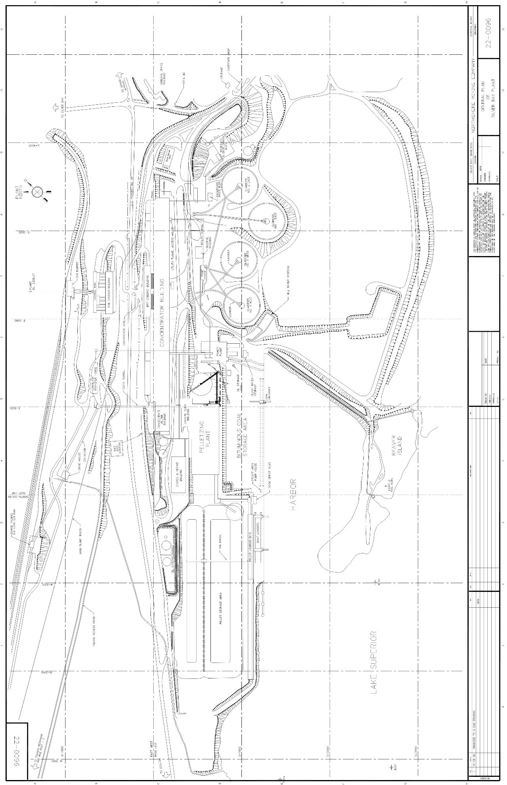
Figure 15-8: Silver Bay Plant Facilities | 140 |
Cleveland-Cliffs Inc. | Northshore Property, SLR Project No: 138.02467.00001Technical Report Summary - February 7, 2022 viii
1.0EXECUTIVE SUMMARY
1.1Summary
SLR International Corporation (SLR) was retained by Cleveland-Cliffs Inc. (Cliffs) to prepare an independent Technical Report Summary (TRS) for Cliffs’ Northshore Property (Northshore or the Property), located in Northeastern Minnesota, USA. The operator of the Property, Northshore Mining Company (NSM), is a wholly owned subsidiary of Cliffs.
The purpose of this TRS is to disclose year-end (YE) 2021 Mineral Resource and Mineral Reserve estimates for Northshore.
Cliffs is listed on the New York Stock Exchange (NYSE) and currently reports Mineral Reserves of pelletized ore in SEC filings. This TRS conforms to United States Securities and Exchange Commission’s (SEC) Modernized Property Disclosure Requirements for Mining Registrants as described in Subpart 229.1300 of Regulation S-K, Disclosure by Registrants Engaged in Mining Operations (S-K 1300) and Item 601 (b)(96) Technical Report Summary. SLR visited the Property on October 22-23, 2019.
The Property includes the Peter Mitchell Mine (the Mine) in the city Babbitt, Minnesota and the E.W. Davis Works processing facility (E.W. Davis Works or the Plant) in city of Silver Bay, Minnesota. The Mine is a large, operating, open-pit iron mine that produces pellets from a magnetite iron ore regionally known as taconite.
The Property commenced operations in 1952 as an asset of the Reserve Mining Company (Reserve Mining) and continued production until 1986 when Reserve Mining declared bankruptcy. Cyprus Minerals Company (Cyprus) purchased the facilities in 1989 and renamed it Cyprus Northshore Mining Company. Cyprus subsequently sold that company to Cliffs in 1994, and Cliffs renamed it Northshore Mining Company. Northshore Mining Company has been a wholly owned subsidiary of Cliffs since that time.
The open-pit operation has a mining rate of approximately 17 million long tons (MLT) of ore per year and produces 5.0 MLT of iron ore pellets, which are shipped by freighter via the Great Lakes to Cliffs’ steel mill facilities in the Midwestern USA.
1.1.1Conclusions
Northshore has successfully produced iron pellets for over 69 years. The update to the Mineral Resource and Mineral Reserve does not materially change any of the assumptions from previous operations. An economic analysis was performed using the estimates presented in this TRS and confirms that the outcome is a positive cash flow that supports the statement of Mineral Reserves for a 48 year mine life.
SLR offers the following conclusions by area.
1.1.1.1Geology and Mineral Resources
•Above a crude magnetic iron (MagFe) cut-off grade of 15%, Northshore Measured and Indicated Mineral Resources exclusive of Mineral Reserves are estimated to total 1,158 MLT at an average grade of 22.2% MagFe.
Cleveland-Cliffs Inc. | Northshore Property, SLR Project No: 138.02467.00001Technical Report Summary - February 7, 2022 1
•Exploration sampling, preparation, and analyses are appropriate for the style of mineralization and are sufficient to support the estimation of Mineral Resources.
•Work towards a comprehensive quality assurance and quality control (QA/QC) program at Northshore is progressing well, and sample and data security are consistent with industry best practice.
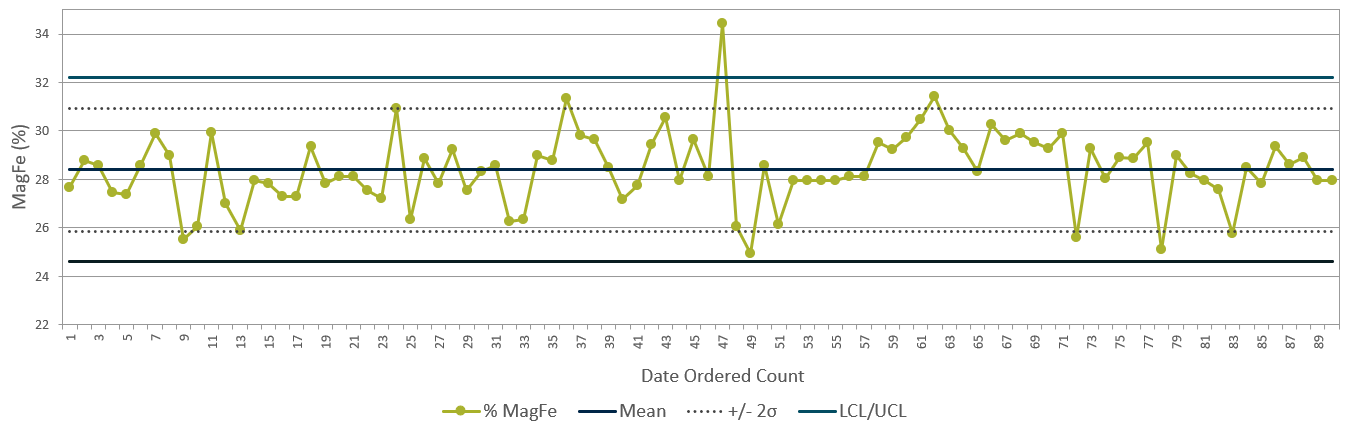
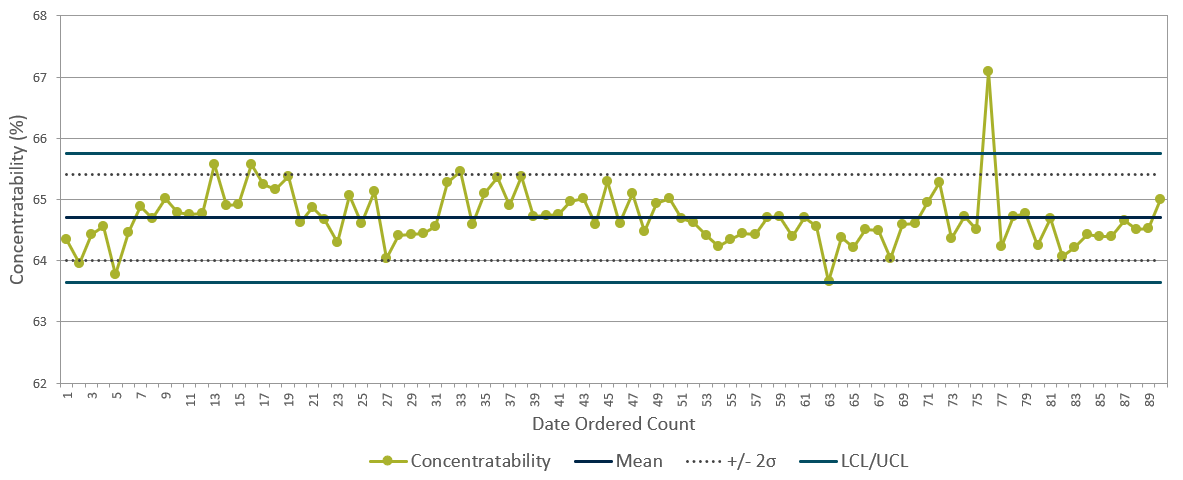
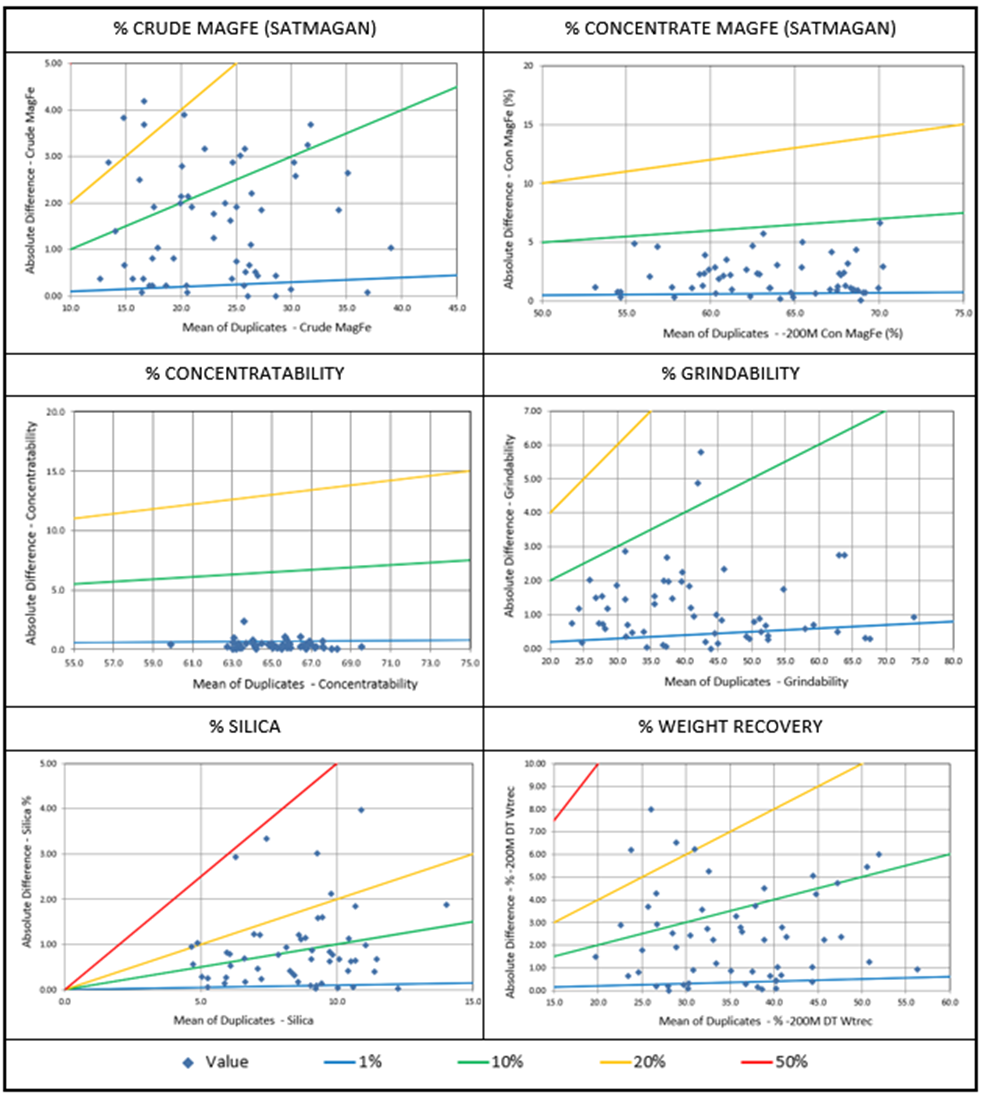
•Results as compiled by Cliffs’ personnel and reviewed by the Qualified Person (QP) indicate an acceptable level of accuracy and a good level of repeatability for economic variables at Northshore. The range of acceptability for MagFe (24.6% to 32.2% MagFe), as well as other variables in standard NSMCOS_Block 21 is quite high, and based on more recent results higher precision is achievable.
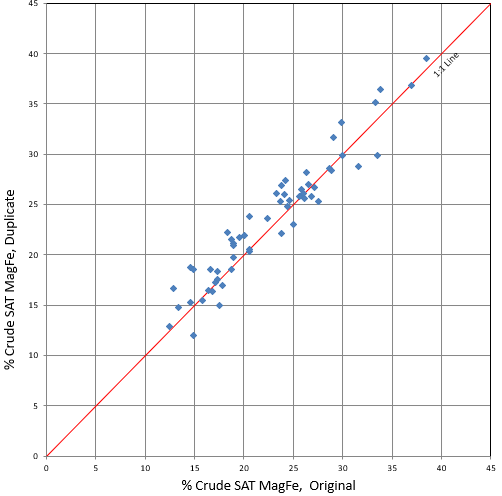
•Coarse duplicate values for crude MagFe by Saturation Magnetization Analyzer (Satmagan) are generally acceptable. Based on observations from the neighboring United Taconite Property (UTAC) mine, improvements are possible and warranted to reduce variation and improve analytical precision in future drill core analyses.
•The turnaround time for exploration drilling samples at the Silver Bay laboratory is very long, sometimes exceeding twelve months.
•The geological model is fit for purpose and captures the principal geological features of the Biwabik Iron Formation (Biwabik IF) at Northshore. The methodology used to prepare the block model is appropriate, and validations compiled by the QP indicate that the block model is reflecting the underlying support data.
•The classification at Northshore is generally acceptable, but some post-processing to remove isolated blocks of different classification is warranted.
•In both 2019 and 2020, actual versus model-predicted values of crude ore, pellet production, and process recovery were accurate to -0.09% to 4.43%.
1.1.1.2Mining and Mineral Reserves
•Northshore has been in production since 1952, and specifically under 100% Cliffs operating management since 1994. Cliffs conducts its own Mineral Reserve estimations.
•Total Proven and Probable Mineral Reserves are estimated at 822.4 MLT of crude ore at an average grade of 24.6% MagFe.
•Mineral Reserve estimation practices follow industry standards.
•The Mineral Reserve estimate indicates a sustainable project over a 48 year life of mine (LOM).
•The geotechnical design parameters used for pit design are reasonable and supported by previous operations.
•The LOM production schedule is reasonable and incorporates large mining areas and open benches.
•An appropriate mining equipment fleet, maintenance facilities, and manpower are in place, with additions and replacements estimated, to meet the LOM production schedule requirements.
•Sufficient storage capacity for waste stockpiles and tailings has been identified to support the production of the Mineral Reserve.
Cleveland-Cliffs Inc. | Northshore Property, SLR Project No: 138.02467.00001Technical Report Summary - February 7, 2022 2
1.1.1.3Mineral Processing
•The E.W. Davis Works in Silver Bay has been in production since the 1950s, so metallurgical sampling and testing is primarily used in support of plant operations and product quality control. A laboratory is located inside the concentrator building where samples from the Mine and Plant are analyzed. The laboratory is ISO-certified to iron industry standard procedures.
•In 2019, Northshore completed an upgrade at the Silver Bay Plant that allows for the production of lower-silica iron pellets that will be used internally or sold to customers for the production of direct reduced iron (DRI) products such as hot briquetted iron (HBI).
•Crude ore is magnetite taconite with a run of mine (ROM) MagFe grade of approximately 25%. The concentrator averages 87.8% MagFe recovery into a concentrate derived from 32.9 weight % of the original crude ore feed.
•Historical concentrate production ranged from 3.1 MLT/y dry to 5.5 MLT/y dry, with a 12-year average of 4.45 MLT/y dry.
•Concentrate is supplied to the pellet plant to produce pellets, which are sold as the main final product. Historical pellet production ranged from 3.1 MLT/y dry to 5.6 MLT/y dry, with a 12-year average of 4.54 MLT/yr dry.
•The operations are consistently run and well maintained.
1.1.1.4Infrastructure
•The Northshore facilities are in a historically important, iron-producing region of Northeastern Minnesota. All the infrastructure necessary to mine and process significant commercial quantities of iron ore is in place.
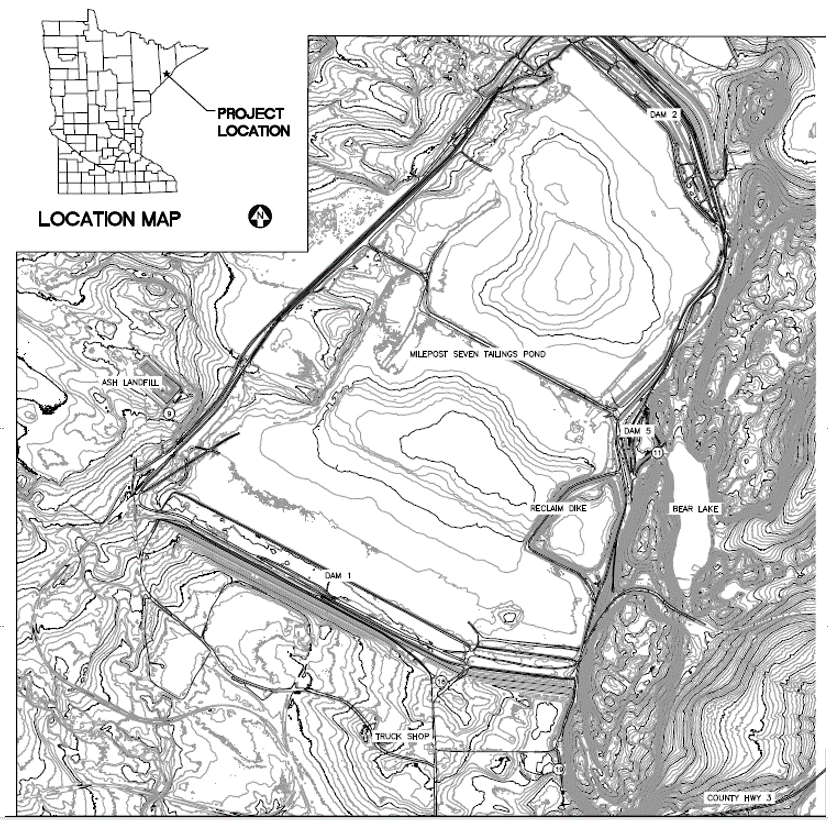
•NSM operates a tailings storage facility (TSF), which encompasses approximately 2,500 acres located approximately seven miles by rail northwest of the Plant, referred to as the Milepost 7 Tailings Basin.
1.1.1.5Environment
•NSM indicated that it maintains the requisite state and federal permits and is in compliance with all permits. Various permitting applications have been submitted to authorities and are pending authorization. Environmental liabilities and permitting are further discussed in Section 17.
1.1.2Recommendations
1.1.2.1Geology and Mineral Resources
1.Continue to develop the QA/QC program to ensure that the program includes clearly defined limits when action or follow up is required, and that results are reviewed and documented in a report including conclusions and recommendations regularly and in a timely manner. Continue to work with the Silver Bay laboratory to improve analytical precision. Support primary laboratory results with a check assay program through a secondary laboratory.
2.Improve the turnaround time for exploration drilling samples at the Silver Bay laboratory.
3.Modify the interpolation strategy to see whether local block to composite conformance can be improved.
Cleveland-Cliffs Inc. | Northshore Property, SLR Project No: 138.02467.00001Technical Report Summary - February 7, 2022 3
4.In future updates, use local drill hole spacing instead of a distance-to-drill hole criterion for block classification.
5.Prepare model reconciliation over quarterly periods and document methodology, results, and conclusions and recommendations.
1.1.2.2Infrastructure
1.Prioritize the completion of an Operations, Maintenance and Surveillance (OMS) Manual for the TSF with the Engineer of Record (EOR) in accordance with Mining Association of Canada (MAC) guidelines and other industry recognized standard guidance for tailings facilities.
2.Document, prioritize, track, and close out in a timely manner the remediation, or resolution, of items of concern noted in TSF audits or inspection reports.
3.Establish an External Peer Review Team (EPRT) with experience in tailings management facilities similar to other Cliffs properties.
1.2Economic Analysis
1.2.1Economic Criteria
An un-escalated technical-economic model was prepared on an after-tax discounted cash flow (DCF) basis, the results of which are presented in this subsection. Key criteria used in the analysis are discussed in detail throughout this TRS. General assumptions used are summarized in Table 1-1 with all pellets reported per wet long ton (WLT) pellet.
Table 1-1: Technical-Economic Assumptions
Cleveland-Cliffs Inc. – Northshore Property
| | | | | |
| Description | Value |
| Start Date | December 31, 2021 |
| Mine Life | 48 years |
| Three-Year Trailing Average Revenue | $98/WLT Pellet |
| Operating Costs | $80.06/WLT Pellet |
| Sustaining Capital (after six years) | $4/WLT Pellet |
| Discount Rate | 10% |
| Discounting Basis | End of Period |
| Inflation | 0.0% |
| Federal Income Tax | 20% |
| State Income Tax | None – Sales made out of state |
Table 1-2 is a summary of the estimated mine production over the 48-year mine life.
Cleveland-Cliffs Inc. | Northshore Property, SLR Project No: 138.02467.00001Technical Report Summary - February 7, 2022 4
Table 1-2: LOM Production Summary
Cleveland-Cliffs Inc. – Northshore Property
| | | | | | | | |
| Description | Units | Value |
| ROM Crude Ore | MLT | 822.4 |
| Total Material | MLT | 1,456.2 |
| Grade | % MagFe | 24.6 |
| Annual Mining Rate | MLT/y | 30.0 |
Table 1-3 is a summary of the estimated plant production over the 48-year mine life.
Table 1-3: LOM Plant Production Summary
Cleveland-Cliffs Inc. – Northshore Property
| | | | | | | | |
| Description | Units | Value |
| ROM Material Milled | MLT | 822.4 |
| Annual Processing Rate | MLT/y | 17.0 |
| Process Recovery | % | 29.4 |
| Standard Pellet | MLT | 84.6 |
| Direct Reduced (DR)-Grade Pellet | MLT | 157.1 |
| Total Pellet | MLT | 241.6 |
| Annual Pellet Production | MLT/y | 5.0 |
1.2.2Cash Flow Analysis
The indicative economic analysis results, presented in Table 1-4, indicate an after-tax Net Present Value (NPV), using a 10% discount rate, of $619 million at an average blended wet pellet price of $98/WLT. Internal Rate of Return (IRR) is not applicable since the Plant has been in operation for a number of years. Capital identified in the economics is for sustaining operations and plant rebuilds as necessary.
The economic analysis was performed using the estimates presented in this TRS and confirms that the outcome is a positive cash flow that supports the statement of Mineral Reserves.
Cleveland-Cliffs Inc. | Northshore Property, SLR Project No: 138.02467.00001Technical Report Summary - February 7, 2022 5
Table 1-4: LOM Indicative Economic Results
Cleveland-Cliffs Inc. – Northshore Property
| | | | | | | | |
| Description | $ Millions | $/WLT Pellet |
| Three-Year Trailing Revenue ($/WLT Pellet) | | 98 |
| Pellet Production ($/MWLT) | 241.6 | |
| Gross Revenue | 23,681 | |
| Mining | (4,922) | 20.37 |
| Processing | (10,289) | 42.59 |
| Site Administration | (919) | 3.80 |
| General / Other Costs | (3,217) | 13.30 |
| Total Operating Costs | (19,347) | 80.06 |
| Operating Income (excl. D&A) | 4,335 | 17.94 |
| Federal Income Tax | (867) | (3.59) |
| Depreciation Tax Savings | 252 | 1.04 |
| Accretion Tax Savings | 5.0 | 0.02 |
| Net Income after Taxes | 3,725 | 15.42 |
| Capital | (1,014) | (4.20) |
| Closure Costs | (120.0) | (0.50) |
| Cash Flow | $2,591 | 10.72 |
| NPV 10% | 619 | |
1.2.3Sensitivity Analysis
The operation is nominally most sensitive to market prices (revenues) followed by operating cost. For each dollar movement in sales price and operating cost, respectively, the after-tax NPV changes by approximately $38 million.
1.3Technical Summary
1.3.1Property Description
The Peter Mitchell Mine is located in St. Louis County in Northeast Minnesota, USA, on the Mesabi Iron Range, near the city of Babbitt, Minnesota. The Mine is located approximately 3.5 mi southeast of Babbitt at latitude 47°40'12.15"N and longitude 91°53'1.28"W. The E.W. Davis Works is approximately 40.5 mi to the southeast and immediately adjacent to the city of Silver Bay in Lake County, Minnesota at latitude 47°17'38.95"N and longitude 91°15'23.38"W. The Mine and Plant have the capacity to produce approximately 5.5 MLT dry or 5.6 MLT of wet iron ore pellets annually.
Cliffs controls 28,041 acres of mineral titles and surface rights in the Property through leases and direct ownership through its wholly owned subsidiary, Northshore Mining Company.
Cleveland-Cliffs Inc. | Northshore Property, SLR Project No: 138.02467.00001Technical Report Summary - February 7, 2022 6
1.3.2Accessibility, Climate, Local Resources, Infrastructure, and Physiography
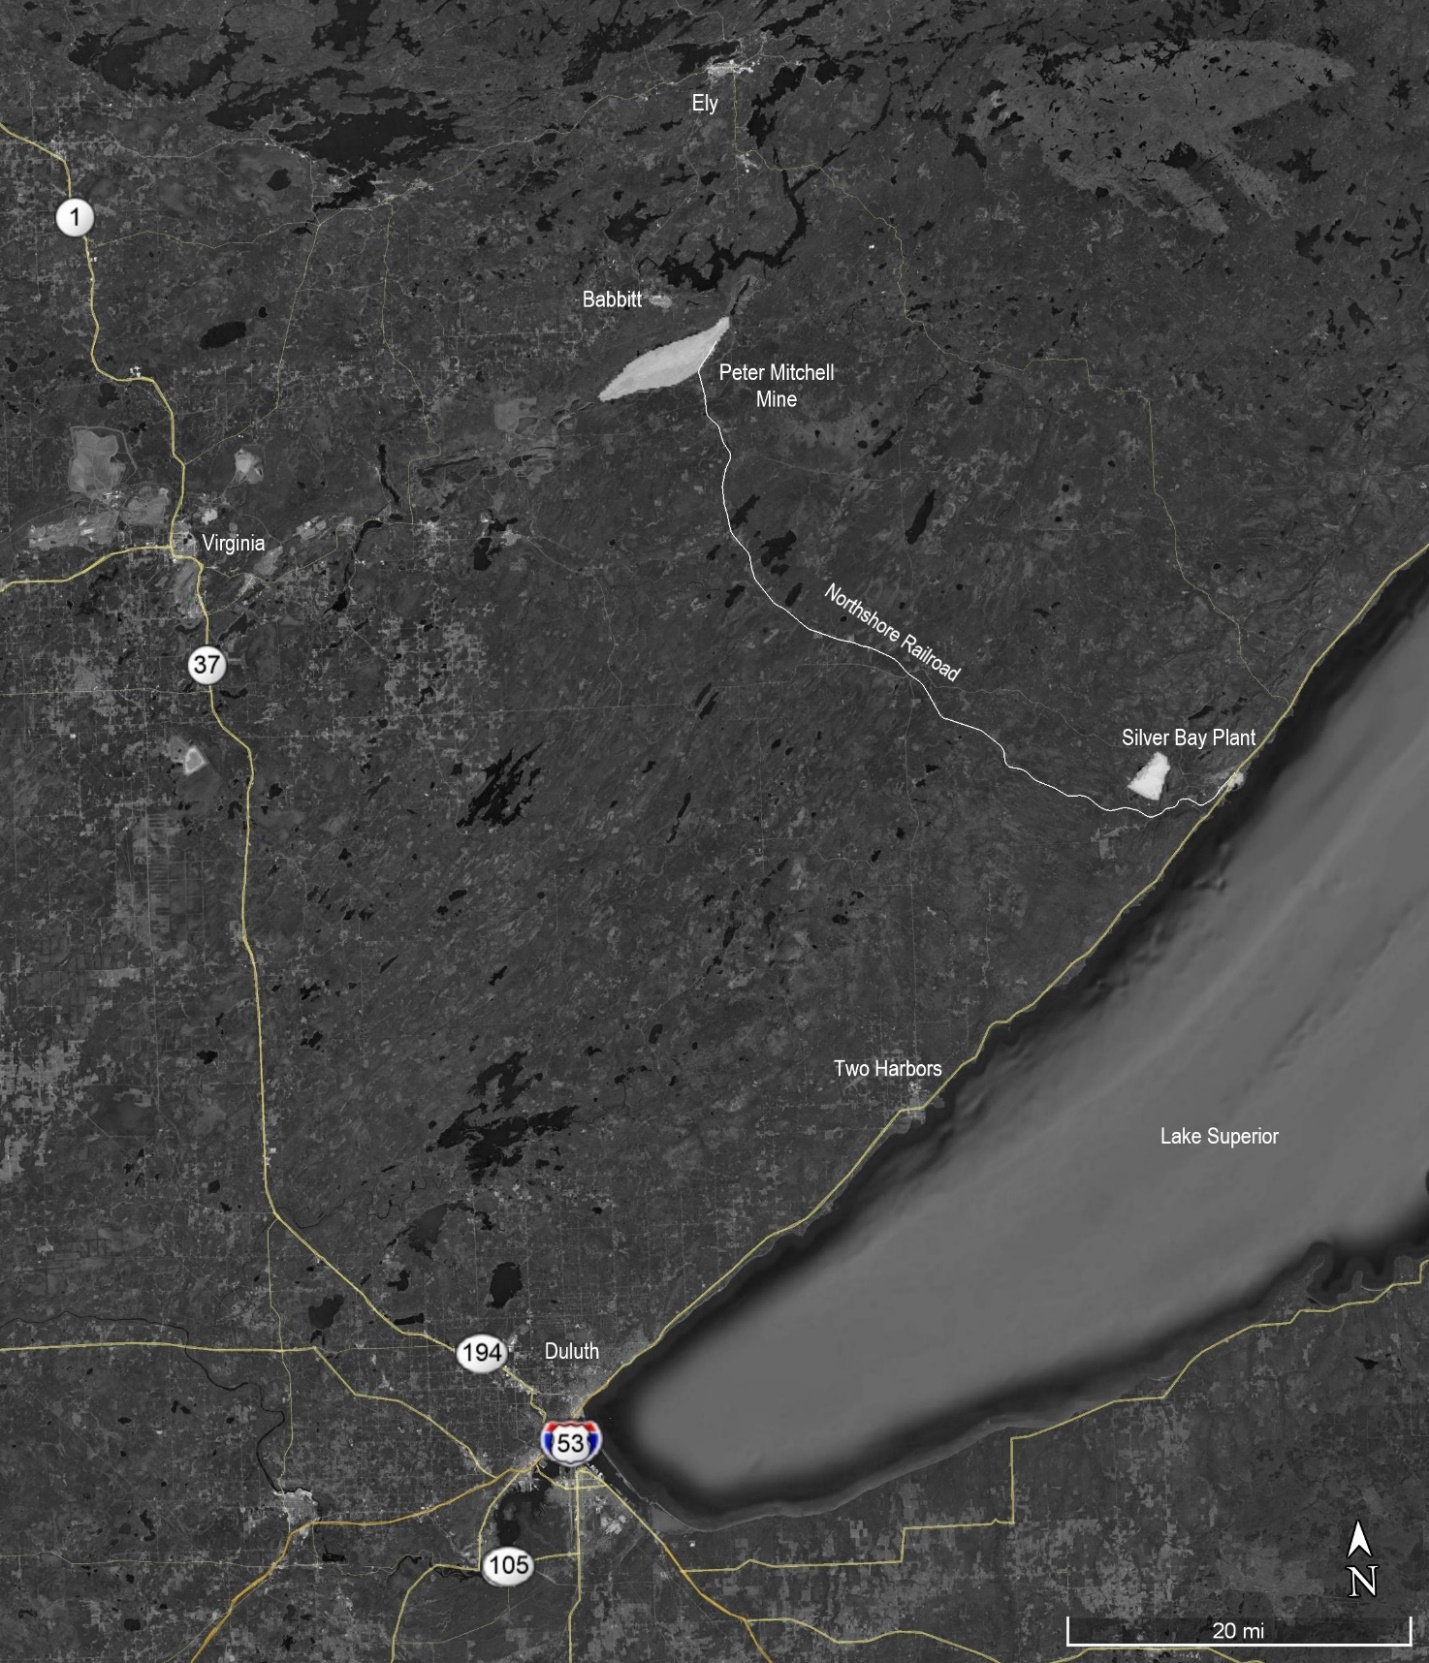
The Mine is accessed from Virginia, Minnesota by traveling north on Highway 53 approximately 3.8 mi to Highway 169 and 6.6 mi east on Highway 169 to County Road 21. The city of Babbitt is located approximately 25 mi east on County Road 21 and about 0.5 mi east on County Road 70. The Mine is located approximately five miles by road southeast of Babbitt and approximately 100 mi by road northeast of Duluth, Minnesota. Duluth has a regional airport with several flights daily to major hubs in Minneapolis and Chicago.
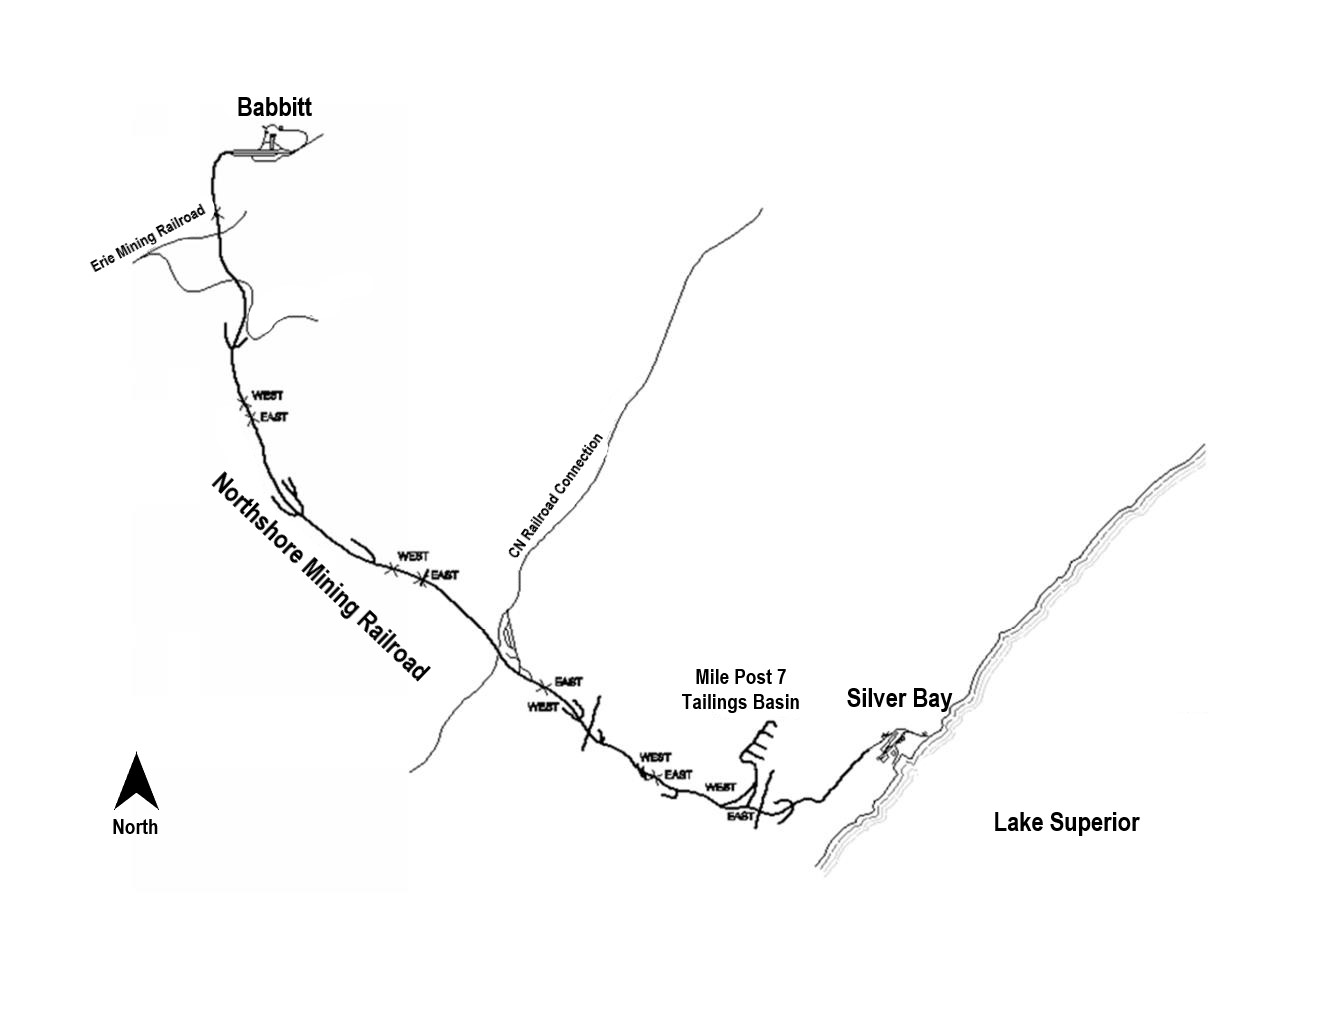
The E.W. Davis Works is located in the city of Silver Bay on Highway 61, approximately 55 mi northeast of Duluth. A 47 mi rail line operated by the Cliffs subsidiary Northshore Mining Railroad runs from the Mine south to the Plant.
The climate in Northern Minnesota ranges from mild in the summer to winter extremes. The annual average temperature is 36.9oF. The annual average high temperature is 48.6°F, whereas the annual average low temperature is 25.1°F. July is on average the hottest month (77°F) with January being the coldest (-4°F).
The operation employs 605 personnel who live in the surrounding cities of Silver Bay, Two Harbors, Babbitt, and Ely. Personnel also commute from Duluth and from the Iron Range. Lake and St. Louis Counties have an estimated combined population of 211,000 people.
The Property is located in a historically important, iron-producing region of Northeastern Minnesota. All infrastructure necessary to mine and process significant commercial quantities of iron ore is currently in place. Infrastructure items include high voltage electrical supplies, natural gas pipelines that connect into the North American distribution system, water sources, paved roads and highways, railroads for transporting ROM crude ore and finished products, port facilities that connect into the Great Lakes, and accommodations for the employees.
The Mine is located at an elevation of approximately 1,600 ft above sea level (fasl). The Plant is located adjacent to Lake Superior at approximately 600 fasl. The topography in the area is characterized by hummocky hills and long, gentle moraines that are remnants of glacial ingress and egress. The landscape ranges from semi-rugged, lake-dotted terrain with thin glacial deposits over bedrock, to hummocky or undulating plains with deep glacial drift, to large, flat, poorly drained peatlands. The Minnesota Department of Natural Resources characterizes the area as being within the Laurentian Mixed Forest Province (LMF) with broad areas of conifer forest, mixed hardwood and conifer forests, and conifer bogs and swamps.
1.3.3History
The first documented mineral exploration program in the eastern Mesabi Iron Range could be attributed to Peter Mitchell, who excavated a six-foot-deep pit near the present Peter Mitchell Mine in 1871.
Historically, “direct-ship ore” (DSO) iron mines farther west on the Mesabi Range supplied iron ore to the industrializing US steel makers until those DSO deposits began to exhaust by the end of the Second World War. However, the potential for mining low-grade magnetite deposits, regionally known as taconite deposits, was recognized early in the 20th century. The first owner/operator of the Peter Mitchell Mine was the Mesabi Iron Company from 1922 to 1924, which installed and operated an experimental processing facility from 1916 to 1924.
Cleveland-Cliffs Inc. | Northshore Property, SLR Project No: 138.02467.00001Technical Report Summary - February 7, 2022 7
In 1939, Reserve Mining was organized and acquired a lease from the Mesabi Iron Company. Reserve Mining built large-scale mining facilities in Babbitt and the processing plant in Silver Bay during the mid-1950s, which the company operated at various production rates until declaring bankruptcy in 1986.
Cyprus purchased the facilities in 1989 and renamed it Cyprus Northshore Mining Company. Cyprus subsequently sold that company to Cliffs in 1994 and Cliffs renamed it Northshore Mining Company. Northshore Mining Company, a wholly owned subsidiary of Cliffs, is the current operator of the Mine, Northshore Mining Railroad, and the E.W. Davis Works.
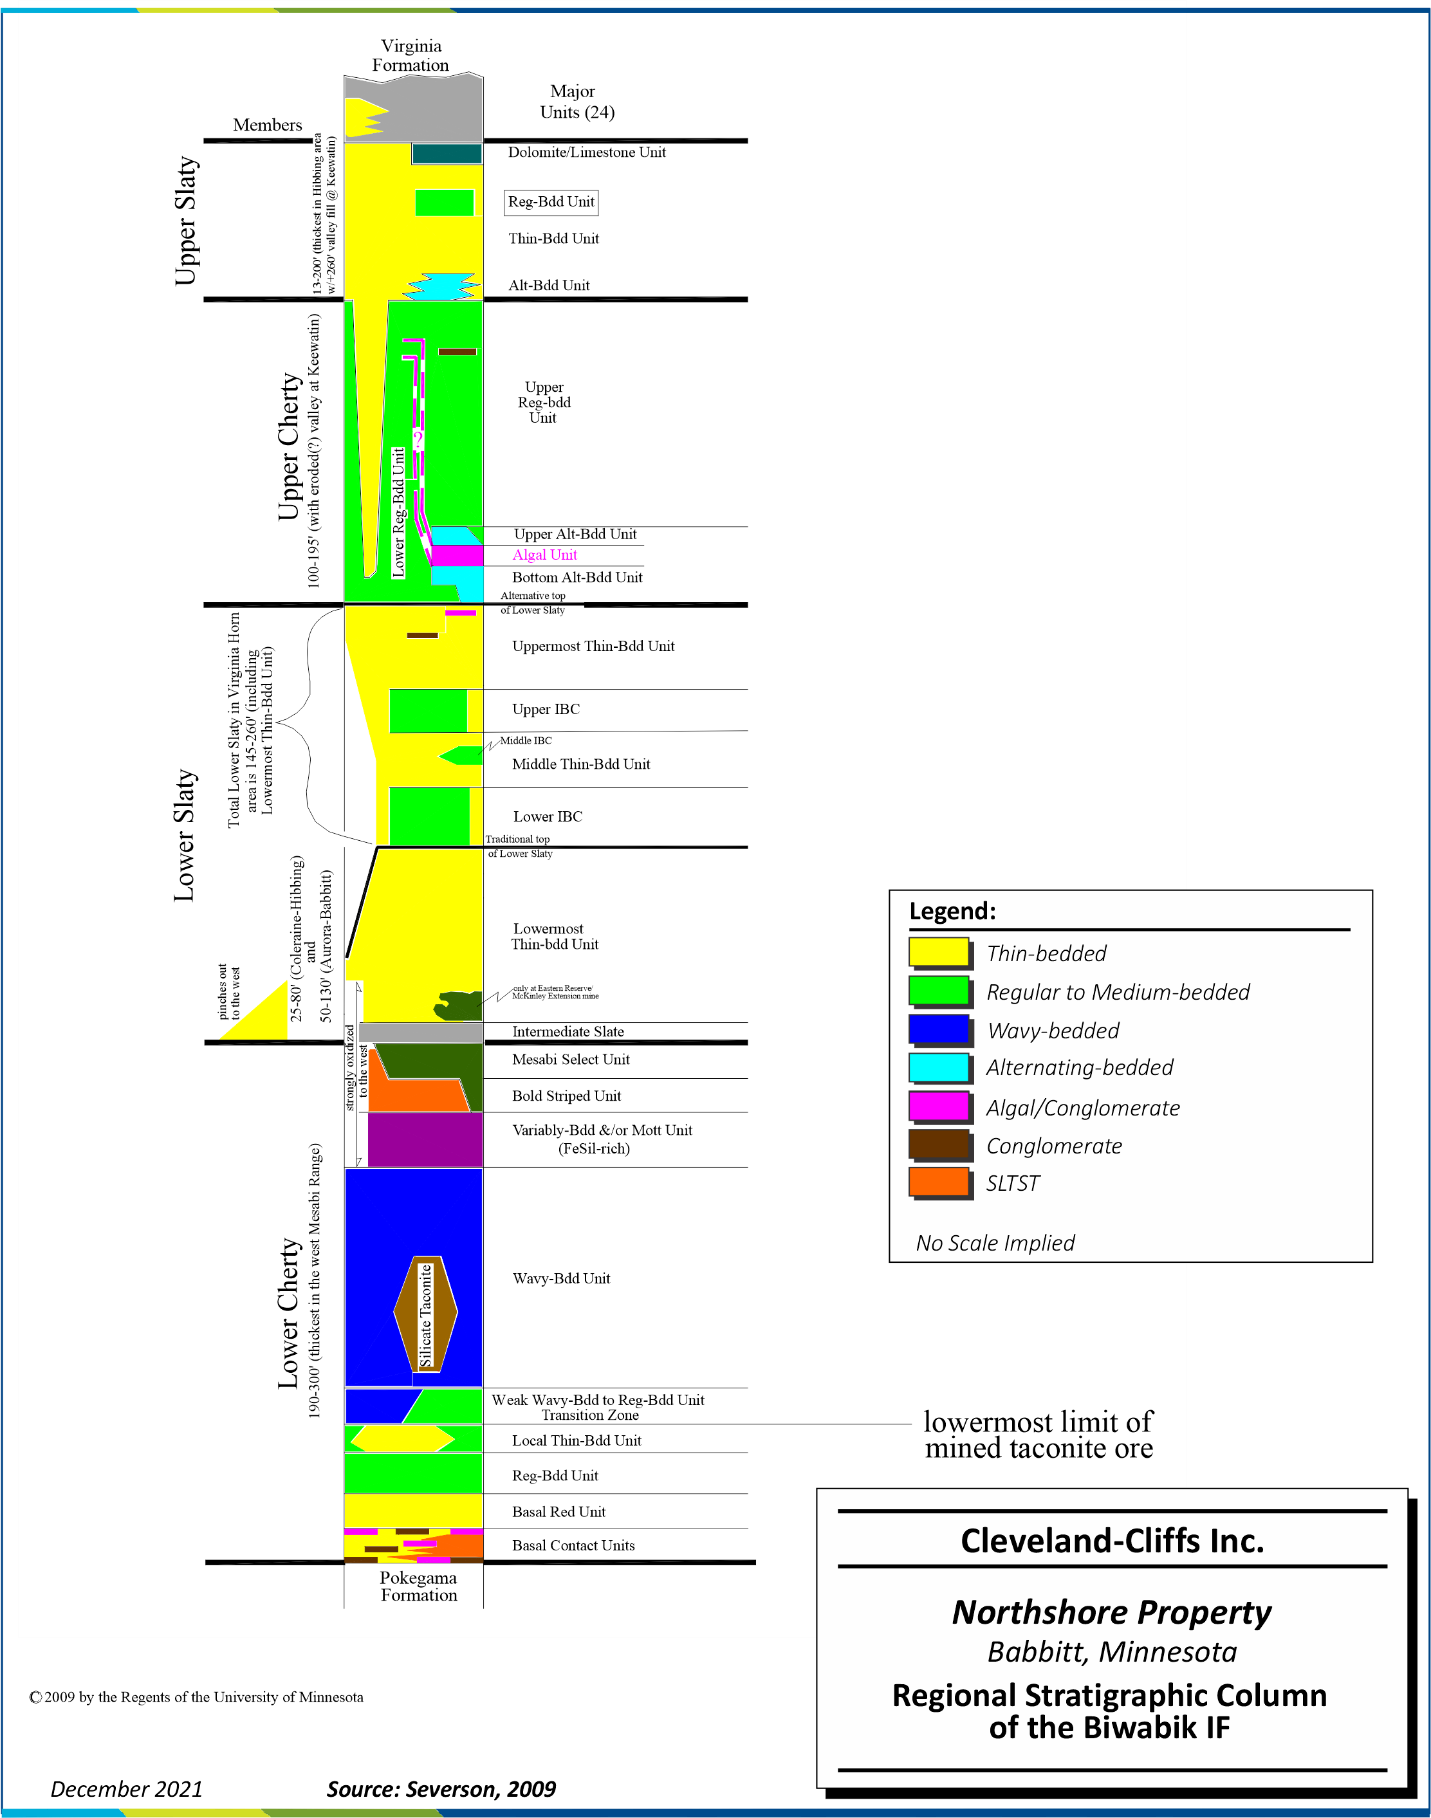
1.3.4Geological Setting, Mineralization, and Deposit
The Northshore deposit is an example of Superior-type banded iron formation (BIF) deposit, specifically the Biwabik IF, which is interpreted to have been deposited in a shallow, tidal marine setting and is characterized as having four main members (from bottom to top): Lower Cherty, Lower Slaty, Upper Cherty, and Upper Slaty. “Cherty” lithologies generally have a sandy granular texture, are thickly bedded, and are composed of silica and iron oxide minerals. “Slaty” lithologies are fine grained, thinly bedded, and comprised of iron silicates and iron carbonates, with local chert beds, and are typically uneconomic. The mineral of economic interest at Northshore is magnetite. SLR notes that nomenclature of the members is not indicative of metamorphic grade; instead slaty and cherty are colloquial descriptive terms used regionally.
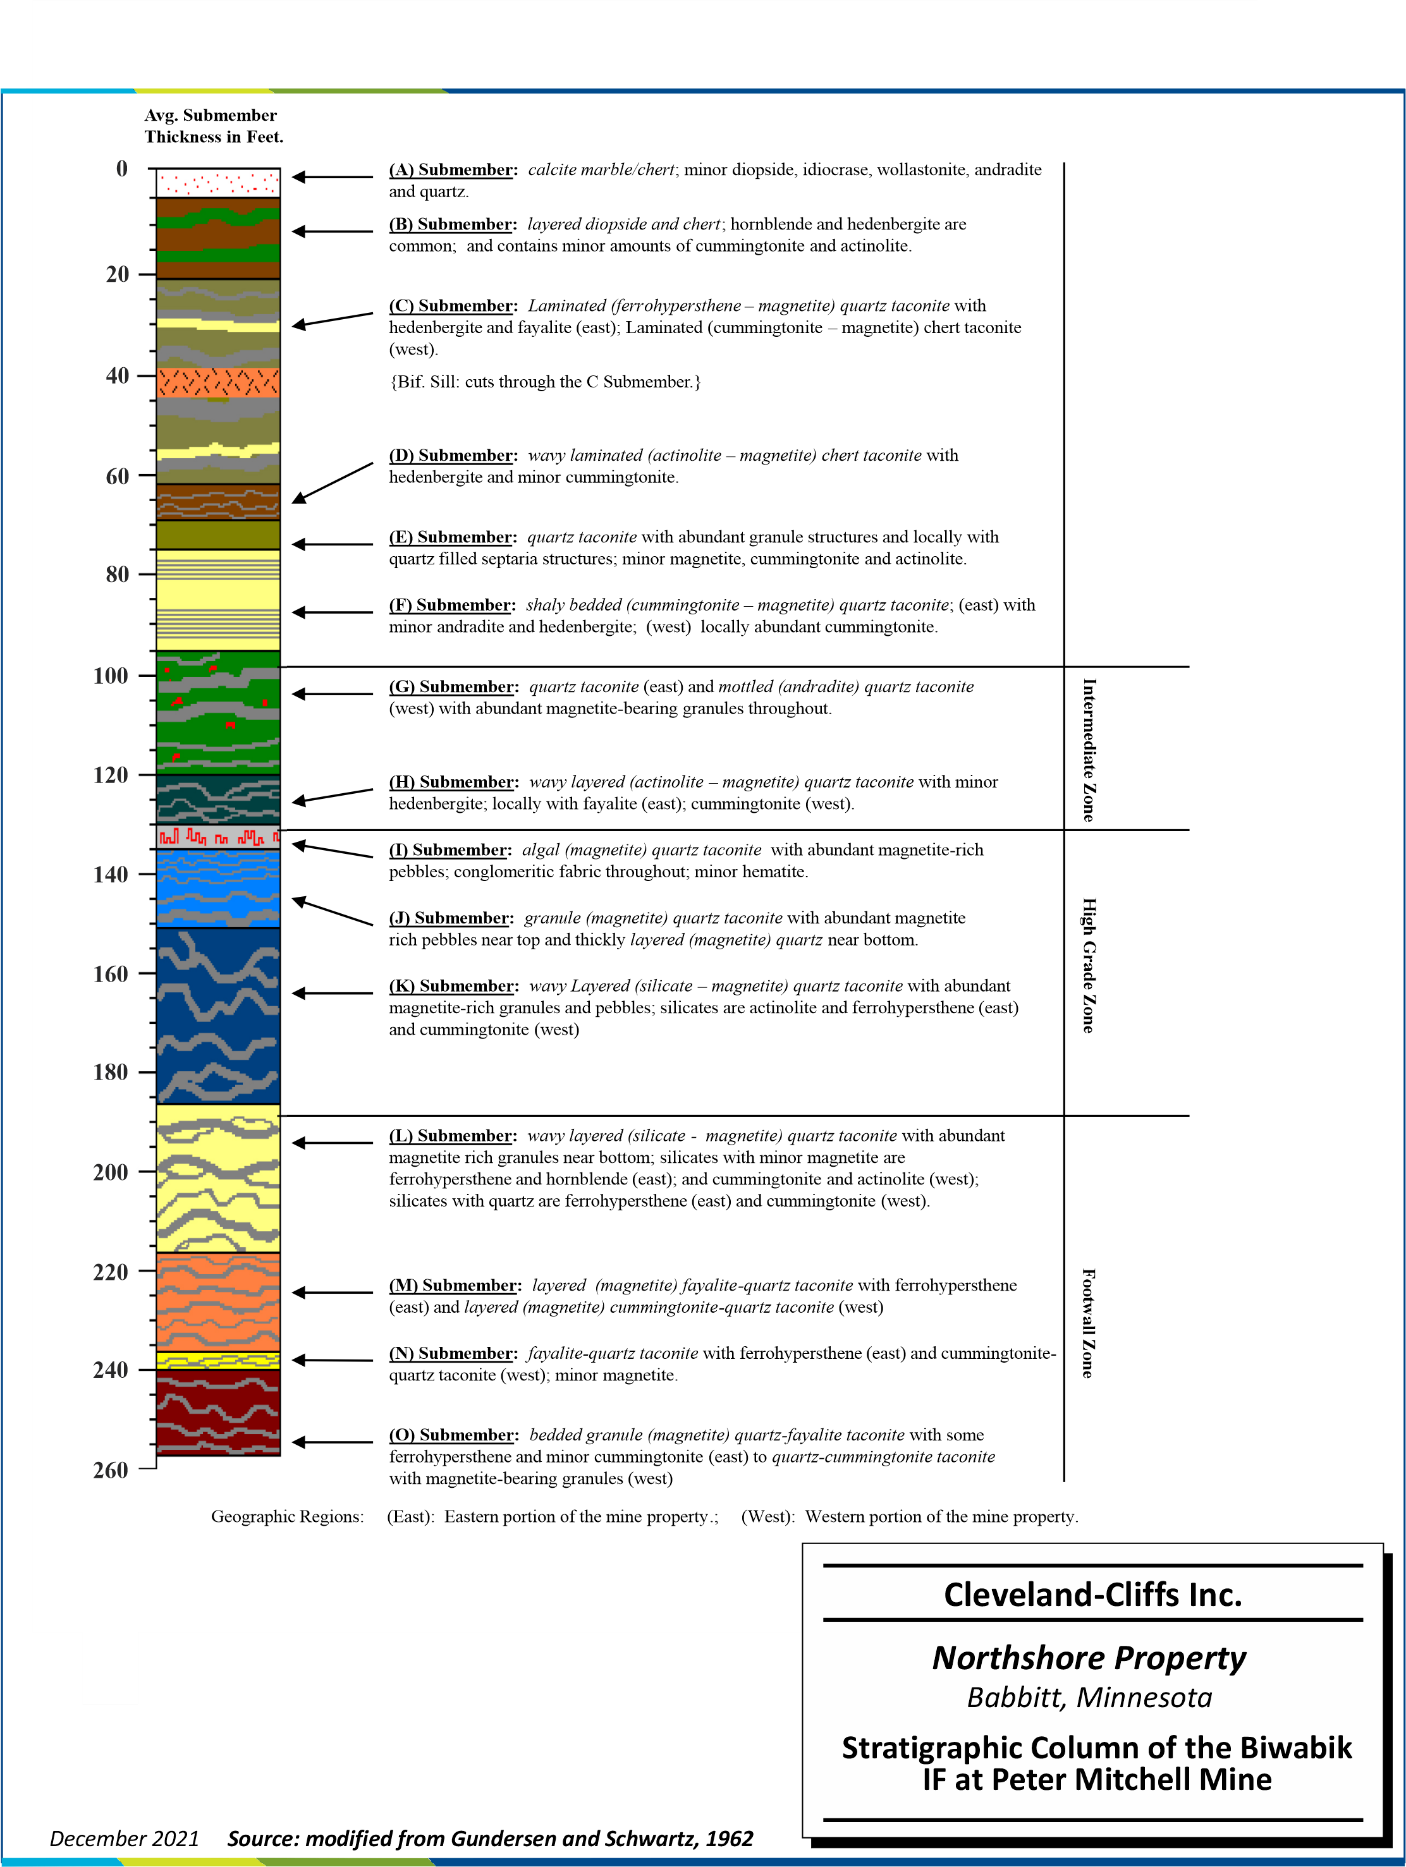
Mineralization at the Mine is hosted within subunits of the Biwabik IF, near its easternmost extent. In the Mine area, bedding dips from approximately 5° southeast in the west to 35° southeast near the contact with the Duluth Gabbro Complex to the east. Only the Upper Cherty member and much lesser fractions of adjacent members are mined at Northshore. The Upper Cherty member averages 160 ft in thickness, considerably thinner than equivalent stratigraphy of the Biwabik IF in the western Mesabi Range.
Magnetite is the principal economic mineral at the Mine, and it occurs dominantly in thin to thick bands and layers, as medium to coarse disseminated grains, and as grain aggregates. Magnetic iron content ranges from 22% to 30% in the mineralized stratigraphic subunits. Local variation in silicate mineralogy and lithologic textures due to contact metamorphism, where proximal to the Duluth Gabbro Complex, presents unique challenges for grade control relative to deposits hosted in the western Biwabik IF.
1.3.5Exploration
No exploration work or investigations other than drilling have been conducted or are planned for Northshore. Drilling campaigns have been and are undertaken on a general grid of 250 ft x 250 ft or 250 ft x 500 ft. The drill holes are located on a local mine grid that is based on the strike of the deposit. To date, 4,141 drill holes have been completed over the Property.
1.3.6Mineral Resource Estimates
Mineral Resource block models for the Northshore deposit were prepared by Cliffs in June 2020 and audited and accepted by SLR. The Mineral Resource block model is based on the following drill hole information:
•4,085 diamond drill holes totaling 713,129 ft from 1946 to 2019 and containing 113,203 assays.
Cleveland-Cliffs Inc. | Northshore Property, SLR Project No: 138.02467.00001Technical Report Summary - February 7, 2022 8
A stratigraphic model representing the Biwabik IF was constructed in Maptek’s Vulcan™ (Vulcan) software through the creation of wireframe surfaces representing the upper contact of each unit. Sub-blocked model estimates, also prepared in Vulcan, used inverse distance squared (ID2) and length-weighted, five-foot, uncapped composites to estimate relevant analytical variables in two, progressively larger search passes, using hard boundaries between subunits, ellipsoidal search ranges, and orientation informed by geology. Average density values were assigned by lithological unit.
Mineral Resources were classified in accordance with the definitions for Mineral Resources in S-K 1300. Class assignment was based on criteria developed using continuity models (variograms), grade ranges for key economic variables (KEV), and geological understanding, and was accomplished using scripts that reference the distance of a block centroid to a drill hole sample, and distance buffers.
Wireframe and block model validation procedures including statistical comparisons with composite samples and parallel nearest neighbor (NN) estimates, swath plots, as well as visual reviews in cross-section and plan were completed. A visual review comparing the block model to drill holes completed following the block modeling work was performed to ensure general lithologic and analytical conformance.
The limit of Mineral Resources was optimized using a pit shell that considered the 2020 forecast mining cost for Northshore, Northshore lease boundaries, and a US$90/LT pellet value. The Northshore Mineral Resource estimate as of December 31, 2021, is presented in Table 1-5.
Table 1-5: Summary of Northshore Mineral Resources - December 31, 2021
Cleveland-Cliffs Inc. – Northshore Property
| | | | | | | | | | | | | | |
| Resource
(MLT) | MagFe
(%) | Process Recovery
(%) | Wet Pellets
(MLT) |
| Measured | 766.7 | 22.1 | 25.5 | 195.3 |
| Indicated | 390.8 | 22.4 | 26.4 | 103.1 |
| M&I | 1,157.5 | 22.2 | 25.8 | 298.4 |
| Inferred | 13.6 | 19.8 | 22.5 | 3.1 |
Notes:
1.Tonnage is reported in long tons equivalent to 2,240 lb.
2.Tonnage is reported exclusive of Mineral Reserves and has been rounded to the nearest 100,000.
3.Mineral Resources are estimated at a cut-off grade of 15% MagFe.
4.Mineral Resources are estimated using a pellet value of US$90/LT.
5.Process recovery is reported as the percent mass recovery to produce two thirds DR-grade wet pellets containing 67% Fe and 2% silica, and one third standard wet pellets containing 65% Fe; shipped pellets average approximately 2.2% moisture.
6.Tonnage estimate based on depletion from a surveyed topography on December 21, 2020.
7.Resources are crude ore tons as delivered to the primary crusher; pellets are as loaded onto lake freighters at Silver Bay, Minnesota.
8.Classification of Mineral Resources is in accordance with the S-K 1300 classification system.
9.Bulk density is assigned based on average readings for each lithology type.
10.Mineral Resources are 100% attributable to Cliffs.
11.Mineral Resources that are not Mineral Reserves do not have demonstrated economic viability.
12.Numbers may not add due to rounding.
The SLR QP is of the opinion that, with consideration of the recommendations summarized in this section, any issues relating to all relevant technical and economic factors likely to influence the prospect of economic extraction can be resolved with further work.
Cleveland-Cliffs Inc. | Northshore Property, SLR Project No: 138.02467.00001Technical Report Summary - February 7, 2022 9
1.3.7Mineral Reserve Estimate
Mineral Reserves in this TRS are derived from the Mineral Resources. The Mineral Reserves are reported as crude ore and are based on open pit mining. Crude ore is the unconcentrated ore as it leaves the mine at its natural in situ moisture content. The Proven and Probable Mineral Reserves for Northshore are estimated as of December 31, 2021, and summarized in Table 1-6.
Table 1-6: Summary of Northshore Mineral Reserves - December 31, 2021
Cleveland-Cliffs Inc. – Northshore Property
| | | | | | | | | | | | | | |
| Category | Crude Ore
Mineral Reserves
(MLT) | Crude Ore
MagFe (%) | Process Recovery
(%) | Wet Pellets
(MLT) |
| Proven | 303.2 | 25.3 | 30.3 | 92.0 |
| Probable | 519.2 | 24.1 | 28.8 | 149.6 |
| Proven & Probable | 822.4 | 24.6 | 29.4 | 241.6 |
Notes:
1.Tonnage is reported in long tons equivalent to 2,240 lb and has been rounded to the nearest 100,000.
2.Mineral Reserves are reported at a $90/LT wet standard pellet price freight-on-board (FOB) Lake Superior, based on the three-year trailing average of the realized product revenue rate.
3.Mineral Reserves are estimated at a cut-off grade of 19% MagFe or when mineralization concentrates to less than 63.5% Fe (Conc_Fe) or when the Grindability is less than 30.0.
4.Mineral Reserves include global mining dilution of 3% and mining extraction losses of 2% in addition to 33% mining extraction losses for intermediate crude ore.
5.The Mineral Reserve mining strip ratio (waste units to crude ore units) is at 0.8.
6.Mineral Reserves are Probable if not scheduled within the first 20 years.
7.Process recovery is reported as the percent mass recovery to produce two thirds DR-grade wet pellets containing 67% Fe and 2% Silica, and one third standard wet pellets containing 65% Fe; shipped pellets average approximately 2.2% moisture.
8.Tonnage estimate is based on actual depletion as of December 31, 2021 from a December 21, 2020 topographic survey.
9.Mineral Reserve tons are as delivered to the primary crusher; pellets are as loaded onto lake freighters at Silver Bay, Minnesota.
10.Classification of Mineral Reserves is in accordance with the S-K 1300 classification system.
11.Mineral Reserves are 100% attributable to Cliffs.
12.Numbers may not add due to rounding.
The pellet price used to perform the evaluation of the Mineral Reserves was based on the current mining model three-year trailing average of the realized product revenue rate of US$90.42/LT wet standard pellet. The saleable product (i.e., DR-grade pellets and standard pellets) mix may vary depending on market considerations and internal requirements. Total saleable product is within the range of 230 MLT (assuming all DR-grade pellets) and 271 MLT (assuming all standard pellets). The costs used in this study represent all mining, processing, transportation, and administrative costs, including the loading of pellets into lake freighters at Silver Bay, Minnesota.
SLR is not aware of any risk factors associated with, or changes to, any aspects of the modifying factors such as mining, metallurgical, infrastructure, permitting, or other relevant factors that could materially affect the Mineral Reserve estimate.
1.3.8Mining Methods
The Northshore deposit is mined using conventional surface mining methods. The surface operations include:
Cleveland-Cliffs Inc. | Northshore Property, SLR Project No: 138.02467.00001Technical Report Summary - February 7, 2022 10
•Overburden (glacial till) removal
•Drilling and blasting
•Loading and haulage
•Crushing and rail loading
The Mineral Reserve is based on the ongoing, annual crude ore production of 16 MLT to 18 MLT producing a total of approximately 5.1 MLT of wet pellets for domestic consumption. There are no current plans for expansion at Northshore.
Mining and processing operations are scheduled 24 hours per day, and the mine production is scheduled to directly feed the processing operations.
The current LOM plan has mining scheduled for 48 years and mines the known Mineral Reserve. The average strip ratio is approximately 0.8 waste units to 1 crude ore unit (0.8 strip ratio).
The Northshore final pit is a single pit approximately 10.5 mi along strike and up to 1.2 mi wide. The final pit is relatively shallow at up to 420 ft deep and, structurally, the in situ crude ore and rock is of good quality. In 2019, SRK Consulting in Denver, Colorado conducted a geotechnical study to assess the global stability of the final pit wall configuration. SLR is of the opinion that the design parameters used for the final pit design are reasonable.
The mine’s operation has a strict crude ore blending requirement to ensure the Plant receives a uniform head grade. The most important blending characteristics of the crude ore are the MagFe, Conc_Fe, and ore hardness (i.e., Grindability). Generally, three crude ore loading points from different subunit groupings (i.e., the Intermediate, High Grade, Footwall Group, and Lower Cherty subunit groupings) are mined at one time to obtain the best blend for the Plant.
Crude ore is hauled to the crushing facility and either direct-tipped to the primary crusher or stockpiled in an area adjacent to the primary crusher. Haul trucks are alternated to blend delivery from the multiple crude ore loading points. The crude ore stockpiles are used as an additional source for blending and production efficiency. Crushed crude ore is conveyed to a silo, where it is loaded into 85-ton rail cars for transport to the Plant located 47 mi southeast of the Mine at Silver Bay, Minnesota. Waste rock is hauled to one of the many waste stockpiles within and around the pit.
The major pieces of pit equipment include electric drills, electric rope shovels, haul trucks, front-end loaders, bulldozers, and graders. Extensive maintenance facilities are available at the mine site to service the mine equipment
1.3.9Processing and Recovery Methods
The mine and primary and secondary crushing plant are located in Babbitt, Minnesota, and the tertiary and quaternary crushing plant is located in Silver Bay, Minnesota. Crude ore blending is accomplished through the proper selection of the blast sites at the mine and truck deliveries to the primary crusher. Mine haul trucks dump the crude material directly into a primary gyratory crusher. The primary-crushed material falls directly into the four, secondary gyratory crushers, located directly beneath the primary crusher, and is crushed to a nominal four inches. The nominal four-inch material is then loaded into trains and transported 47 mi to Silver Bay, Minnesota, where the tertiary and quaternary crushing plant, the concentrator, and pellet plant are located.
Cleveland-Cliffs Inc. | Northshore Property, SLR Project No: 138.02467.00001Technical Report Summary - February 7, 2022 11
Upon arriving at Silver Bay, the secondary crushed crude material is dumped from the rail cars by automated two-car dumpers and crushed in tertiary and quaternary cone crushers and then passed over double-drum dry cobbers for primary magnetic separation.
The fine crusher product is processed in 17 separate rod mill - ball mill grinding and magnetic separation sections or lines and three partial scavenging sections to produce a final concentrate product. The layouts of all 17 sections are similar, with some minor differences in equipment from one section to another. Two products are made in the concentrator – standard concentrate, which targets a pellet silica content of 4.8%, and DR-grade concentrate, which targets a lower pellet silica content of 2%.
Crushed ore from the quaternary crushing station is treated in double-drum dry cobbers. The cobber concentrate is sent to rod mills by belt conveyors, whereas the cobber tails are hauled by rail and discarded as coarse final tails. The cobber concentrate has a MagFe target of 28.5%.
The magnetic cobber concentrate is fed to the rod mills, which are operated in an open-circuit configuration. The rod mill discharge is treated in rougher, low-intensity drum magnetic separators. The resulting magnetic rougher concentrate is pumped to two parallel ball mills in closed circuit with cyclones to produce a final grind of 90% passing 325 mesh (45 micron). The cyclone overflow is fed to two parallel primary hydroseparators. The primary hydroseparator overflow, composed mainly of silica particles, discharges to the tailings launder. The heavy primary hydroseparator underflow product is pumped to two stages of screens, with the screen undersize reporting to the finisher hydroseparator.
The finisher hydroseparator overflow is discharged to tailings, and the underflow is pumped to two, parallel, double-drum finisher magnetic separators. The finisher magnetic separator tails are discharged to tailings, and the concentrate is pumped to flotation. The flotation concentrate is thickened to a target density in the flotation hydroseparator to produce the final iron concentrate product. The flotation hydroseparator overflow is discharged to tailings, and the concentrate is sent to the concentrate thickener and then to the vacuum disc filtration circuit for final dewatering. Filter cake at 9.5% moisture is transported by belt conveyors to the pellet plant concentrate bins. Standard final concentrate has an iron grade of approximately 68% Fe. DR-grade final concentrate has an iron grade of approximately 70% Fe.
The concentrate is rolled in balling drums to produce green balls. The green pellet roll screens at the discharge of the balling drums are set to produce a green ball product. Travelling-grate furnaces are used for drying, preheating, and firing the pellets.
1.3.10Infrastructure
The Property is located in a historically important, iron-producing region of Northeastern Minnesota. All the infrastructure necessary to mine and process significant commercial quantities of iron ore is currently in place.
Infrastructure items include:
•Peter Mitchell Mine facilities in Babbitt, Minnesota.
•E.W. Davis plant facilities in Silver Bay, Minnesota.
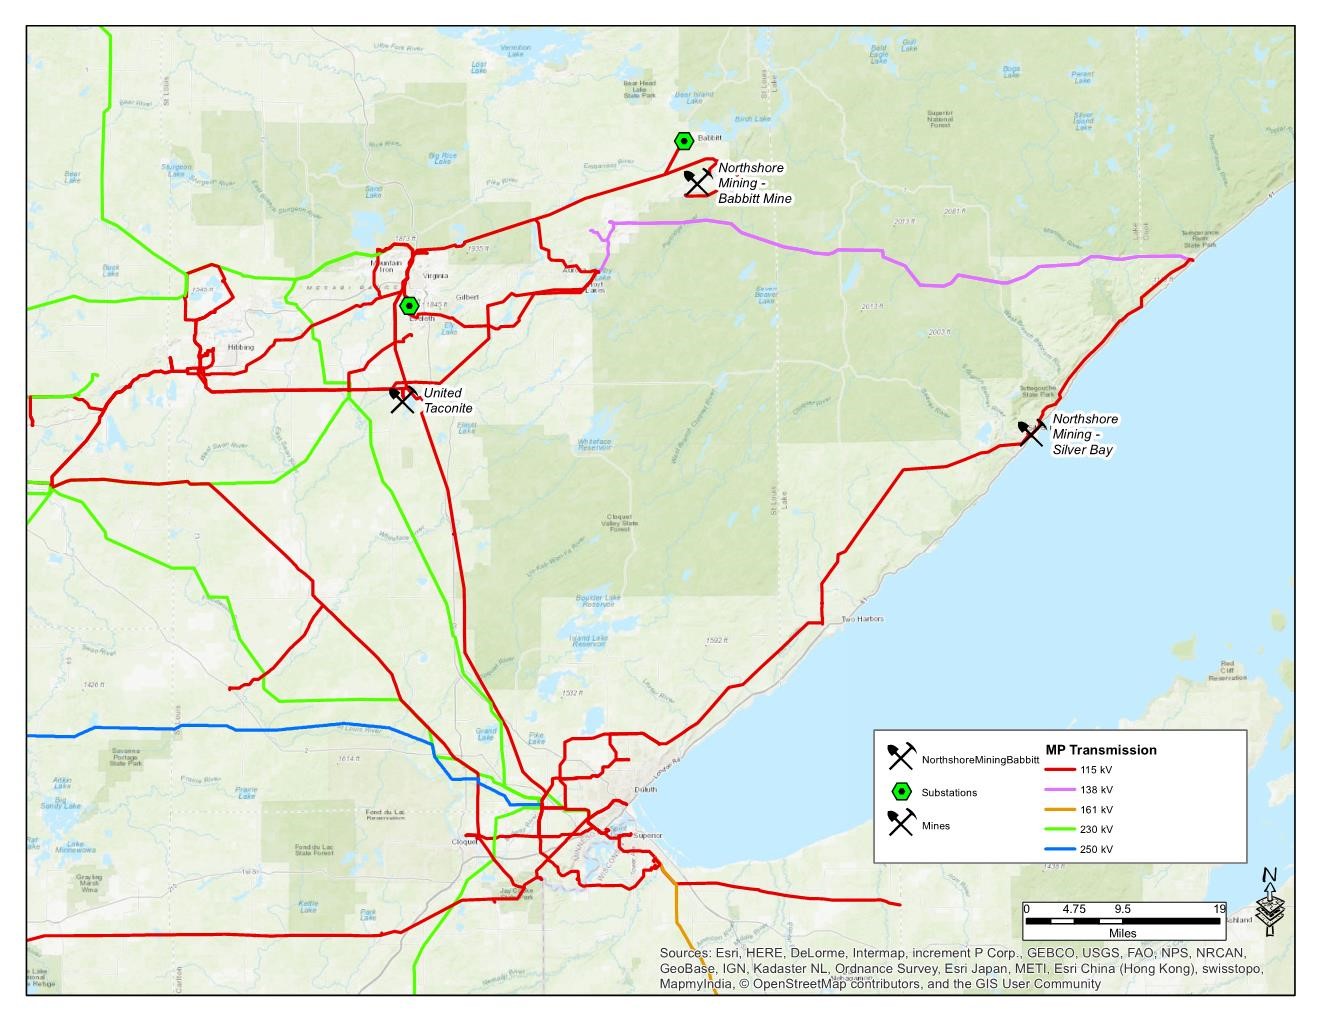
•Power supplied by Minnesota Power.
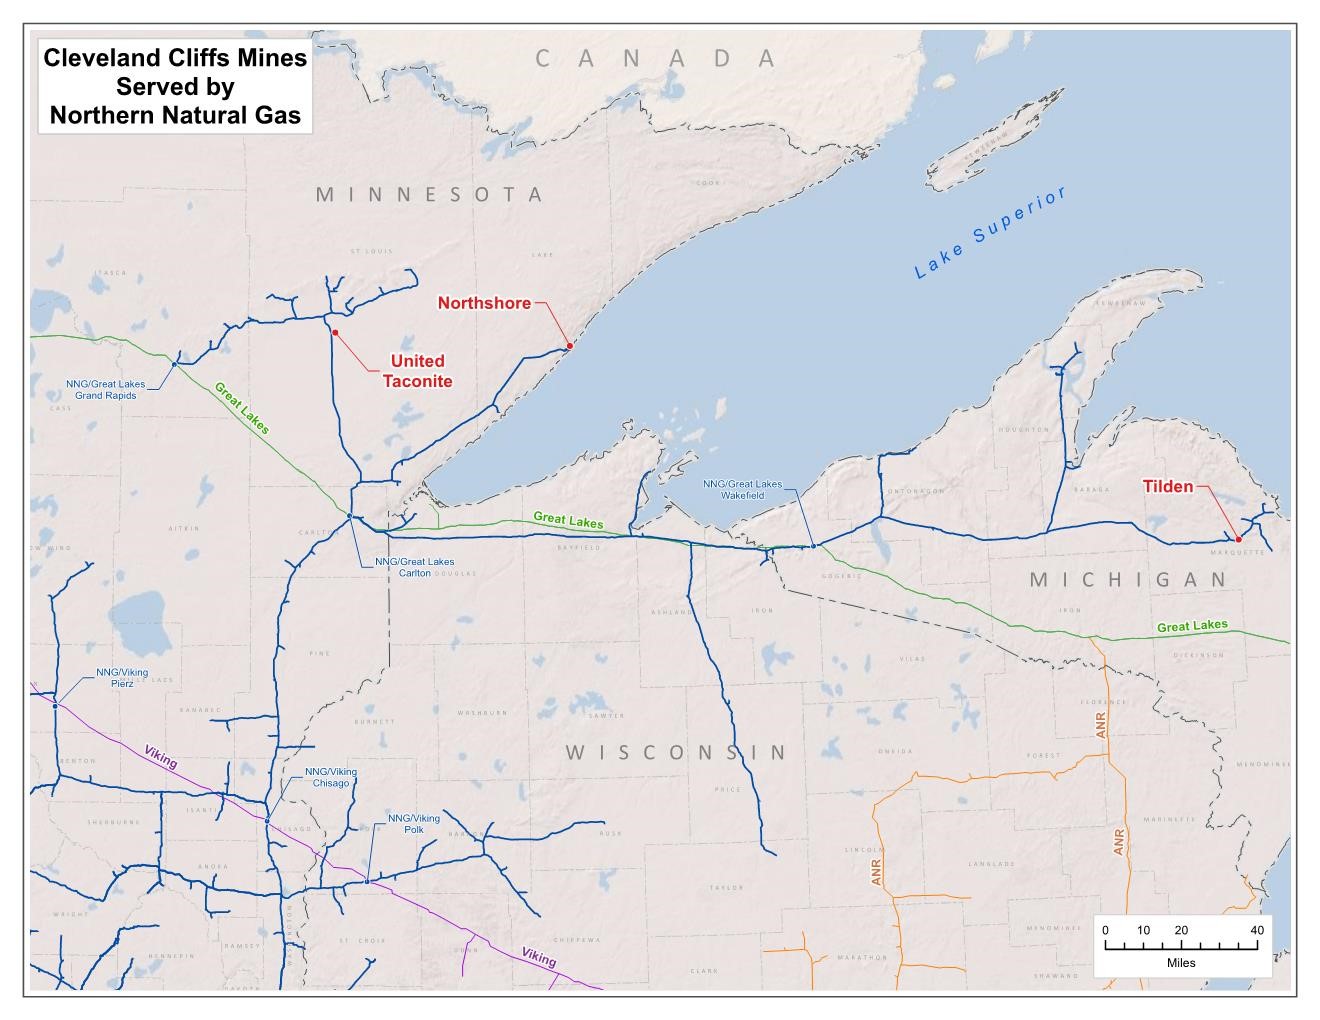
•Natural gas supplied by Northern Natural Gas from pipelines that connect into the North American distribution system.
Cleveland-Cliffs Inc. | Northshore Property, SLR Project No: 138.02467.00001Technical Report Summary - February 7, 2022 12
•Fresh water sourced from Lake Superior.
•Paved roads and highways.
•Cliffs-owned Northshore Mining Railroad comprising unit trains for transporting crushed crude ore from Babbitt to Silver Bay and tailings to the Milepost 7 TSF.
•Rail yards and workshops for maintaining the rail equipment.
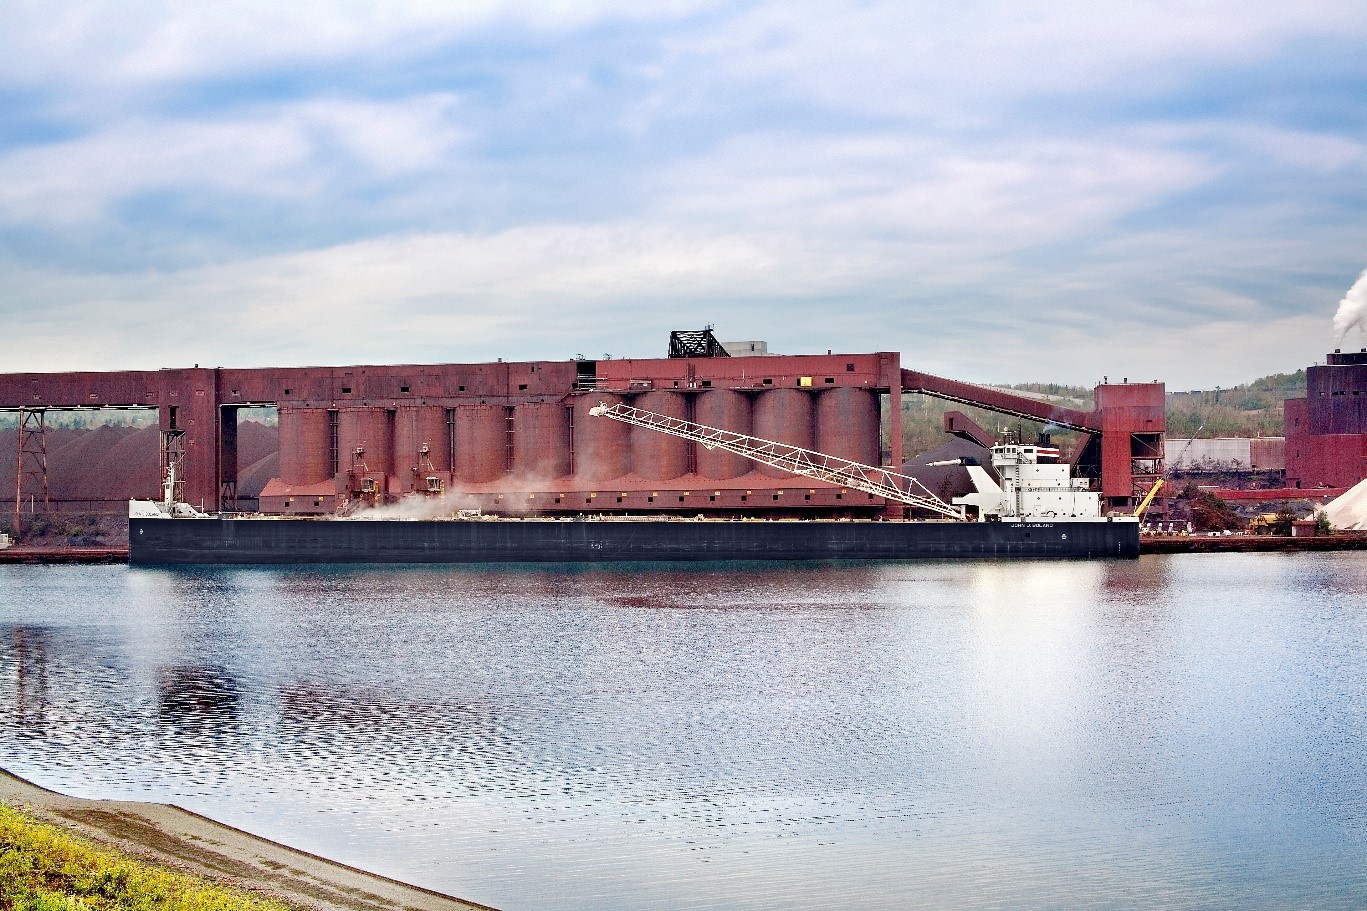
•Port facilities, including pellet storage stockpiles, short-term vessel loading bins, and ship loaders for loading 60,000 LT-capacity Lakers that transport pellets to steel mills on the Great Lakes.
•Accommodations for employees.
•Local and State infrastructure also includes hospitals, schools, airports, equipment suppliers, fuel suppliers, commercial laboratories, and communication systems.
1.3.11Market Studies
Cliffs is the largest producer of iron ore pellets in North America. It is also the largest flat-rolled steel producer in North America. In 2020, Cliffs acquired two major steelmakers, ArcelorMittal USA (AMUSA), and AK Steel (AK), vertically integrating its legacy iron ore business with steel production and emphasis on the automotive end market.
Cliffs owns or co-owns five active iron ore mines in Minnesota and Michigan. Through the two acquisitions and transformation into a vertically integrated business, the iron ore mines are primarily now a critical source of feedstock for Cliffs’ downstream primary steelmaking operations. Based on its ownership in these mines, Cliffs’ share of annual rated iron ore production capacity is approximately 28.0 million tons, enough to supply its steelmaking operations and not have to rely on outside supply.
The importance of the steel industry in North America and specifically the USA is apparent by the actions of the US federal government by implementing and keeping import restrictions in place. It is important for middle-class job generation and the efficiency of the national supply chain. It is also an industry that supports the country’s national security by providing products used for US military forces and national infrastructure. Cliffs expects the US government to continue recognizing the importance of this industry and does not see major declines in the production of steel in North America.
Northshore pellets are shipped to Cliffs’ steelmaking facilities in the Midwestern USA.
For cash flow projections, Cliffs uses a blended pellet revenue rate of $98/WLT Free on Board (FOB) Mine based on a three-year trailing average for 2017 to 2019. Based on macroeconomic trends, SLR is of the opinion that Cliffs pellet prices will remain at least at the current three-year trailing average of $98/WLT or above for the next five years.
1.3.12Environmental Studies, Permitting and Plans, Negotiations, or Agreements with Local Individuals or Groups
NSM indicated that it presently has the requisite operating permits for the Mine and Plant and estimates that the mine life will be 48 years. Environmental monitoring during operations includes water- and air-quality monitoring. Closure plans and other post-mining plans are required to be prepared within two years of anticipated closure. Cliffs indicated that it conducts an in-depth review every three years to ensure that the Asset Retirement Obligation (ARO) legal liabilities are accurately estimated based on current laws, regulations, facility conditions, and cost to perform services. These cost estimates are
Cleveland-Cliffs Inc. | Northshore Property, SLR Project No: 138.02467.00001Technical Report Summary - February 7, 2022 13
conducted in accordance with the Financial Accounting Standards Board (FASB) Accounting Standards Codification (ASC) 410. In terms of agreements, Cliffs initiatives include agreements with local municipalities or organizations to make Cliffs-owned or leased land that is not utilized for mining available for local community use, including trails used for snowmobiling, biking, and ATV use. SLR is not aware of any formal commitments to local procurement and hiring; however, Cliffs indicated that it has long-standing relationships with local vendors.
1.3.13Capital and Operating Cost Estimates
Productive and sustaining capital expenditure estimates for the remaining life of the operation are presented in Table 1-7. Starting in 2027, a sustaining capital cost of $4/WLT pellet, or $20.5 million annually, is used in the technical-economic model for an additional $831 million for the remaining mine life.
Table 1-7: LOM Capital Costs
Cleveland-Cliffs Inc. – Northshore Property
| | | | | | | | | | | | | | | | | | | | | | | | | | |
| Type | Units | Total | 2022 | 2023 | 2024 | 2025 | 2026 | 2027-2069 |
| Productive | $ millions | 25.0 | 0 | 0 | 0 | 0 | 0 | 25.0 |
| Sustaining | $ millions | 989 | 43.8 | 40.9 | 35.9 | 20.4 | 16.8 | 830.8 |
| Total | $ millions | 1,014 | 43.8 | 40.9 | 35.9 | 20.4 | 16.8 | 855.8 |
Operating costs are based on a full run rate with a combination of both standard and low-silica production consistent with what is expected for the LOM. A LOM average operating cost of $80.06/WLT pellet is estimated over the remaining 48 years of the mine life as shown below in Table 1-8.
Table 1-8: LOM Operating Costs
Cleveland-Cliffs Inc. – Northshore Property
| | | | | |
| Description | LOM
($/WLT Pellet) |
| Mining | 20.37 |
| Processing | 42.59 |
| Site Administration | 3.80 |
| General / Other | 13.30 |
| Operating Cash Cost | 80.06 |
Cliffs-forecasted capital and operating costs estimates are derived from annual budgets and historical actuals over the long life of the current operation. According to the American Association of Cost Engineers (AACE) International, these estimates would be classified as Class 1 with an accuracy range of -3% to -10% to +3% to +15%.
Cleveland-Cliffs Inc. | Northshore Property, SLR Project No: 138.02467.00001Technical Report Summary - February 7, 2022 14
2.0INTRODUCTION
SLR International Corporation (SLR) was retained by Cleveland-Cliffs Inc. (Cliffs) to prepare an independent Technical Report Summary (TRS) for Cliffs’ Northshore Property (Northshore or the Property), located in Northeastern Minnesota, USA. The operator of the Property, Northshore Mining Company (NSM), is a wholly owned subsidiary of Cliffs.
The purpose of this TRS is to disclose year-end (YE) 2021 Mineral Resource and Mineral Reserve estimates for Northshore.
Cliffs is listed on the New York Stock Exchange (NYSE) and currently reports Mineral Reserves of pelletized ore in SEC filings. This TRS conforms to United States Securities and Exchange Commission’s (SEC) Modernized Property Disclosure Requirements for Mining Registrants as described in Subpart 229.1300 of Regulation S-K, Disclosure by Registrants Engaged in Mining Operations (S-K 1300) and Item 601 (b)(96) Technical Report Summary.
The Property includes the Peter Mitchell Mine (the Mine) in the city of Babbitt, Minnesota and the E.W. Davis Works processing facility (E.W. Davis Works or the Plant) in the city of Silver Bay, Minnesota. The Mine is a large, operating, open-pit iron mine that produces pellets from a magnetite-bearing iron ore regionally known as taconite.
The Property commenced operations in 1952 as an asset of the Reserve Mining Company (Reserve Mining) and continued production until 1986, when Reserve Mining declared bankruptcy. Cyprus Minerals Company (Cyprus) purchased the facilities in 1989 and renamed it Cyprus Northshore Mining Company. Cyprus subsequently sold that company to Cliffs in 1994, and Cliffs renamed it Northshore Mining Company. Northshore Mining Company has been a wholly owned subsidiary of Cliffs since that time.
The open-pit operation has a mining rate of approximately 17 million long tons (MLT) of ore per year and produces 5.0 MLT of iron ore pellets per year, which are shipped by freighter via the Great Lakes to Cliffs’ steel mill facilities in the Midwestern USA.
2.1Site Visits
SLR Qualified Persons (QPs) visited the Property on October 22-23, 2019. On the first day, the SLR team all toured the Peter Mitchell mine offices and operational areas, including rail ore load-out site and train maintenance shops. The SLR geologist also visited the core shack and reviewed core logging and sampling procedures as well as reviewed modeling procedures with the Cliffs mine geologist staff. On the second day, the SLR team all toured the tailings basin, Silver Bay laboratory, concentrator, and pelletizing facilities plus the ship pellet load-out site.
2.2Sources of Information
Technical documents and reports on the Property were obtained from Cliffs personnel. During the preparation of this TRS, discussions were held with personnel from Cliffs:
•Kurt Gitzlaff, Director – Mine Engineering, Cliffs Technology Group (CTG)
•Michael Orobona, Principal Geologist, CTG
•Scott Gischia, Director – Environmental Compliance
•Dean Korri, Director – Basin & Civil Engineering
Cleveland-Cliffs Inc. | Northshore Property, SLR Project No: 138.02467.00001Technical Report Summary - February 7, 2022 15
•Sandy Karnowski, District Manager – Public Affairs
•John Elton, Senior Director – Corporate Accounting & Assistant Controller
•Tushar Mondhe, Senior Manager – Operations and Capital Finance
•Amanda Wills, Mine Geologist
•April Ekholm, Section Manager Quality and Process Improvement
•Michael Jonson, Infrastructure
•Andrea Hayden, Area Manager, Environmental
This TRS was prepared by SLR QPs. The documentation reviewed, and other sources of information, are listed at the end of this report in Section 24.0, References.
Cleveland-Cliffs Inc. | Northshore Property, SLR Project No: 138.02467.00001Technical Report Summary - February 7, 2022 16
2.3List of Abbreviations
Units of measurement used in this report conform to the Imperial system. All currency in this report is US dollars (US$ or $) unless otherwise noted.
Abbreviations and acronyms used in this TRS are listed below.
| | | | | | | | | | | |
| Unit Abbreviation | Definition | Unit Abbreviation | Definition |
| a | annum | LT/d | long tons per day |
| A | ampere | LT/h | long tons per hour |
| acfm | actual cubic feet per minute | M | mega (million); molar |
| bbl | barrels | Ma | one million years |
| Btu | British thermal units | MBtu | thousand British thermal units |
| d | day | MCF | million cubic feet |
°F | degree Fahrenheit | MCF/h | million cubic feet per hour |
| fasl | feet above sea level | mi | mile |
| ft | foot | min | minute |
ft2 | square foot | MLT/y | million long tons per year |
ft3 | cubic foot | MPa | megapascal |
| ft/s | foot per second | mph | miles per hour |
| g | gram | MVA | megavolt-amperes |
| G | giga (billion) | MW | megawatt |
| Ga | one billion years | MWh | megawatt-hour |
| gal | gallon | MWLT | million wet long tons |
| gal/d | gallon per day | oz | Troy ounce (31.1035g) |
| g/L | gram per liter | oz/ton | ounce per short ton |
| g/y | gallon per year | ppb | part per billion |
| gpm | gallons per minute | ppm | part per million |
| hp | horsepower | psia | pound per square inch absolute |
| h | hour | psig | pound per square inch gauge |
| Hz | hertz | rpm | revolutions per minute |
| in. | inch | RL | relative elevation |
in2 | square inch | s | second |
| J | joule | ton | short ton |
| k | kilo (thousand) | stpa | short ton per year |
kg/m3 | Kilogram per cubic meter | stpd | short ton per day |
| kVA | kilovolt-amperes | t | metric tonne |
| kW | kilowatt | US$ | United States dollar |
| kWh | kilowatt-hour | V | volt |
| kWLT | thousand wet long tons | W | watt |
| L | liter | wt% | weight percent |
| lb | pound | WLT | wet long ton |
| LT | long or gross ton equivalent to 2,240 pounds | y | year |
| | yd3 | cubic yard |
Cleveland-Cliffs Inc. | Northshore Property, SLR Project No: 138.02467.00001Technical Report Summary - February 7, 2022 17
| | | | | |
| Acronym | Definition |
| AACE | American Association of Cost Engineers |
| AK | AK Steel |
| AMUSA | ArcelorMittal USA |
| ANSI | American National Standards Institute |
| ARD | acid rock drainage |
| ARO | asset retirement obligation |
| ASC | Accounting Standards Codification |
| ASQ | American Society for Quality |
| ASTM | American Society for Testing and Materials |
| BF | blast furnace |
| BFA | bench face angle |
| BH | bench height |
| BIF | banded iron formation |
| BLS | United States Bureau of Labor Statistics |
| BOF | Basic Oxygen Furnace |
| CCD | counter-current decantation |
| CCP | Conceptual Closure Plan |
| CERCLA | Comprehensive Environmental Response, Compensation, and Liability Act |
| CFR | Cost and Freight |
| COA | certificates of analysis |
| CRIRSCO | Committee for Mineral Reserves International Reporting Standards |
| D&A | depreciation and amortization |
| DDH | diamond drillhole |
| DMO | Department Maintenance Office |
| DR | direct reduced |
| DRI | direct reduced iron |
| DSO | direct shipping iron ore |
| DT | Davis Tube |
| EAF | electric arc furnace |
| EAP | Emergency Action Plan |
| EIS | Environmental Impact Statement |
| EMP | Environmental Management Plan |
| EMS | environmental management system |
| EPA | United States Environmental Protection Agency |
| EPRT | External Peer Review Team |
| ESOP | Environmental Standard Operating Procedures |
| EOR | Engineer of Record |
| FASB | Financial Accounting Standards Board |
| FEL | front-end loader |
| FOB | Free on Board |
| FoS | factor of safety |
| GHG | greenhouse gas |
Cleveland-Cliffs Inc. | Northshore Property, SLR Project No: 138.02467.00001Technical Report Summary - February 7, 2022 18
| | | | | |
| GIM | Geoscientific Information Management |
| GPS | global positioning system |
| GSI | Geological Strength Index |
| GSSI | General Security Services Corporation |
| HBI | hot-briquetted iron |
| HRC | hot-rolled coil |
| HTW | horizontal true width |
ID2 | inverse distance squared |
ID3 | inverse distance cubed |
| IF | iron formation |
| IRA | inter-ramp angle |
| IRR | internal rate of return |
| ISO | International Standards Organization |
| KEV | key economic variables |
| LG | Lerchs-Grossmann |
| LiDAR | light imaging, detection, and ranging |
| LMF | Laurentian Mixed Forest |
| LOM | life of mine |
| MAC | Mining Association of Canada |
| MLT | million long tons |
| MDH | Minnesota Department of Health |
| MDNR | Minnesota Department of Natural Resources |
| MPUC | Minnesota Public Utilities Commission |
| MR | moving range |
| NAAQS | National Ambient Air Quality Standards |
| NAD | North American Datum |
| NGO | non-governmental organization |
| NNG | Northern Natural Gas |
| NOAA | National Oceanic and Atmospheric Administration |
| NOLA | Nuclear On-Line Analyzer |
| NPDES | National Pollution Discharge Elimination System |
| NPV | net present value |
| NSM | Northshore Mining Company |
| OMS | Operations, Maintenance and Surveillance |
| OSA | overall slope angle |
| QA/QC | Quality Assurance/Quality Control |
| QP | Qualified Person |
| RC | rotary circulation drilling |
| RCRA | Resource Conservation and Recovery Act |
| ROM | run of mine |
| RQD | rock quality designation |
| RTR | risk and technology review |
| SDS | State Disposal System Permit |
| SEC | United States Securities and Exchange Commission |
Cleveland-Cliffs Inc. | Northshore Property, SLR Project No: 138.02467.00001Technical Report Summary - February 7, 2022 19
| | | | | |
| SG | specific gravity |
| SMU | selective mining unit |
| SQL | Structured Query Language |
| TMDL | total maximum daily load |
| TRS | Technical Report Summary |
| TSF | tailings storage facility |
| TSP | total suspended particulates |
| UCS | uniaxial compressive strength |
| USACE | United States Army Corps of Engineers |
| USGAAP | United States General Accepted Accounting Principles |
| USGS | United States Geological Survey |
| USNRC | United States Nuclear Regulatory Commission |
| WTP | water treatment plant |
| XRF | x-ray fluorescence |
Cleveland-Cliffs Inc. | Northshore Property, SLR Project No: 138.02467.00001Technical Report Summary - February 7, 2022 20
3.0PROPERTY DESCRIPTION
3.1Property Location
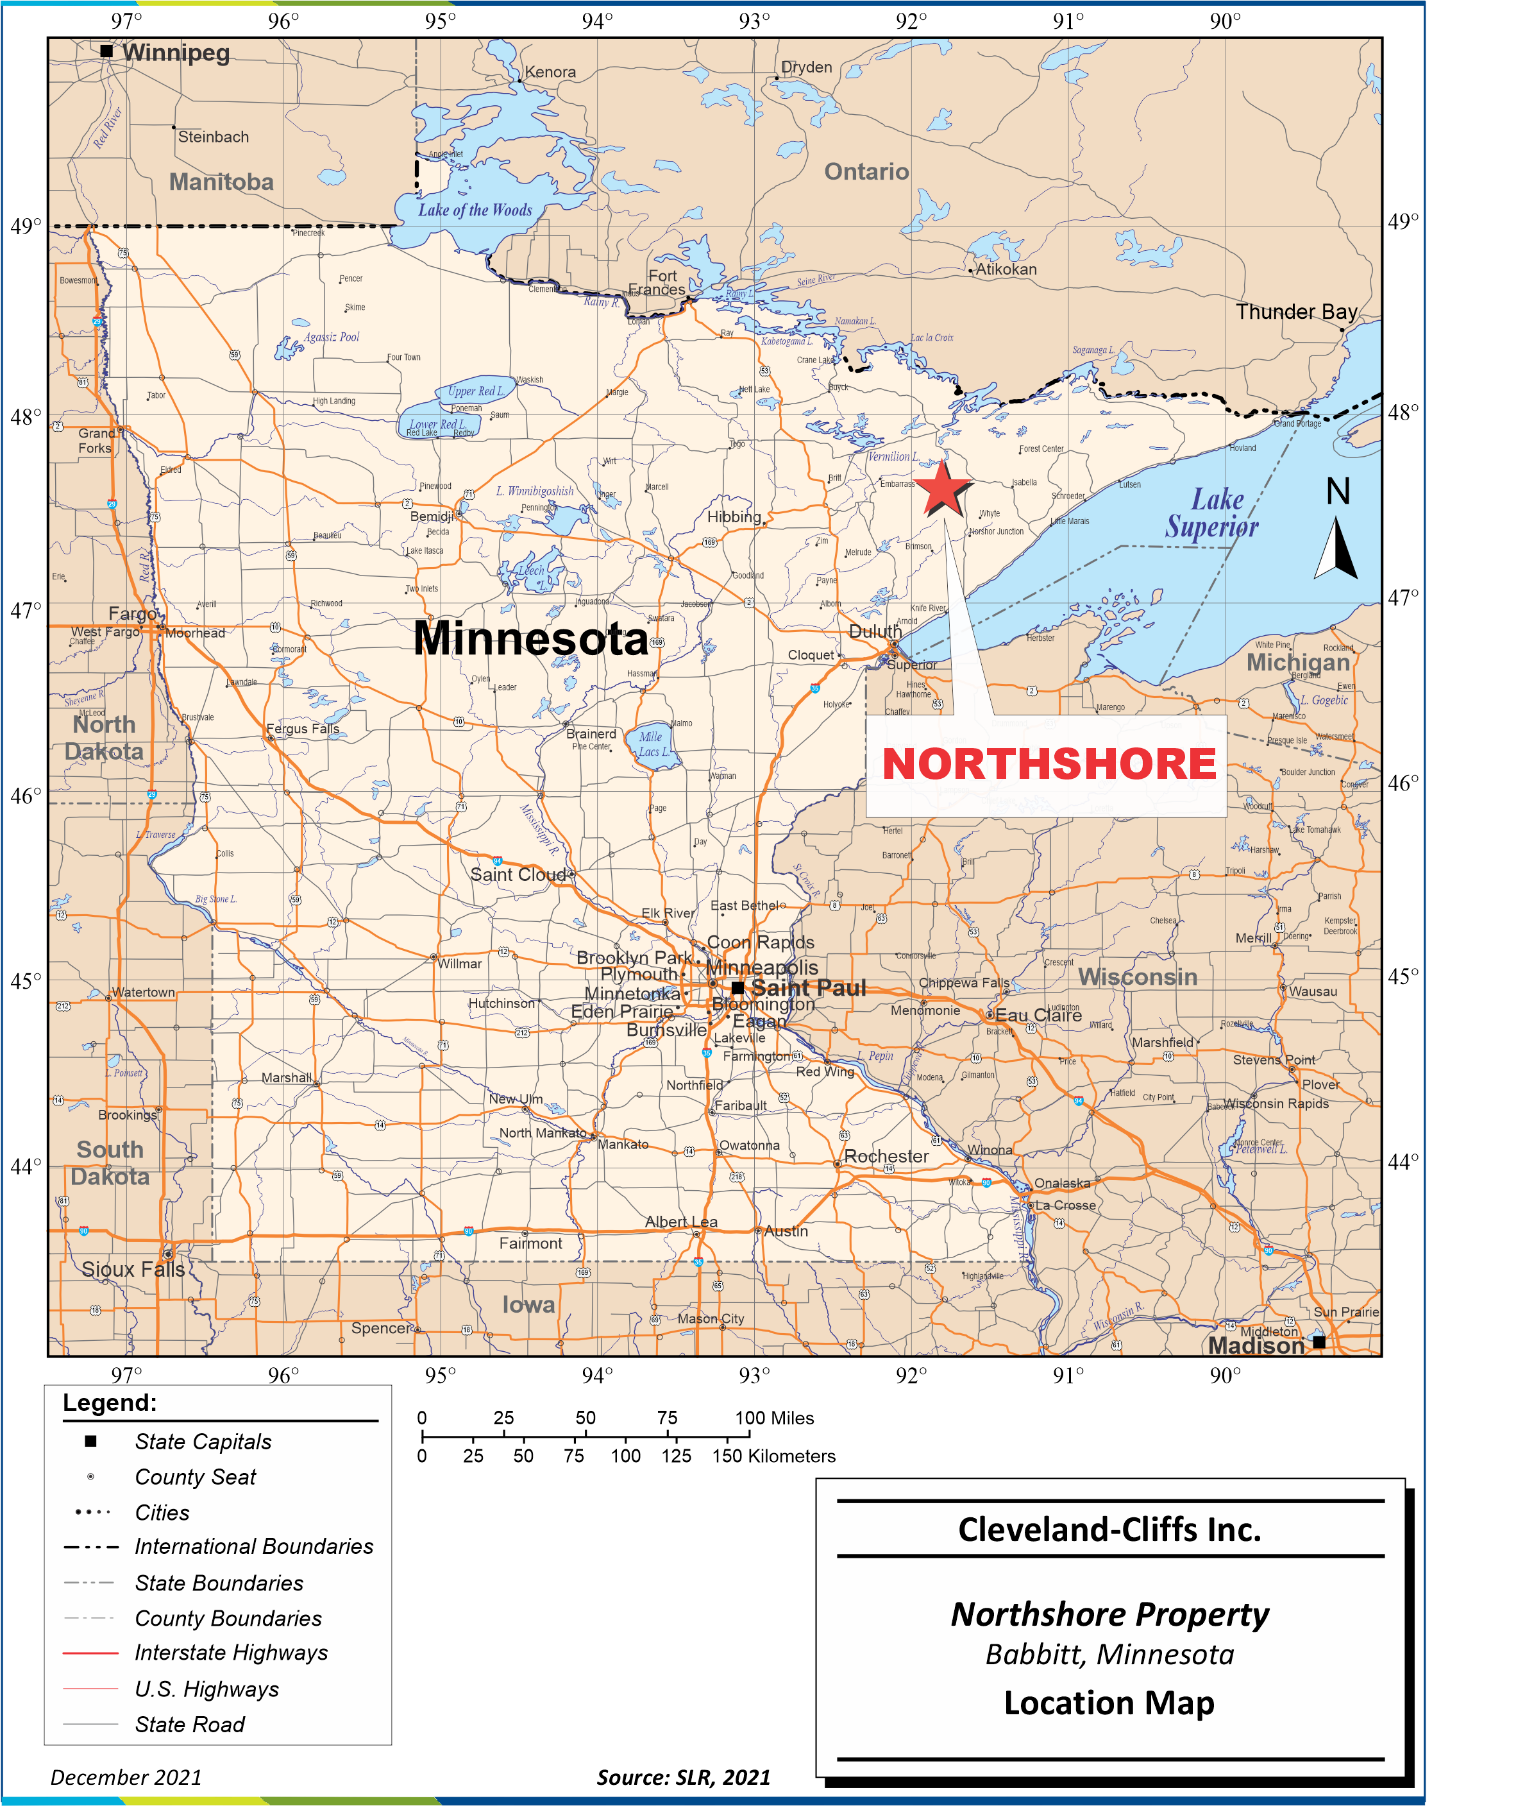
The Property is located in St. Louis and Lake Counties in Northeastern Minnesota, USA. The Mine is located in St. Louis County, approximately 3.5 mi south of the city of Babbitt, Minnesota at latitude 47°40'12.15"N and longitude 91°53'1.28"W. The E.W. Davis Works is located approximately 40.5 mi to the southeast in Lake County near the city of Silver Bay, Minnesota at latitude 47°17'38.95"N and longitude 91°15'23.38"W. Figure 3-1 shows the location of the Property.
3.2Land Tenure
3.2.1Mineral Rights
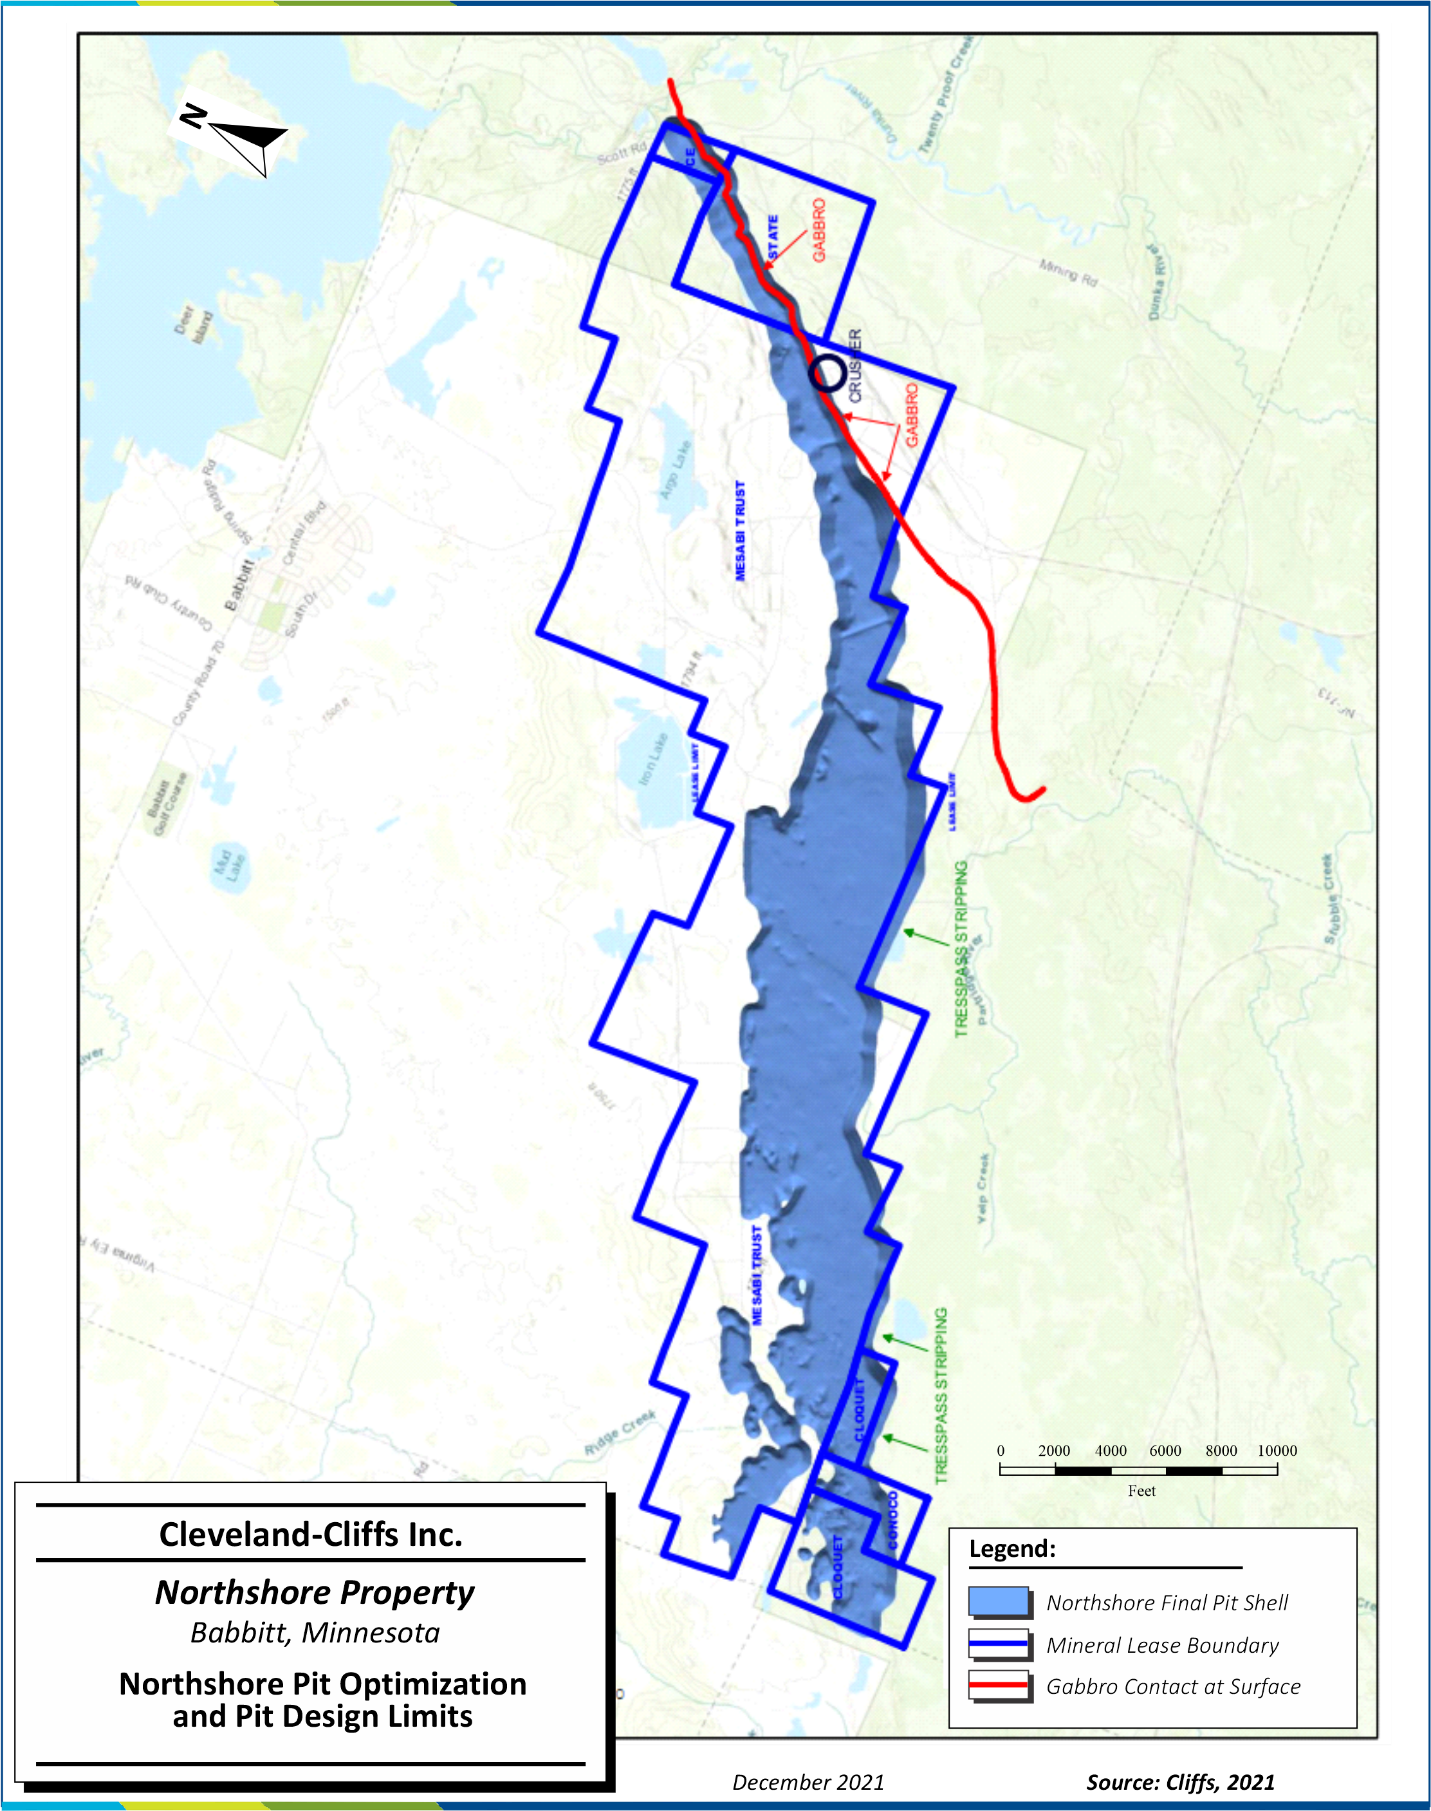
The Property consists of approximately 10,356 acres of mineral leases granted by a publicly traded royalty trust organized under the laws of the State of New York known as the Mesabi Trust, the State of Minnesota, and other private landowners as illustrated in Figure 3-2. Mineral leases generally include surface mining rights. Land tenure is summarized in Table 3-1.
Northshore owns an approximately 28% interest in the surface and minerals of approximately 8,966 acres, which Northshore leases for mining. Other ownership in these acres is distributed among the Mesabi Trust (20%) and other private landowners (approximately 52%). The 8,966 acres are leased to the Mesabi Trust under a lease commonly known as the Peters Lease. The Mesabi Trust then subleases the Peters Lease to Northshore.
Northshore mineral leases with the Mesabi Trust, including the Peters Lease and another lease commonly known as the Cloquet Lease, expire when Mineral Reserves are exhausted. Northshore mineral leases with the State of Minnesota expire in 2034. Northshore mineral leases with other private landowners expire in 2024.
Cliffs is the sole operator of NSM’s Peter Mitchell Mine leases within the permitted boundary. In order to maintain the mineral leases until expiration, NSM must continue to make minimum prepaid royalty payments each quarter and pay property taxes. Royalty payments are due to the Mesabi Trust per long ton of pellets produced or shipped each quarter. The royalty rate paid per long ton of pellets is based on a sliding scale according to the quantity of pellets shipped and is calculated as a percentage of the sale price of pellets. Under mineral leases from the State of Minnesota and other private landowners, a royalty is due per long ton of pellets produced from the crude ore mined when mining occurs and is payable to the respective lessors quarterly. Minimum prepaid royalty payments may be credited against royalties due when mining occurs. Ninety percent (90%) of crude ore must be mined from the Mesabi Trust up to production of 6 MLT of pellets, after which there is no limiting factor on other leases.
Cleveland-Cliffs Inc. | Northshore Property, SLR Project No: 138.02467.00001
Technical Report Summary - February 7, 2022 21
Table 3-1: Land Tenure Summary
Cleveland-Cliffs Inc. – Northshore Property
| | | | | |
| Lease Name | Expiry Date |
| State 3154-N | 12/31/2034 |
| State T-5100-N | 12/31/2034 |
| Mesabi Trust – Cloquet Lease | 5/1/2040 |
| Gardner Lease | 12/31/2075 |
| Mesabi Trust – Peters Lease | When mineral reserves are exhausted |
3.2.2Surface Rights
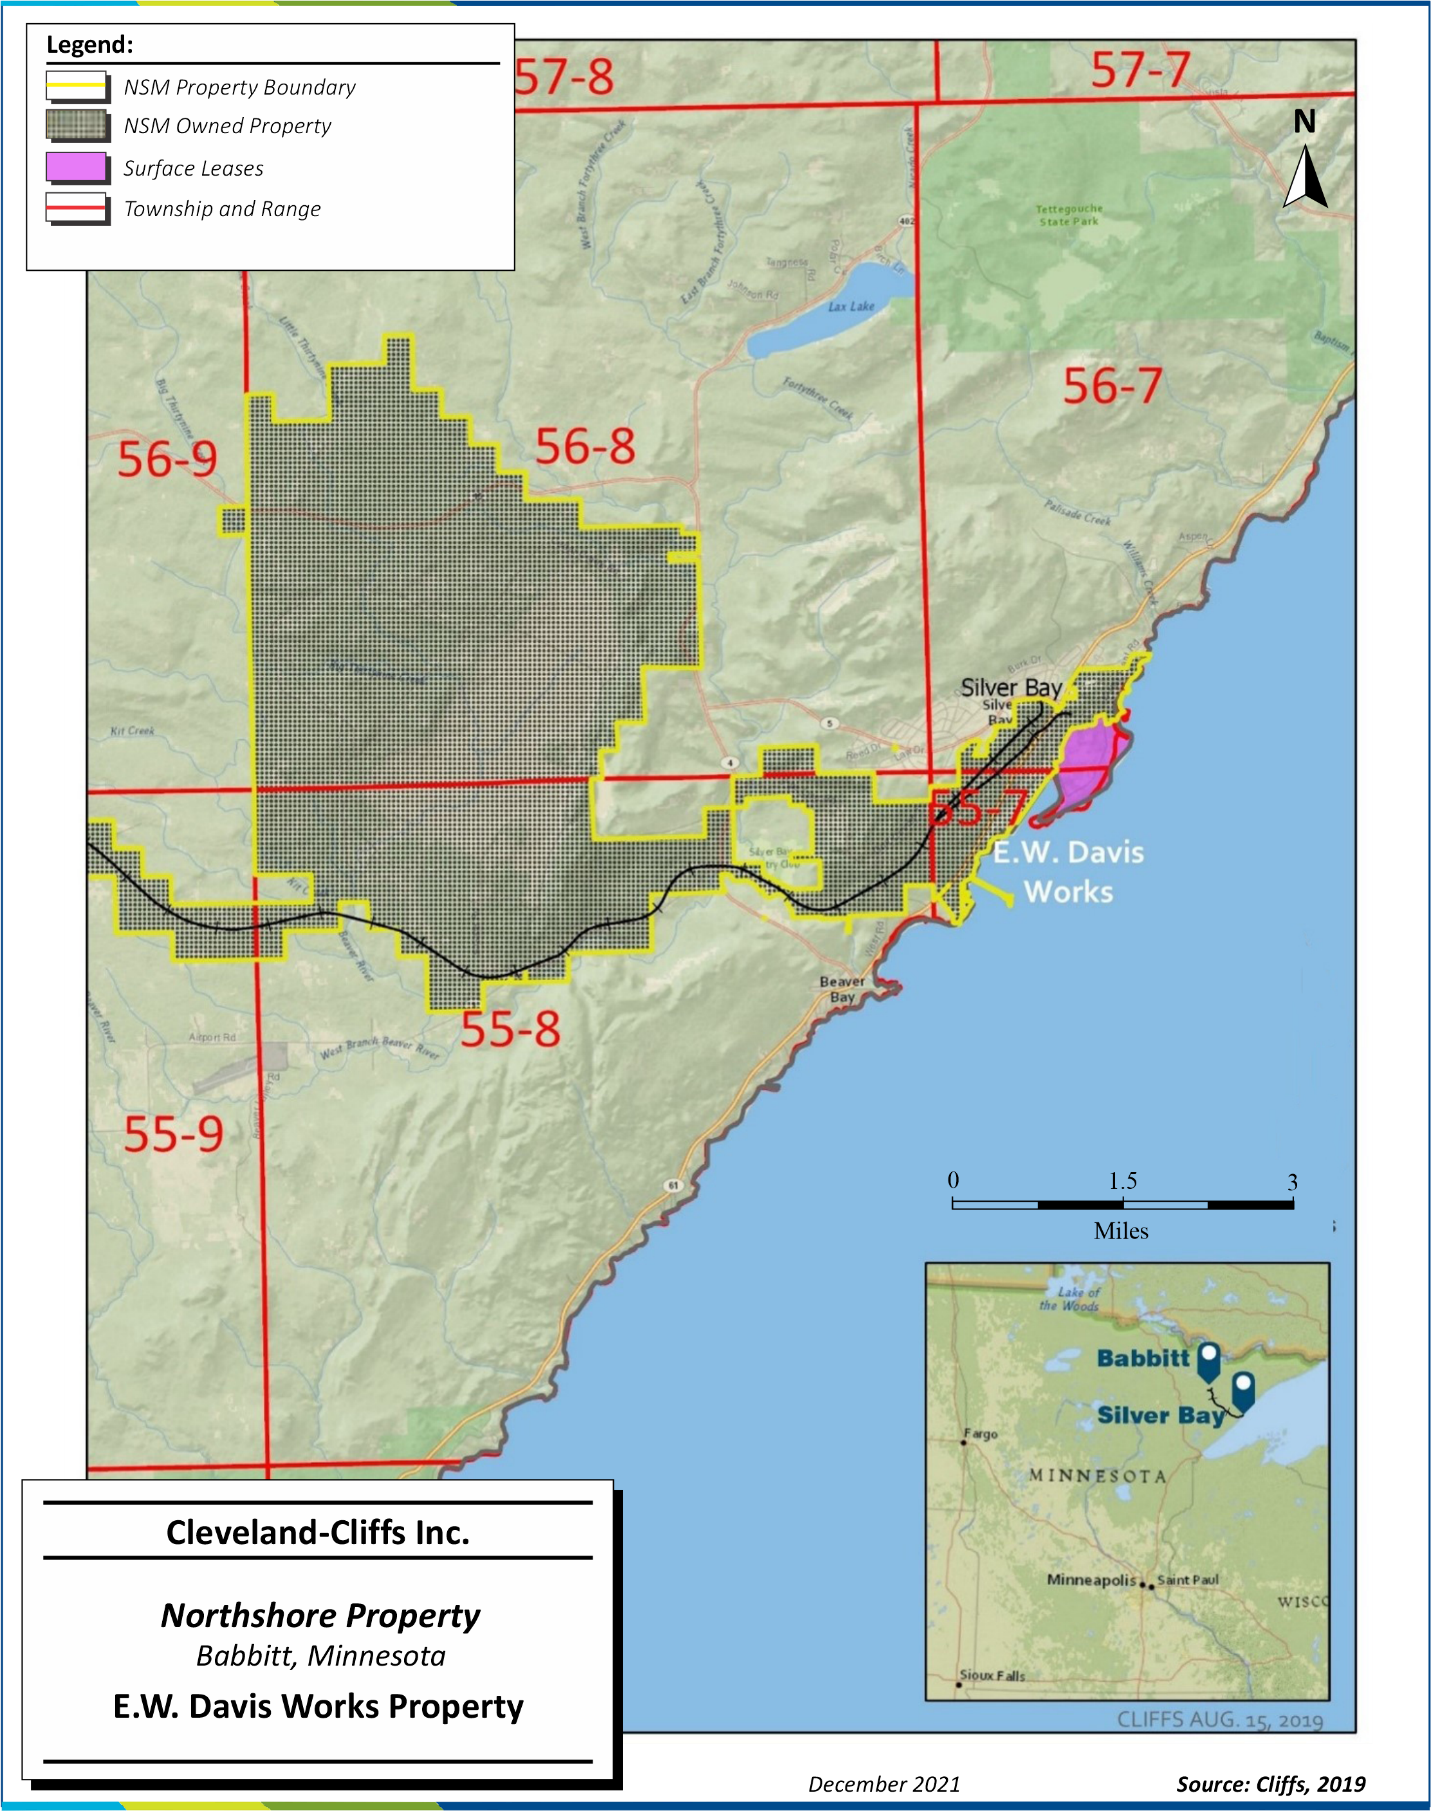
The Property consists of approximately 28,041 acres (8,966 acres associated with mineral leases) of owned property in and around the Mine and E.W. Davis Works as illustrated in Figure 3-2 and Figure 3-3. To maintain ownership, the property taxes must be paid to St. Louis and Lake Counties, Minnesota. NSM also leases approximately 6,103 acres not associated with mineral leases through surface leases granted by the Mesabi Trust and the State of Minnesota. Additionally, NSM owns easements for the portions of the rail corridor not owned or leased.
Cleveland-Cliffs Inc. | Northshore Property, SLR Project No: 138.02467.00001
Technical Report Summary - February 7, 2022 22
Figure 3-1: Property Location Map
Cleveland-Cliffs Inc. | Northshore Property, SLR Project No: 138.02467.00001
Technical Report Summary - February 7, 2022 23
Figure 3-2: Peter Mitchell Mine Title Boundaries
Cleveland-Cliffs Inc. | Northshore Property, SLR Project No: 138.02467.00001
Technical Report Summary - February 7, 2022 24
Figure 3-3: E.W. Davis Works Property
Cleveland-Cliffs Inc. | Northshore Property, SLR Project No: 138.02467.00001
Technical Report Summary - February 7, 2022 25
3.3Encumbrances
NSM grants leases, licenses, and easements for various purposes including miscellaneous community land uses, utility infrastructure, and other third party uses that encumber the Property but do not inhibit operations. Certain assets of NSM serve as collateral as part of Cliffs’ asset-based lending (ABL) facility. Cliffs has outstanding standby letters of credit, which were issued to back certain obligations of NSM, including certain permits and tailings basin projects. Additionally, NSM has and may continue to enter into lease agreements for necessary equipment used in the operations of the mine.
3.4Royalties
Reference section 3.2 for royalty information. No overriding royalty agreements are in place.
3.5Other Significant Factors and Risks
No additional significant factors or risks are known.
SLR is not aware of any environmental liabilities on the Property. Cliffs has all required permits to conduct the proposed work on the Property. SLR is not aware of any other significant factors and risks that may affect access, title, or the right or ability to perform the proposed work program on the Property.
Cleveland-Cliffs Inc. | Northshore Property, SLR Project No: 138.02467.00001
Technical Report Summary - February 7, 2022 26
4.0ACCESSIBILITY, CLIMATE, LOCAL RESOURCES, INFRASTRUCTURE AND PHYSIOGRAPHY
4.1Accessibility
The Mine is accessed from Virginia, Minnesota by traveling north on Highway 53 approximately 3.8 mi to Highway 169 and 6.6 mi east on Highway 169 to County Road 21. The city of Babbitt is located approximately 25 mi east on County Road 21 and approximately 0.5 mi east on County Road 70. The Mine is located approximately five miles by road southeast of Babbitt and approximately 100 mi by road northeast of Duluth, Minnesota. Duluth has a regional airport with several flights daily to major hubs in Minneapolis, Minnesota and Chicago, Illinois.
A rail line operated by Cliffs’ wholly owned Northshore Mining Railroad runs from the Mine south to the processing plant in Silver Bay. This rail line, originally constructed by Reserve Mining Company in the 1950s, is 47 mi in length. The E.W. Davis Works has a boat-loading facility and a single slip that can accommodate lake boats for loading and is generally open from mid-March through mid-January. The processing plant is located in the city of Silver Bay on Highway 61, approximately 55 mi northeast of Duluth. Refer to section 3.1 of this TRS and Figure 3-1 for the location of roads providing access to the Peter Mitchell Mine and E.W. Davis Works Facility.
4.2Climate
The climate in Northern Minnesota ranges from mild in the summer to winter extremes. The annual average temperature is 36.9oF. The annual average high temperature is 48.6°F, whereas the annual average low temperature is 25.1°F. July is on average the hottest month (77°F), with January being the coldest (-4°F) (National Oceanic and Atmospheric Administration [NOAA], 1991-2020). Table 4-1 lists complete climate data for the area for 1991 to 2020.
Table 4-1: Northern Minnesota Climate Data (1991 to 2020)
Cleveland-Cliffs Inc. – Northshore Property
| | | | | | | | | | | | | | | | | | | | | | | | | | | | | | | | | | | | | | | | | |
| Month | Jan | Feb | Mar | Apr | May | Jun | Jul | Aug | Sep | Oct | Nov | Dec | Year |
| Average high (°F) | 16.9 | 22.5 | 35.4 | 49.5 | 63.4 | 72.2 | 76.7 | 74.9 | 65.7 | 50.8 | 34.3 | 21.4 | 48.6 |
| Daily mean (°F) | 6.2 | 10.5 | 23.8 | 37.1 | 49.5 | 58.9 | 63.5 | 61.6 | 53 | 40.2 | 25.6 | 12.3 | 36.9 |
| Average low (°F) | −4.4 | −1.4 | 12.2 | 24.8 | 35.7 | 45.7 | 50.3 | 48.3 | 40.3 | 29.7 | 16.9 | 3.1 | 25.1 |
| Precipitation (in.) | 0.51 | 0.53 | 0.91 | 1.61 | 2.76 | 4.36 | 3.85 | 3.09 | 3.06 | 2.35 | 1.09 | 0.64 | 24.76 |
| Snowfall (in.) | 15 | 7.1 | 7.8 | 3.7 | 0 | 0 | 0 | 0 | 0 | 1.2 | 13.2 | 12.3 | 60.3 |
Source: NOAA, 2021
Precipitation as rain in Northern Minnesota ranges from less than one inch in December, January, and February, to approximately three to four inches per month during the summer, averaging approximately 25 in. annually. Annual snowfalls average 60 in. during November through March. Approximately half of the precipitation occurs during the summer months.
The Property is in production year-round.
Cleveland-Cliffs Inc. | Northshore Property, SLR Project No: 138.02467.00001
Technical Report Summary - February 7, 2022 27
4.3Local Resources
Labor is readily available in the Property area. Medical facilities with trauma centers are located in the cities of Ely, Two Harbors, Virginia, and Duluth. Table 4-2 is a list of the major population centers and the distance by road to the Mine and the Plant.
Table 4-2: Nearby Population Centers
Cleveland-Cliffs Inc. – Northshore Property
| | | | | | | | | | | | | | |
| City/Town | Medical Center | Population 2010 Census | Mileage to Mine | Mileage to Plant |
| Silver Bay, MN | n/a | 1,887 | 58 | 0 |
| Babbitt, MN | n/a | 1,475 | 6 | 63 |
| Two Harbors, MN | Level IV | 3,745 | 62 | 28 |
| Ely, MN | Level IV | 3,460 | 22 | 69 |
| Virginia, MN | Level IV | 8,712 | 43 | 75 |
| Duluth, MN | Level I and II | 85,884 | 100 | 55 |
Source: US Census Bureau, Google Maps
The operation employs 605 personnel who live in the surrounding cities of Silver Bay, Two Harbors, Babbitt, and Ely. Personnel also commute from Duluth and from the Iron Range. Lake and St. Louis Counties, Minnesota have a combined population of 220,000 people.
4.4Infrastructure
The Property is located in a historically important, iron-producing region in Northeastern Minnesota. All infrastructure necessary to mine and process significant commercial quantities of iron ore is currently in place. Infrastructure items include high-voltage electrical supplies, natural gas pipelines that connect into the North American distribution system, water sources, paved roads and highways, railroads for transporting run of mine (ROM) crude ore, port facilities that connect into the Great Lakes, and accommodations for the employees. Local and State infrastructure also includes hospitals, schools, airports, equipment suppliers, fuel suppliers, commercial laboratories, and communication systems. Additional details regarding Northshore infrastructure are provided in Section 15 of this TRS.
4.5Physiography
The Mine is located at an elevation of approximately 1,600 ft above sea level (fasl). The Plant is located adjacent to Lake Superior at approximately 600 fasl. The topography in the area is characterized by hummocky hills and long, gentle moraines, remnants of glacial ingress and egress. The landscape ranges from semi-rugged, lake-dotted terrain with thin glacial deposits over bedrock, to hummocky or undulating plains with deep glacial drift, to large, flat, poorly drained peatlands. Topography includes rolling till plains, moraines, and flat outwash plains formed by the Rainy Lobe glacier. Bedrock is locally exposed near terminal moraines, but is generally rare. There are over 63 bodies of water with surface areas greater than 100 acres in the Nashwauk Uplands Ecological Subsection, which includes the area around Babbitt.
The Minnesota Department of Natural Resources (MDNR) characterizes the area as being within the Laurentian Mixed Forest Province (LMF), which covers over 23 million acres of Northeastern Minnesota.
Cleveland-Cliffs Inc. | Northshore Property, SLR Project No: 138.02467.00001
Technical Report Summary - February 7, 2022 28
In Minnesota, the LMF is characterized by broad areas of conifer forest, mixed hardwood and conifer forests, and conifer bogs and swamps. Vegetation is a mixture of deciduous and coniferous trees. White pine-red pine forest and jack pine barrens are common on outwash plains. Aspen-birch forest and mixed hardwood-pine forest are present on moraines and till plains. Wetland vegetation includes conifer bogs, lowland grasses, and swamps. Prior to settlement, the area consisted of forest communities dominated by white pine, red pine, balsam fir, white spruce, and aspen-birch.
Brown glacial sediments form the parent material for much of the soils in the area. Soils are varied and range from medium to coarse textured. Soils are formed in sandy to fine-loamy glacial till and outwash sand. Upland soils are predominantly well-drained, sandy loam with variation in subsoil textures. The moraine and till plains in the northern half of the area are underlain by sand. Sandy loam till lies to the south. The soils are a combination of boralfs and ochrepts (MDNR, 2011).
Cleveland-Cliffs Inc. | Northshore Property, SLR Project No: 138.02467.00001
Technical Report Summary - February 7, 2022 29
5.0HISTORY
5.1Prior Ownership
The Peter Mitchell Mine was originally owned by the Mesabi Iron Company from 1922 to 1924, which installed and operated an experimental processing facility near Babbitt from 1916 to 1924. In 1939, Reserve Mining Company was organized and acquired a lease from the Mesabi Iron Company. Reserve Mining Company built large-scale mining facilities in Babbitt, Minnesota and a processing plant in Silver Bay, Minnesota during the mid-1950s, which the company operated at various production rates until declaring bankruptcy in 1986. Cyprus purchased the facilities in 1989 and renamed it Cyprus Northshore Mining Company. Cyprus sold that company to Cliffs in 1994, and Cliffs renamed it Northshore Mining Company. Northshore Mining Company, a wholly owned subsidiary of Cliffs, has secured all mineral and surface rights through mineral and surface leases or direct property ownership and is the current operator of the Mine, Northshore Mining Railroad, and the E.W. Davis Works.
5.2Exploration and Development History
Initial observations of iron-bearing rocks in the Mesabi Iron Range are attributed to Henry H. Eames, the first state geologist of Minnesota, in 1866. He mentioned that “enormous bodies of iron ore occurred” in the northern part of the state (Eames, 1866).
The magnetic nature of the rocks in the eastern Mesabi Iron Range was noted in the Geological and Natural History Survey of Minnesota annual report for 1882 (Winchell, 1883). According to this report, the first mineral exploration in the eastern Mesabi Iron Range could be attributed to Peter Mitchell, who excavated a six-foot-deep pit in the northwest quarter of Section 20, Township 60, and Range 12W in 1871. This site is located near the present Peter Mitchell Mine.
Historically, “direct-ship ore” (DSO) iron mines farther west on the Mesabi Iron Range supplied iron ore to the industrializing US steel makers until those DSO deposits began to exhaust around the end of the Second World War. However, the potential for mining low-grade magnetite deposits, regionally known as “taconite” deposits, was recognized early in the 20th century, with the organization of the Mesabi Syndicate (Mesabi Iron Company) in 1915 and installation of experimental process facilities outside of Babbitt in 1916. The process facilities did not prove to be efficient and were shut down in 1924. Reserve Mining Company conducted experimental work on the beneficiation of the lower-grade taconite in cooperation with the University of Minnesota for a number of years prior to settling on the pelletizing process in the mid-1950s.
Reserve Mining Company drilled 593,675 ft of AQ (1.1 in.) size core in 3,580 drill holes during its tenure on the Property. Site-standard analytical procedures of magnetic iron determination by Saturation Magnetization Analyzer (Satmagan), Concentratability, and Grindability applied to drill core were developed prior to mining and have continued to the present as described in Section 8.0 of this TRS. Cliffs and NSM do not have detailed records or results of early, non-drilling prospecting methods used during initial exploration activities (geophysical surveys, mapping, trenching, test pits, etc.) conducted prior to Cliffs’ ownership of the operation.
Cleveland-Cliffs Inc. | Northshore Property, SLR Project No: 138.02467.00001
Technical Report Summary - February 7, 2022 30
5.3Historical Mineral Reserve Estimates
As Cliffs has been the operator of Northshore since 1994, historical reserves are not relevant and are not included in this TRS. A brief history of Mineral Reserves for Northshore, as reported by Cliffs, is included in section 12.2.
5.4Past Production
The historical production of the Northshore operation is given in Table 5-1. The production by owner/operator is shown in Table 5-2.
Table 5-1: Historical Production
Cleveland-Cliffs Inc. – Northshore Property
| | | | | | | | | | | | | | | | | | | | |
| Year | Stripping
(kWLT) | Crude Ore
(kWLT) | Process Recovery | Wet Std. Pellets
(kWLT) | Wet DR-Grade Pellets
(kWLT) |
| 1952-1989 | 253,964 | 649,665 | 34.0% | 220,952 | |
| 1990-1999 | 3,899 | 96,245 | 34.6% | 33,332 | |
| 2000-2009 | 73,041 | 129,778 | 34.8% | 45,186 | |
| 2010 | 10,927 | 14,823 | 33.3% | 4,929 | |
| 2011 | 11,596 | 17,216 | 34.2% | 5,886 | |
| 2012 | 8,849 | 16,078 | 34.0% | 5,465 | |
| 2013 | 7,562 | 11,685 | 34.1% | 3,990 | |
| 2014 | 11,184 | 15,100 | 35.0% | 5,278 | |
| 2015 | 7,347 | 12,200 | 35.5% | 4,326 | |
| 2016 | 5,049 | 9,568 | 34.6% | 3,307 | |
| 2017 | 8,282 | 14,558 | 36.7% | 5,347 | |
| 2018 | 8,022 | 15,385 | 37.1% | 5,712 | |
| 2019 | 9,677 | 15,681 | 33.3% | 4,242 | 973 |
| 2020 | 7,379 | 11,323 | 33.4% | 3,362 | 420 |
| 2021 | 9,317 | 16,426 | 30.5% | 1,767 | 3,243 |
| Total | 435,930 | 1,045,082 | 34.2% | 353,016 | 4,636 |
Cleveland-Cliffs Inc. | Northshore Property, SLR Project No: 138.02467.00001
Technical Report Summary - February 7, 2022 31
Table 5-2: Historical Production by Owner
Cleveland-Cliffs Inc. – Northshore Property
| | | | | | | | |
| Years | Ownership | Wet Pellets (kWLT) |
| 1922-1924 | Mesabi Iron Company | 158 |
| 1952-1986 | Reserve Mining Company | 220,795 |
| 1990-1994 | Cyprus Northshore Mining Company | 11,949 |
| 1994-Present | Northshore Mining Company | 124,751 |
| Total through 2021 | 357,652 |
Cleveland-Cliffs Inc. | Northshore Property, SLR Project No: 138.02467.00001
Technical Report Summary - February 7, 2022 32
6.0GEOLOGICAL SETTING, MINERALIZATION, AND DEPOSIT
6.1Regional Geology
Essential aspects of the regional geology in the Lake Superior region have been understood since the early 1900s, and the geologic understanding of the area has remained relatively unchanged over the years.
The Mine is hosted within a Lake Superior-type banded iron formation (BIF) deposit located within the Middle Precambrian Mesabi Iron Range. This range of low-lying hills consists of members of the Animikie Group of sedimentary rocks. Historical hematite and current magnetite mining focused on the Biwabik Iron Formation (Biwabik IF). Originally discovered in 1890, the iron oxide mineralization ranges from high-grade, structurally controlled bodies to more disseminated, stratigraphically controlled, low-grade taconite deposits. Taconite is found in a sequence of sedimentary rocks overlying Archean granitic rocks in the Lake Superior region. A fold and thrust belt known as the Penokean orogeny (1880 Ma to 1830 Ma) developed a northward-migrating foreland basin known as the Animikie Basin (Figure 6-1). Sedimentary rocks within this basin include the Pokegama Quartzite, the Biwabik IF, and argillite and graywacke of the Virginia Formation (Jirsa et al., 2005).
The Mesabi Iron Range is a term used to designate the outcrop of the Animikie Group, defining a northeast-trending homocline dipping 5° to 15° to the southeast. The Biwabik IF is sectioned by several post-Penokean, high-angle normal and reverse faults, which are associated with near-vertical, reactivated faults in the Archean basement (Morey, 1999). The Mesabi Range lies just north of the Neoproterozoic Duluth Gabbro Complex (Duluth Complex or Duluth Gabbro) (Figure 6-2). The Duluth Complex was emplaced around 1,102 Ma and is a mafic sill approximately 10 mi thick, underlying volcanic rocks of the North Shore Group and overlying the Virginia Formation.
Cleveland-Cliffs Inc. | Northshore Property, SLR Project No: 138.02467.00001
Technical Report Summary - February 7, 2022 33
Figure 6-1: Location of the Animikie Basin and Schematic Cross-section Showing Development of the Basin
Cleveland-Cliffs Inc. | Northshore Property, SLR Project No: 138.02467.00001
Technical Report Summary - February 7, 2022 34
Figure 6-2: Regional Geological Map
Cleveland-Cliffs Inc. | Northshore Property, SLR Project No: 138.02467.00001
Technical Report Summary - February 7, 2022 35
6.2Local Geology
The Early Proterozoic Biwabik IF is a narrow belt of iron-rich strata varying in width from 1,300 ft to 3.2 mi and extending approximately 125 mi from Grand Rapids eastward to Dunka River, Minnesota. The true thickness varies from approximately 150 ft to 700 ft (Perry et al., 1973). The Biwabik IF is interpreted to have been deposited in a shallow, tidal marine setting and is characterized by bedforms and local fossils that are diagnostic of these environments. It is subdivided into four separate, lithostratigraphic units, from bottom to top: the Lower Cherty, Lower Slaty, Upper Cherty, and Upper Slaty members (Severson et al., 2009). “Cherty” lithologies have a generally sandy, granular texture, are thickly bedded, and are composed of silica and iron oxide minerals. “Slaty” lithologies are fine grained, thinly bedded, and comprise iron silicates and iron carbonates, with local chert beds. Cherty lithologies are representative of deposition in a high-energy environment, whereas the slaty lithologies were probably deposited in a muddy, lower-energy environment below the wave base. Interbedding is ubiquitous, and contacts are generally gradational. The average crude iron content is approximately 31% and 26% for the cherty and slaty lithologies, respectively. SLR notes that nomenclature of the members is not indicative of metamorphic grade; instead slaty and cherty are colloquial, descriptive terms used regionally.
The four primary members are further broken down locally into informal subunits (also referred to as submembers) based on their location along the Mesabi Iron Range. In the eastern portion of the Biwabik IF, these subunits vary widely based on mineralogy, bedforms, and grain size (Gundersen and Schwartz, 1962).
Higher-grade iron oxide material exists within the lower-grade taconite, the origins of which have been debated for many years. Some of the more recent publications suggest crustal-scale groundwater convection related to igneous activity. Much of the evidence supporting this conclusion comes from the isotopic analysis of leached and replaced silicate and carbonate minerals (Morey, 1999). Within the Biwabik IF, metamorphic processes produced assemblages diagnostic of greenschist facies to the west, increasing in grade to the east. Mineralogy in unaltered taconite is dominated by quartz, magnetite, hematite, siderite, ankerite, talc, chamosite, greenalite, minnesotaite, and stilpnomelane (Perry et al., 1973).
A stratigraphic column of the Biwabik IF is presented in Figure 6-3 and highlights the Lower Cherty, Lower Slaty, Upper Cherty, and Upper Slaty members as primary units. A stratigraphic column illustrating the local subunits within the four main members of the Biwabik IF is shown in Figure 6-4. These subunits, labeled A through P, are the main units of economic interest and are modeled separately for Mineral Resource and Mineral Reserve estimation. A local geology cross-section is provided in Figure 6-5.
Cleveland-Cliffs Inc. | Northshore Property, SLR Project No: 138.02467.00001
Technical Report Summary - February 7, 2022 36
Figure 6-3: Regional Stratigraphic Column of the Biwabik IF
Cleveland-Cliffs Inc. | Northshore Property, SLR Project No: 138.02467.00001
Technical Report Summary - February 7, 2022 37
Figure 6-4: Stratigraphic Column of the Biwabik IF at Peter Mitchell Mine
Cleveland-Cliffs Inc. | Northshore Property, SLR Project No: 138.02467.00001
Technical Report Summary - February 7, 2022 38
Figure 6-5: Local Geology Cross-section
Cleveland-Cliffs Inc. | Northshore Property, SLR Project No: 138.02467.00001
Technical Report Summary - February 7, 2022 39
6.3Property Geology
Magnetite is the principal economic mineral at the Mine and occurs dominantly in thin to thick bands and layers, as medium- to coarse-grained disseminated grains, and as grain aggregates. Magnetic iron content ranges between 22% and 30% in the mineralized stratigraphic subunits within the deposit at the Mine. Local variation in silicate mineralogy and lithologic textures due to contact metamorphism presents unique challenges for grade control relative to deposits hosted in the western Biwabik IF. These changes affect many aspects of the operation including process metallurgy and hardness. Supergene oxidation of magnetite occurs locally along fracture planes but is generally uncommon.
Several geological structures are important at Northshore:
•The sharp contact between the Biwabik IF and the Duluth Complex identified and modeled from drilling data
•A homocline in the BIF at the contact of the Duluth Complex, striking approximately east-northeast and dipping approximately 7° to the southeast
•Several high-angle normal faults exhibiting variable displacement.
Emplacement of the Duluth Gabbro is responsible for the variable mineralogy observed at Northshore. Regional metamorphism related to this event locally affected the eastern Biwabik IF, resulting in a metamorphic pyroxene- and/or amphibole-dominant gangue mineralogy in place of more common silicate minerals typical of IFs. Minerals in the iron formation at Northshore include magnetite, chert, quartz, hedenbergite, cummingtonite, actinolite, hornblende, fayalite, ferrohypersthene, diopside, and andradite garnet (Gunderson and Schwartz, 1962). Contact metamorphism also resulted in a local coarsening of magnetite grain size and a decrease in the amount of quartz in the gangue mineralogy. It is believed that the silica present in primary quartz was incorporated into the iron silicate minerals found in the iron formation. Metamorphic grade is strongest to the east and decreases westward with distance from the Duluth Complex. Alteration related to metamorphism is observed to be localized along faults, on dike margins, and in fold axes. The Biwabik IF is interpreted to have experienced minor volume loss in the Eastern Mesabi Range due to loss of water and gases during thermal metamorphism (Ojakangas et al., 2009).
Contact metamorphism of the Biwabik IF at the Peter Mitchell Mine distinguishes the mineralogy from that of the rest of the Mesabi Iron Range. Emplacement of the Duluth Complex on the southeastern margin of the district resulted in re-crystallization, which increased mineral grain size and led to production of iron-rich pyroxenes, amphibole minerals, and minor olivine. Devolatilization near the contact also reduced the thickness of the proximal bedded units and altered any hydroxide minerals present. A stratigraphic column from Severson et al. (2009) illustrating the local subunits within the four main members of the Biwabik IF, is shown in Figure 6-3.
6.4Mineralization
Economic mineralization within the mine is hosted entirely within subunits of the Biwabik IF. In the mine area, bedding dips from approximately 5° southeast in the west to 35°southeast near the contact with the Duluth Complex in the east. The entire stratigraphic sequence of the Biwabik IF is present at Northshore, although only subunits of the Upper Cherty member and lesser fractions of adjacent members are mined. The Upper Cherty member averages approximately 160 ft thick, considerably
Cleveland-Cliffs Inc. | Northshore Property, SLR Project No: 138.02467.00001
Technical Report Summary - February 7, 2022 40
thinner than equivalent stratigraphy in the western Biwabik IF. Average thicknesses of the four members in the eastern Biwabik IF are listed in Table 6-1.
Table 6-1: Thickness of Biwabik IF Members
Cleveland-Cliffs Inc. – Northshore Property
| | | | | | | | |
| Member | Average Thickness (ft) | Submembers |
| Upper Slaty | 96 | A, B, C, D, E, F, G |
| Upper Cherty | 161 | H, I, J, K, L, M, N, O |
| Lower Slaty | 86 | P, Q |
| Lower Cherty | 37 | R, S, T, U, V |
Source: Cliffs, 2018, modified from Gunderson, 1962
Not all of the Biwabik IF is economic at Northshore. The geologic subunits G, H, I, J, K, L, M, N, O, and LC (Lower Cherty), are most likely to meet current metallurgical criteria for economic consideration. Geologic subunits C, D, E, and F may also be considered economic locally. Subunits are distinguished based on their magnetite content, geologic observations, and metallurgical characteristics. Table 6-2 lists average magnetic iron content and other characteristics for the main mineralized subunits.
Table 6-2: Characteristics of Main Mineralized Subunits at the Peter Mitchell Mine
Cleveland-Cliffs Inc. – Northshore Property
| | | | | | | | | | | | | | |
| Subunit | Avg. Unit Thickness (ft) | Taconite Type (Gunderson. 1962) | Magnetite Texture | MagFe (Avg %) |
| G | 25 | Laminated, magnetic-quartz taconite | Granular, banded | 23.7 |
| H | 10 | Wavy layered magnetic-quartz taconite | Banded | 21.7 |
| I | 5 | Algal, magnetite-quartz taconite | Disseminated, banded | 21.8 |
| J | 15 | Layered, granule magnetite-quartz taconite | Banded, disseminated | 28.0 |
| K | 35 | Wavy layered, silicate-magnetite-quartz taconite | Banded | 24.4 |
| L | 30 | Wavy layered, silicate-magnetite-quartz taconite | Banded, disseminated | 21.5 |
| M | 20 | Layered magnetite-silicate-quartz taconite | Banded, disseminated | 15.6 |
| N | 4 | Silicate-quartz taconite | Disseminated | 12.1 |
| O | 17 | Bedded granular magnetite-quartz-silicate taconite | Banded, disseminated | 14.3 |
Source: Cliffs, 2018, modified from Gunderson, 1962
Northshore geologists use a geologic model that relies on interpretation of the metamorphosed Biwabik IF as described in Gundersen and Schwartz (1962). The stratigraphy is further broken down into subunits for mining purposes and is modeled in detail so that specific process mineralogical and density factors may be applied.
Cleveland-Cliffs Inc. | Northshore Property, SLR Project No: 138.02467.00001
Technical Report Summary - February 7, 2022 41
6.5Deposit Types
6.5.1Mineral Deposit
The Northshore iron deposit is a classic example of the Lake Superior-type BIF deposit. Lake Superior-type BIFs occur worldwide and are exclusively Precambrian in age, deposited from approximately 2,400 Ma to 1,800 Ma. Although the genesis of Superior-type iron formations has been debated over the years, it is certain that they were deposited contemporaneously and in similar marine depositional environments. Some of the most prolific iron districts in the world are hosted in these rocks, such as those found in the Pilbara district of Australia and the Animikie Group of Minnesota. Theories regarding their formation center on the hypothesis that, at stages in the Earth’s history, the oceans were acidic and contained tremendous amounts of dissolved iron. The conventional explanation for the majority of these deposits is that oxygen-producing life forms such as stromatolites, found fossilized in BIFs, began to produce sufficient oxygen to oxidize the sulfide or free ion forms of iron within seawater. The iron content in seawater rose and fell for over a billion years, and the last of the Precambrian BIFs is thought to have been deposited around 1,800 Ma (Guilbert and Park, 1986).
The majority of the sedimentary iron deposits in Northeastern Minnesota are regionally referred to as taconite deposits. Taconite is a type of BIF that is characterized as an iron-bearing sedimentary rock with greater than 15% Fe, where the iron minerals are interbedded with silicates or carbonates. Iron content (FeO+Fe2O3) in taconite is generally 25% to 30%.
Geological classification of BIFs is based on mineralogy, tectonic setting, and depositional environment. The original facies concept provided for oxide-, silicate-, and carbonate-dominant iron formations proposedly related to the environment of deposition (James, 1954), as follows:
•Oxide-rich BIF typically consists of alternating bands of hematite [Fe23+O3] with or without magnetite [Fe2+Fe23+O4]. Where the iron oxide is dominantly magnetite, siderite [Fe2+CO3] and iron silicate are usually also present.
•Silicate-rich BIF is usually dominated by the minerals greenalite, minnesotaite, and stilpnomelane. Greenalite [(Fe2+, Mg)6Si4O10(OH)8] and minnesotaite [(Fe2+,Mg)3Si4O10(OH)2] are ferrous analogues of antigorite and talc respectively, while stilpnomelane [K0.6(Mg, Fe2+, Fe3+)6Si8Al(O, OH)27 ·2-4H2O] is a complex phyllosilicate.
•Carbonate-rich BIF is usually dominated by the minerals ankerite [CaFe2+(CO3)2] and siderite, both of which display highly variable compositions. Similar proportions of chert and ankerite (and/or siderite) are typically expressed as thinly bedded or laminated alternating layers (James, 1966).
These classification schemes commonly overlap within nearby Lake Superior-type deposits, defying classification by this method. Almost all of the minerals described in the three classifications can be found in many of the deposits of the Mesabi Iron Range. Lake Superior-type deposits are generally classified based on their size and depositional environments (Guilbert and Park, 1986). These deposits are typically large (total primary iron oxide content exceeding 1013 tons) and are associated with other sedimentary rocks. Deposition of the Lake Superior-type deposits occurred in shallow marine conditions, with transgressive sequences commonly observed in the regional stratigraphy (Simonson and Hassler, 1996). Shallow-marine bedforms and sedimentary depositional textures are common in these deposits, locally with spectacular examples due to the alternating nature of silica and iron-rich laminae.
Cleveland-Cliffs Inc. | Northshore Property, SLR Project No: 138.02467.00001
Technical Report Summary - February 7, 2022 42
6.5.2Geologic Model
Northshore geologists use a geologic model that relies on their interpretation of the Biwabik IF stratigraphy. The textures in the ore as well as the stratigraphy identified in the Mine are consistent with other Superior-type BIFs. The stratigraphy is further broken down into more subunits for mining purposes, and is modeled in detail so that specific process mineralogical and density factors may be applied to the resource model. The geologic model is also based on over 1,600 drill holes with detailed logging and sampling, resulting in a reliable database for interpretation of the geology in three dimensions.
Cleveland-Cliffs Inc. | Northshore Property, SLR Project No: 138.02467.00001
Technical Report Summary - February 7, 2022 43
7.0EXPLORATION
Exploration at the Mine consists predominately of core drilling. Cliffs does not maintain detailed records or results of early, non-drilling prospecting methods used during initial exploration activities, such as geophysical surveys, mapping, trenching, test pits, and sampling, conducted prior to Cliffs’ ownership of the operation.
The Mesabi Iron Company test pits were on the furthest up-dip exposures of the Biwabik IF and were fully mined out early in the history of mining. Mesabi Iron Company drilled approximately 160 small-diameter diamond cores on higher-elevation ground in the vicinity of Argo Lake, and Cloquet Lumber Company drilled approximately 43 cores in the western portion of the Property. In both cases, metallurgical analyses were an early version of a Davis Tube, for material ground to -100 mesh (historical hard copy assay certificates). Analyses also included a crude soluble iron assay and a magnetic iron “assay” of unknown derivation. There are no maps to show the exact locations of these historical cores, located only by Section number, and results are not included in current databases or Mineral Resource estimations.
7.1Exploration
No exploration work or investigations other than drilling have been conducted or are planned for Northshore.
7.2Drilling
7.2.1Type and Extent
Table 7-1 presents a summary of drilling on the Property. All holes were completed using diamond drills with BTW (1.656 inch) or BQ (1.432 inch) diameter core. Historical drilling programs were completed with E- or A-size core, approximately 1.1 inch in diameter. Collar locations are shown in Figure 7-1.
Exploration drilling was undertaken on a general grid of 250 ft x 250 ft or 250 ft x 500 ft. The drill holes are located on a local mine grid that is based on the strike of the deposit. The minimum depth is 12.4 ft, and the maximum depth is 1,962.3 ft, with the average depth being 173 ft. Note that no drilling was performed during the 1980s. A total of 56 holes, drilled from mid-2020 to present, have not yet been incorporated into the Mineral Resource estimate.
Cleveland-Cliffs Inc. | Northshore Property, SLR Project No: 138.02467.00001
Technical Report Summary - February 7, 2022 44
Table 7-1: Drilling Summary
Cleveland-Cliffs Inc. – Northshore Property
| | | | | | | | |
| Year | Holes | Total Footage |
| 2021 | 40 | 11,868 |
| 2020 | 49 | 12,472 |
| 2019 | 29 | 6,572 |
| 2018 | 32 | 5,838 |
| 2017 | 38 | 7,761 |
| 2014 | 14 | 5,311 |
| 2013 | 11 | 4,358 |
| 2012 | 50 | 16,895 |
| 2011 | 15 | 8,126 |
| 2010 | 22 | 6,003 |
| 2000s | 130 | 31,472 |
| 1990s | 24 | 4,925 |
| 1970s | 434 | 81,180 |
| 1960s | 3,082 | 500,584 |
| 1950s | 136 | 20,361 |
| 1940s | 35 | 5,711 |
| Total | 4,141 | 729,435 |
Cleveland-Cliffs Inc. | Northshore Property, SLR Project No: 138.02467.00001
Technical Report Summary - February 7, 2022 45
Figure 7-1: Drill Hole Location Map
Cleveland-Cliffs Inc. | Northshore Property, SLR Project No: 138.02467.00001
Technical Report Summary - February 7, 2022 46
7.2.2Procedures
7.2.2.1Collar Coordinates
Planned drill hole collar locations are located using a digital Global Positioning System (GPS) receiver by a Northshore surveyor. When the drill hole is completed, the location is identified with a wood post of unique color to distinguish it from other posts or markers in the pit or surrounding area. Identifying marks (in permanent marker) indicate the hole ID, year drilled, and sequential number.
The collar of each completed exploration drill hole is surveyed by a Northshore surveyor using a Trimble R8 GNSS receiver and TSC3 data collector. All collar data are recorded using a local mine grid coordinate system. The collar coordinates are verified by the Northshore geologist.
7.2.2.2Core Sample Collection
The core is transported from the drill site by the Northshore geologist or the drilling company. The Northshore geologist supervises the packaging and handling of core in the boxes and ensures the following:
•The integrity of the core when taken from the core barrels to the core boxes.
•Placement of core in a clean, accurately labeled, unused, waxed core box.
•The cores in the boxes are positioned in the correct direction and sequence as they are transferred from the core barrel to the core boxes, making sure there is no inversion during the transfer process.
•A wooden block is inserted in the core box at the end of each core run, and the wooden block has hole depth at that specific point (in feet) written on it in permanent marker.
•Identification on the boxes is made on the pre-printed templates located on core box tops and on the end panels of the core box tops and bottoms. This information includes the hole number, footage contained in the box (from-to), and the box number.
•Transportation of core to the core shed for logging and sampling.
The indicated depth on both the blocks marking core barrel runs in the boxes and the depths noted on the outside of the core boxes are verified against the same physical measurements in contractor drill reports. Drill rod counts are completed by the drilling contractor and recorded on shift reports to verify drill depth. The final depth of the drill hole is confirmed and registered in the drill report. Hole size and final hole depth are validated by the project geologist.
Geologic data from exploration drill core are currently managed using an acQuire database.
Core is photographed digitally, and images are archived with a hole number and depth for future reference. Core was not photographed prior to 2003.
Geotechnical core measurement includes core recovery and rock quality designation (RQD). Data are recorded on paper forms and later tabulated and uploaded to the acQuire database.
Cleveland-Cliffs Inc. | Northshore Property, SLR Project No: 138.02467.00001
Technical Report Summary - February 7, 2022 47
7.2.2.3Drill Core Logging
Geological logging of the core is carried out by the Northshore geologist, using acQuire for database management. Logging includes rock types (lithologic unit and subunit), structural information, rock texture, color, magnetic characteristics, alteration, mineralogy, geotechnical data, and a general geologic description. Hard copies of all drill logs are stored on site.
7.2.2.4Drill Core Sampling
Sample intervals are defined by the logging geologist. The sample length is nominally 10 ft for mineralized units but ranges from two feet to 15 ft within a defined geological unit. Sample lengths from the N unit can be as small as two feet, since samples are strictly bound by subunit contacts.
Samples in mineralized material are broken into manageable pieces with a hammer, bagged, and given a sample identity. Core samples are placed in an individual cloth or polyethylene sample bag for each interval at the logging facility in Babbitt, Minnesota.
7.2.2.5Sample and Data Storage and Security
Samples are transported to the Lerch Brothers Inc’s (Lerch) laboratory facility, in Hibbing, Minnesota, by Lerch personnel for sample preparation. Lerch is independent of Cliffs and is accredited to ASQ/ANSI ISO 9001:2015 for its quality management system. Each shipment of core samples is accompanied by a sample sheet with dispatch number recording all the sample information and required analyses. The data are stored digitally on Northshore’s shared servers. Samples prepared by Lerch are transported to the internal Northshore laboratory in Silver Bay, Minnesota for metallurgical analysis. The remaining coarse reject and unused sample materials are stored at the Silver Bay laboratory, except for a 500 g, Fee-Holder save sample, which is returned to Babbitt and stored at the mine site.
From 2009 to 2018, half core of one hole for each target section of the annual drilling programs has been typically retained. All other mineralized intervals are completely consumed for testing.
Electronic storage of an as-drilled collar location file for each annual exploration drilling program is accomplished using the database management system acQuire. A hard copy printout of the collar file with other documents relevant to the drill holes is stored in file cabinets at the mine site.
7.2.2.6Drilling, Sampling, or Recovery Factors
It is the QP’s opinion that there are no known drilling, sampling or recovery factors that could materially affect the accuracy and reliability of the results and that the results are suitable for use in the Mineral Resource estimation.
7.3Hydrogeology and Geotechnical Data
Refer to section 13.2 Pit Geotechnical and section 15.4 Tailings Disposal for this information.
Cleveland-Cliffs Inc. | Northshore Property, SLR Project No: 138.02467.00001
Technical Report Summary - February 7, 2022 48
8.0SAMPLE PREPARATION, ANALYSES, AND SECURITY
Sample preparation of potentially mineralized samples is conducted at the Lerch laboratory, located in Hibbing, Minnesota. Lerch is independent of Cliffs and is accredited to ASQ/ANSI ISO 9001:2015 for its quality management system. All mineralized samples are transported to and analyzed at the Silver Bay laboratory in Silver Bay, Minnesota. The Silver Bay laboratory is a Northshore-owned facility and is accredited to ISO-9001:2015 for its quality management system. The sample analysis includes analysis of head samples and production of a magnetic concentrate sample, which then undergoes analysis for various properties.
8.1Sample Preparation and Analysis
8.1.1Sample Preparation
The sample preparation process for diamond drill hole (DDH) samples used for Mineral Resource estimation is shown in Figure 8-1.
At Lerch, each sample is crushed to -0.25 in. in a multi-stage process (LLP-60-02, LLP-60-03, LLP-60-04). The sample is crushed to minus one inch with a jaw crusher and then further reduced to -0.5 in. with a jaw crusher. A roll crusher is used to reduce the sample size to -0.25 in. The crushed sample is split with a riffle splitter into sample sizes as required for the chemical and metallurgical analyses mandated for the core interval (LLP-60-05). Typically, several pounds of coarse reject (locally called "save sample") remain, and each sample is retained in labeled plastic bags. Duplicate samples are split from the remaining coarse reject material.
The crushed sample is split into the following:
•A minimum of approximately 5,000 g is required for the large mill Grindability test or 1,500 g for the mini-mill; samples are composited to reach that weight if required;
•400 g for Concentratability test;
•40 g for Standard Davis Tube (DT) test and x-ray fluorescence (XRF) analysis;
•1,500 g for Liberation Index Procedure and Density testing with gas pycnometer;
•500 g for Fee Holder sample, if required.
Each subsample is pulverized as outlined in Figure 8-1. Density samples of 150 g at 100% passing -0.25 in. are split from the 1,500 g Liberation Index sample, tested with the gas pycnometer procedure, then returned to the Liberation Index sample split. This particle size allows the maximum sample volume for testing, and particle size is not a factor in results.
Cleveland-Cliffs Inc. | Northshore Property, SLR Project No: 138.02467.00001
Technical Report Summary - February 7, 2022 49
Figure 8-1: Sample Preparation Flow Chart
Cleveland-Cliffs Inc. | Northshore Property, SLR Project No: 138.02467.00001
Technical Report Summary - February 7, 2022 50
8.1.2Sample Analysis
Several procedures are performed on drill hole samples by the Silver Bay laboratory. The summary of these methods in Table 8-1 includes the application of the test data.
Table 8-1: Analytical Procedures Summary
Cleveland-Cliffs Inc. – Northshore Property
| | | | | | | | |
| Parameter | Method | Application |
| Density | Gas Pycnometer | Mineral Resource and Mine Planning |
| DT Concentrate Chemistry | XRF total iron and trace | Mine Planning |
| Magnetic Iron | Satmagan | Mineral Resource and Mine Planning |
| Grindability | Procedure QCSW 5-03 | Mine Planning |
| Concentratability | Procedure QCSW 5-02 | Mineral Resource and Mine Planning |
| Liberation Index | (Grinding- Liberation Index Study) | Not Used Currently |
8.1.2.1Density
Two methods for testing density have historically been applied for drill core analysis. The gas pycnometer method requires a crushed sample, while the immersion method requires an intact core sample. The gas pycnometer is currently used to measure density. Density sample preparation follows the same procedures as other Northshore samples (Figure 8-1). Both methods are described below.
8.1.2.1.1Gas Pycnometer
The Gas Pycnometer measures the density of a crushed drill core sample using helium gas. Per Cliffs procedure QCSW 5-07, a prepared sample between 1.41 oz (40 g) and 7.05 oz (200 g) is placed in a container of a known volume and is connected to a supply of helium gas. The container is filled with helium, and gas volumes of the container with and without the drill core sample are documented. The volume of the drill core is equal to the difference in gas volume with the empty container less the container with the drill core sample. The density is calculated using the measured weight and calculated volume.
8.1.2.1.2Water Immersion
The Water Immersion method measures the volume of a core sample by immersing the sample in water. The density of the sample is calculated using the dry weight divided by the difference in the dry and submerged weight:
Density (sample) = density (water) * (dry weight) / (dry - immersed weight)
Between 2008 and 2011, a total of 955 immersion tests were conducted on whole drill core. During the 2010 drilling campaign, the Silver Bay laboratory began to implement gas pycnometer analyses that had daily calibrations with a certified steel ball standard to account for variations in room temperature and barometric pressure. Gas pycnometer results prior to this period had no such calibrations and are not included in the density database. Density results in the database include 1,425 pycnometer and 645
Cleveland-Cliffs Inc. | Northshore Property, SLR Project No: 138.02467.00001
Technical Report Summary - February 7, 2022 51
immersion tests, with 310 samples representing both test types. Outliers of greater than 4.5 specific gravity are not included in the database.
The 310 sample pairs with results from immersion and gas pycnometer methods are compared in a scatter plot in Figure 8-2, and are generally comparable.
Figure 8-2: Pycnometer vs. Immersion Density Values
8.1.2.2Davis Tube Magnetic Separation Method
Procedure QCSW 5-04 is followed for measuring magnetic iron using the DT (Eriez Model EDT with a tube diameter of two inches). The magnet is electric, and a setting of 0.8 direct current (DC) amps with a 44 DC voltage is used. The DT test is used to directly measure magnetic iron using instrumentation instead of weight recovery methods. The various products of the test include head material, tails, and concentrate. The excess head material is analyzed with the Satmagan for magnetic iron. The DT tails are saved for future testing upon request. The concentrate is tested for:
•Magnetic iron with a Satmagan instrument
•Total Fe, CaO, MgO, Al2O3, SiO2, Mn, P, Na2O, K2O, and TiO2 with XRF spectrometry
Cleveland-Cliffs Inc. | Northshore Property, SLR Project No: 138.02467.00001
Technical Report Summary - February 7, 2022 52
Sample preparation requires using a buckboard and muller to grind the sample to 100% passing –200 mesh. The method involves placing oversized material (+200 mesh) on a cast-iron plate (the buckboard) and passing a muller (heavy weight with handle) over the material until all the material passes the +200 mesh screen.
A 1.05 oz (30 g) sample (100% passing -200 mesh) is then passed through the DT magnetic separator. Wash water of 33.8 fluid oz (1,000 ml) per minute is used for testing. The water flow is verified prior to each use. After the sample is run in the DT, the sample is dried and demagnetized. A weight is taken of the original sample, the DT retained sample, and the DT Tailings sample. The percent magnetic iron is calculated with the following equation:
Percent Magnetic Iron = (B) x (percent weight concentration)
Percent Weight Concentration = (A-C)/(B-C)
Where:
A = Total iron (%) Original sample
B = Total iron (%) Davis Tube sample
C = Total iron (%) Davis Tube tailings sample
8.1.2.3Satmagan Magnetic Iron Determination
Magnetic iron is measured with a Satmagan using procedure QCSW 5-01. The Satmagan is a magnetic balance in which the sample is weighed gravitationally and in a strong magnetic field. The ratio of the two weights is linearly proportional to the amount of magnetic material in the magnetically saturated sample. Magnetic iron is measured in the crude ore, tails, and pellet samples to determine the efficiency of process equipment to recover iron, and is converted to a percent using a factor. The Satmagan is calibrated daily, and the calibration curve, based on three samples of known value, is used to correct the final reported value. Out-of-specification calibration results in re-calibration as per the manufacturer’s specifications.
8.1.2.4X-Ray Fluorescence Spectrometry
The XRF analyzer used at the Silver Bay laboratory is a Malvern Panalytical Axios Max and is utilized for analytical testing of drill core, daily process control and plant recovery monitoring, pellet chemistry control, and vessel cargo analysis for Certificates of Analysis (COA).
Using procedure QCSW 1-01, major oxides analyzed include SiO2, CaO, MgO, Al2O3, Na2O, K2O, and TiO2. The laboratory also reports Mn, P, and S.
8.1.2.5Grindability
Grindability Index is a measure of the ease of crude ore size reduction in a milling circuit. Low Grindability Index material requires more grinding energy, reduces feed rates, lowers recovery, and produces coarser pelletizer feed. It is measured by grinding a sample and portioning out a particular size fraction. This subsample is placed in a miniature ball mill (mini-mill) for a specific time, then sieved using US standard mesh sizes. The final Grindability value is represented as the percentage of -30 (0.0232 in.) mesh material produced from a minus eight (0.0937 in.) mesh, +10 (0.0232 in.) mesh sample in a timed, mini-mill grind. The process is illustrated in Figure 8-3.
Cleveland-Cliffs Inc. | Northshore Property, SLR Project No: 138.02467.00001
Technical Report Summary - February 7, 2022 53
Figure 8-3: Flow Chart for Grindability Index Tests
Cleveland-Cliffs Inc. | Northshore Property, SLR Project No: 138.02467.00001
Technical Report Summary - February 7, 2022 54
8.1.2.6Concentratability
Concentratability is the grade of iron concentrate that can be produced from a given sample at a specific grind (88% passing -325 mesh, 70% passing -500 mesh) using hydraulic and magnetic separation. It is based on the historical average weight percent of +325, -325, +500, and -500 mesh (12% at +325 mesh, 18% at +500 (-325) mesh, and 70% at -500 mesh) size fractions in plant concentrate at a target grind size (100% passing 200 mesh).
As described in procedure QC-7 the -0.25 in., 400 g sample is further reduced to -14 mesh by roll crushing. Following demagnetization in a demagnetizing coil, 100 g are split using a riffle splitter and transferred to a six inch by six inch jar (ball) mill with 100 ml of tap water, where the sample is ground for 1,050 revolutions and/or seven minutes on a roller machine. The ground sample is then mixed and put through a DT magnetic separation (procedure QC-8), and the concentrate is demagnetized, then screened at 325 mesh and 500 mesh. The products are weighed and analyzed for total iron using XRF spectrometry.
Concentratability Index = (0.12) x A + (0.18) x B + (0.7) x C
Where:
A = +325 mesh total iron (%) from the timed-grind Davis Tube concentrate;
B = +500 (-325) mesh total iron (%); and
C = -500 mesh total iron (%).
The QP notes that the turnaround time for exploration drilling samples at the Silver Bay laboratory is very long, sometimes exceeding twelve months. The QP recommends working with the laboratory to improve this.
8.2Sample Security
The diamond drill core is maintained on site at the Mine within the core facility prior to transportation to Lerch for sample preparation. It is secured from unauthorized external access and protects the samples from weather and potential contamination.
Each shipment of core samples is accompanied by a Microsoft Excel spreadsheet that identifies each sample and the method of sample preparation. The remaining coarse reject samples from Lerch are transported to Northshore’s internal Silver Bay laboratory where they are assayed and stored, except for a 500 g Fee-Holder save sample, which is returned to Babbitt and stored at the mine site.
Northshore currently utilizes an acQuire database to dispatch exploration sample specifics; the laboratory will query the drill hole number upon arrival of samples, and a form containing drill hole ID, from-to, geology of the interval, analyses and samples required, and any composites (if identified by geologist). Disposition of all sample parts and splits, as well as sample storage information, is recorded.
8.3Quality Assurance and Quality Control Procedures
Quality assurance (QA) consists of evidence to demonstrate that the assay data has precision and accuracy within generally accepted limits for the sampling and analytical method(s) used in order to have confidence in a Mineral Resource estimate. Quality control (QC) consists of procedures used to ensure that an adequate level of quality is maintained in the process of collecting, preparing, and
Cleveland-Cliffs Inc. | Northshore Property, SLR Project No: 138.02467.00001
Technical Report Summary - February 7, 2022 55
assaying the exploration drilling samples. In general, quality assurance and quality control (QA/QC) programs are designed to prevent or detect contamination and allow assaying (analytical), precision (repeatability), and accuracy to be quantified. In addition, a QA/QC program can disclose the overall sampling-assaying variability of the sampling method itself.
Northshore is working to develop QA/QC procedures and actions. Historically, exploration drill sample programs have not included QC samples, although from 2009 to 2013 and 2017 to present, at least one of two in-house crude ore grade standards have been included alongside samples representing each diamond drill hole, and results have been analyzed and tracked. Although not formalized, current submission of QA/QC samples generally includes one coarse duplicate and one standard sample per drill hole, representing a submission rate of approximately 5%.
Initiated in 2019 by CTG and capturing data from 2017 to 2019, 59 standard samples and 57 coarse duplicates were submitted alongside 1,269 regular samples for analysis, representing an insertion rate of approximately 5% per QA/QC type. Due to the use of a metallurgical test procedure over traditional assays at Northshore, blanks are not used, nor are they relevant. QA/QC results from this test work are discussed below.
8.3.1Metallurgical Sample Standards
Two crude ore standards (NSMCOS_Block 21 and NSMCOS_Block 5) were prepared by the Coleraine Mineral Research Laboratory of the University of Minnesota (UofM) using 10 tonnes of ore-grade material collected from the Mine. The material was crushed to -0.25 in., homogenized, and split into five-kilogram subsamples. The standards are not certified, and the process of certification is challenged by the custom nature of the test procedure at Northshore.
Standards were inserted blind (2009-2013, 2017-2019) to the laboratory alongside every group of drill hole samples. Monitoring of standard sample performance for economically relevant variables was undertaken from 2019, including data from 2017, by CTG, in the form of control plots (Figure 8-4), compilation of failure rates (defined by Cliffs as three standard deviations higher or lower than the mean value of the dataset (UCL/LCL)), temporal trends and statistical comparisons, the results and conclusions of which are described in an annual QA/QC report, and which SLR has reviewed and summarized below.
The control plots of standard NSMCOS_Block 21 for variables MagFe and Concentratability are replicated from Orobona (2020) in Figure 8-4 and show that, since 2019, the Silver Bay laboratory has good precision and accuracy, and prior to 2019 has acceptable precision and accuracy. Similarly good results were observed for NSMCOS_Block 5 and for the Grindability variable. SLR notes that the range of acceptability for MagFe (24.6% to 32.2% MagFe), as well as for phosphorus and for weight recovery in NSMCOS_Block 21, is quite high, and based on more recent results, higher precision is achievable and an adjustment to failure limits is warranted.
In 2018 and 2019, six different standards exceeded acceptable limits for one (or in one case, two) variables. This failure rate was considered acceptable, and no action was taken.
Cleveland-Cliffs Inc. | Northshore Property, SLR Project No: 138.02467.00001
Technical Report Summary - February 7, 2022 56
MAGFE (%)
CONCENTRATABILITY (%)
Figure 8-4: Control Plots of MagFe and Concentratability for Standard NSMCOS_Block 21 (2009 – 2019)
8.3.2Duplicates
Initiated in 2019 by CTG and capturing data from 2017 to 2019, 57 coarse duplicates were submitted alongside 1,269 regular samples for analysis, representing an insertion rate of approximately 5%. Regular and QA/QC samples from the 2020 program are still in progress. The precision target set by Cliffs is nominally 20% of the original sample value.
Monitoring of coarse duplicate sample performance for economically relevant variables is completed by CTG using basic statistical comparisons, scatter plots, relative difference plots, and absolute difference plots (Figure 8-5) by CTG Principal Geologist (Orobona, 2020) and were reviewed by the QP.
The results indicate very good precision for Concentratability, MagFe, and Grindability, which are the principal economic variables of interest at Northshore. Results for phosphorus in concentrate (not shown) were less precise, likely due to the poor accuracy of the XRF at the low value range (0.01% to 0.06%) typical of Northshore, as well as the value being a function of weight recovery, which also showed lower precision. Weight recovery by DT is not a grading variable at Northshore; however, the QP recommends investigating whether precision can be improved with procedural modifications.
Cleveland-Cliffs Inc. | Northshore Property, SLR Project No: 138.02467.00001
Technical Report Summary - February 7, 2022 57
Figure 8-5: Absolute Difference Plots of Selected Coarse Duplicates Sample Variables Representing Drilling from 2017 to 2019
While most duplicate sample pairs for crude MagFe determination by Satmagan are within the 20% relative difference acceptance criteria, the number of failures is high and precision is low relative to similar metrics tracking Lerch’s performance for United Taconite (UTAC) drill core (Orobona, 2020). Investigation of sample preparation and Satmagan calibration and operating practice is recommended to reduce variation and improve analytical precision in future drill core analyses, particularly as the
Cleveland-Cliffs Inc. | Northshore Property, SLR Project No: 138.02467.00001
Technical Report Summary - February 7, 2022 58
lowest precision is seen in-and-around the cut-off grade of Mineral Resources (15%). A scatter plot of duplicate crude MagFe by Satmagan determination is shown in Figure 8-6.
Figure 8-6: Scatter Plot of Original and Duplicate Crude MagFe (Satmagan) Samples Representing Drilling from 2017 to 2019
8.4Conclusions
The QP makes the following conclusions with respect to the sample collection, preparation, analysis, and security, as well as the QA/QC measures in place at Northshore:
•Exploration sampling, preparation, and analyses are appropriate for the style of mineralization and are sufficient to support the estimation of Mineral Resources.
•Sample and data security are consistent with industry best practice.
•Work towards a comprehensive QA/QC program at Northshore is progressing well.
•Results as compiled by Cliffs’ personnel and reviewed by the QP indicate an acceptable level of accuracy and a good level of repeatability for economic variables at Northshore.
•The range of acceptability for MagFe (24.6% to 32.2% MagFe), as well as other variables in standard NSMCOS_Block 21 is quite high, and based on more recent results, higher precision is achievable.
•Coarse duplicate values for crude MagFe by Satmagan are generally acceptable. SLR notes, however, that based on observations from the neighboring UTAC mine, improvements are
Cleveland-Cliffs Inc. | Northshore Property, SLR Project No: 138.02467.00001
Technical Report Summary - February 7, 2022 59
possible and warranted to reduce variation and improve analytical precision in future drill core analyses.
•The turnaround time for exploration drilling samples at the Silver Bay laboratory is very long, sometimes exceeding twelve months.
8.5Recommendations
The QP makes the following recommendations with respect to the sample collection, preparation, analysis, and security, as well as the QA/QC measures in place at Northshore:
1.Consider implementing a check assay program with a secondary laboratory.
2.Adjust failure limits of MagFe in NSMCOS_Block 21 to reflect the higher-precision results observed in 2018 and 2019.
3.Continue to develop the QA/QC program to ensure that the program includes clearly defined limits when action or follow up is required, and that results are reviewed and documented in a report including conclusions and recommendations regularly and in a timely manner.
4.Work with the Silver Bay laboratory to investigate sample preparation, and Satmagan calibration and operating practice to reduce variation and improve analytical precision in future drill core analyses.
5.Improve the turnaround time for exploration drilling samples at the Silver Bay laboratory.
Cleveland-Cliffs Inc. | Northshore Property, SLR Project No: 138.02467.00001
Technical Report Summary - February 7, 2022 60
9.0DATA VERIFICATION
The SLR QP visited the Property on October 22, 2019. While at site, the QP reviewed drill core logging and sampling procedures, including chain of custody. The QP also compared two recent drill holes against lithology logging and analytical results in the database. The QP spoke with the technical team and found them to have a strong understanding of the mineralization types and their processing characteristics, and how the analytical results are tied to the results.
Approximately 4% of the drill holes, representing a temporal and spatial cross-section of holes within the current life of mine (LOM) pit, were selected for database verification. Holes were selected to provide spatial coverage of the future mining areas and represent holes from a variety of time periods. The following aspects were reviewed:
•Collar survey information relative to historical logs or paper-recorded logging. Note that drill hole casings are typically removed, and most historical collar locations are now mined out, preventing ground truthing of historical drill hole locations.
•A comparison of original lithology logging and assay certificates to the current database.
Minor discrepancies in the significant figures and rounding of some variables for some time periods were noted, and some variables related to low-grade samples were not populated or overwritten with a similar variable test result.
The SLR QP is of the opinion that database verification procedures at Northshore comply with industry standards and are adequate for the purposes of Mineral Resource estimation.
Cleveland-Cliffs Inc. | Northshore Property, SLR Project No: 138.02467.00001
Technical Report Summary - February 7, 2022 61
10.0MINERAL PROCESSING AND METALLURGICAL TESTING
10.1Historical Metallurgical Testing
The Mine, crushing and rail loading facilities in Babbitt, Minnesota, and the E.W. Davis Works in Silver Bay, Minnesota have been in production since the 1950s, so metallurgical sampling and testing is primarily used in support of plant operations and product quality control. A laboratory is located inside the concentrator building. Samples from the Mine and Plant are analyzed there. The laboratory is ISO-certified to iron industry standard procedures.
In 2019, NSM completed an upgrade at the Plant, which allows for the production of up to 3.5 MLT of lower-silica iron pellets annually that will be used internally or sold to customers for the production of direct reduced iron (DRI) products such as hot-briquetted iron (HBI).
10.2Sampling and Metallurgical Testing
10.2.1Drill Sample Preparation and Testing
Drill sampling and testing procedures are presented in detail in section 8.1 Sample Preparation and Analysis.
10.3Process Plant Metallurgical Sampling and Testing
10.3.1Process Sampling and Quality Control
10.3.1.1Sample Locations and Routine Sample Analysis
Sampling and testing of materials at each stage of mineral processing is necessary for operational process control and product pellet quality. Table 10-1 is an overview of the routine samples collected and analyzed by the quality control laboratory.
Table 10-1: Routine Samples Analyzed by the Quality Control Laboratory
Cleveland-Cliffs Inc. – Northshore Property
| | | | | | | | | | | | | | | | | | | | |
| Samples | Testing Frequency |
| Area | Weekly | 24hr | 12hr | 6hr | 4hr |
| 006/106 Conveyor | Fine Crusher | Concentratability (3 x per week) | Grindability | Moisture Sizing MagFe | | |
| Dry Cobber Tails | Fine Crusher | | | | MagFe | |
| Final Concentrate | Concentrator | | Trace Metals
Total Fe | | | Sizing Silica |
| Extractor Tails | Concentrator | | Moisture
MagFe | | | |
Cleveland-Cliffs Inc. | Northshore Property, SLR Project No: 138.02467.00001
Technical Report Summary - February 7, 2022 62
| | | | | | | | | | | | | | | | | | | | |
| Samples | Testing Frequency |
| Area | Weekly | 24hr | 12hr | 6hr | 4hr |
| Clarifier Underflow | Concentrator | | Sizing
MagFe | | | |
| Furnace Production | Pelletizer | | Tumble, Sizing Compressions MagFe
Trace Metals | | Tumble Sizing Compressions | Tumble Sizing Compressions |
| 160 Conveyor (Product to Yard) | Pelletizer | | | | Tumble Sizing Compression | Tumble Sizing Compression |
Cleveland-Cliffs Inc. | Northshore Property, SLR Project No: 138.02467.00001
Technical Report Summary - February 7, 2022 63
11.0MINERAL RESOURCE ESTIMATES
11.1Summary
A Mineral Resource block model for the Northshore deposit was prepared by Cliffs in June 2020 and audited and accepted by SLR. The Mineral Resource block model is based on the following drill hole information:
•4,085 diamond drill holes totaling 713,129 ft from 1946 to 2019 and containing 113,203 assays.
A stratigraphic model representing the Biwabik IF was constructed in Maptek’s Vulcan™ (Vulcan) software through the creation of wireframe surfaces representing the upper contact of each unit. Sub-blocked model estimates, also prepared in Vulcan, used inverse distance squared (ID2) and length-weighted, five-foot, uncapped composites to estimate relevant analytical variables in two, progressively larger search passes, using hard boundaries between subunits, ellipsoidal search ranges, and orientation informed by geology. Average density values were assigned by lithological unit.
Mineral Resources were classified in accordance with the definitions for Mineral Resources in S-K 1300. Class assignment was based on criteria developed using continuity models (variograms), grade ranges for key economic variables (KEV), and geological understanding, and was accomplished using scripts that reference the distance of a block centroid to a drill hole sample, and distance buffers.
Wireframe and block model validation procedures including statistical comparisons with composite samples and parallel nearest neighbor (NN) estimates, swath plots, as well as visual reviews in cross-section and plan were completed. A visual review comparing the block model to drill holes completed following the block modeling work was performed to ensure general lithologic and analytical conformance.
The limit of Mineral Resources was optimized using a pit shell that considered the 2020 forecast mining cost for Northshore, Northshore lease boundaries, and a US$90/LT pellet value. The Northshore Mineral Resource estimate as of December 31, 2021, is presented in Table 11-1.
Table 11-1: Summary of Northshore Mineral Resources - December 31, 2021
Cleveland-Cliffs Inc. – Northshore Property
| | | | | | | | | | | | | | |
| Resource
(MLT) | MagFe
(%) | Process Recovery
(%) | Wet Pellets
(MLT) |
| Measured | 766.7 | 22.1 | 25.5 | 195.3 |
| Indicated | 390.8 | 22.4 | 26.4 | 103.1 |
| M&I | 1,157.5 | 22.2 | 25.8 | 298.4 |
| Inferred | 13.6 | 19.8 | 22.5 | 3.1 |
Notes:
1.Tonnage is reported in long tons equivalent to 2,240 lb.
2.Tonnage is reported exclusive of Mineral Reserves and has been rounded to the nearest 100,000.
3.Mineral Resources are estimated at a cut-off grade of 15% MagFe.
4.Mineral Resources are estimated using a pellet value of US$90/LT.
5.Process recovery is reported as the percent mass recovery to produce two thirds DR-grade wet pellets containing 67% Fe and 2% silica, and one third standard wet pellets containing 65% Fe; shipped pellets average approximately 2.2% moisture.
6.Tonnage estimate based on depletion from a surveyed topography on December 21, 2020.
Cleveland-Cliffs Inc. | Northshore Property, SLR Project No: 138.02467.00001
Technical Report Summary - February 7, 2022 64
7.Resources are crude ore tons as delivered to the primary crusher; pellets are as loaded onto lake freighters at Silver Bay, Minnesota.
8.Classification of Mineral Resources is in accordance with the S-K 1300 classification system.
9.Bulk density is assigned based on average readings for each lithology type.
10.Mineral Resources are 100% attributable to Cliffs.
11.Mineral Resources that are not Mineral Reserves do not have demonstrated economic viability.
12.Numbers may not add due to rounding.
The SLR QP is of the opinion that with consideration of the recommendations summarized in Sections 1.0 and 23.0 of this TRS, any issues relating to all relevant technical and economic factors likely to influence the prospect of economic extraction can be resolved with further work.
11.2Resource Database
Geologic and/or assay data from a total of 4,085 diamond drill holes totaling 713,129 ft from 1946 to 2019 and containing 113,203 assays have been incorporated into the current Northshore block model. Drilling has been completed on an approximate grid of 250 ft x 250 ft or 250 ft x 500 ft, with all holes drilled vertically. The drill holes are located on a rotated local mine grid in line with the strike of the deposit.
There are 113,203 samples in the database that have values for at least one variable from the list above. Not all variables were analyzed in all the intervals. Specifically, CaO, SiO2, Mn, P, and Alkali were analyzed only for the drill holes completed from 1999 to present.
Since the database was closed for this resource estimate on June 10, 2020, an additional 56 drill holes totaling 16,306 ft have been completed and are yet to be incorporated into the model. Some assays from the 2020 and 2021 campaign are still pending.
11.3Geological Interpretation
Cliffs’ geologists have developed a geological model for the Northshore deposit by modeling the upper contact of each of the stratigraphic units in the resource area, as well as local intrusions. A stratigraphic cross-section is presented in Figure 11-1. Using Maptek’s Vulcan software, lithological logs from drill holes were used to define the top contact surfaces of each stratigraphic unit, using the Integrated Stratigraphic Modeler tool. Surfaces are modified using a post-processing script to account for hole terminations mid-unit (both collar and end of hole), missing units due to pinched or eroded units, weathering or oxidation obscuring unit characteristics, very thin units, and/or lost data. Localized intrusive units such as diabase dikes, the sill in the BIF, and the Duluth Gabbro are separately modeled as bounding surfaces and wireframes that cut the stratigraphic interpretation.
A domain boundary surface, termed the footwall/hanging wall (FWHW) and based on MagFe values in drilling is also modeled to constrain Mineral Resource estimation based on chemical and metallurgical characteristics.
The geological units modeled at Northshore are outlined in Table 11-2. The geologic subunits G, H, I, J, K, L, M, N, O, and LC are most likely to meet current metallurgical criteria for economic consideration as ore. Geologic subunits C, D, E, and F may also be considered ore-bearing very locally.
SLR is of the opinion that the geological model is fit for purpose and captures the principal geological features of the Biwabik IF at Northshore. A small volume of material is artificially produced at fault boundaries, and SLR recommends defining faults using hard boundaries to prevent this effect in future updates.
Cleveland-Cliffs Inc. | Northshore Property, SLR Project No: 138.02467.00001
Technical Report Summary - February 7, 2022 65
Table 11-2: Modeled Stratigraphic Units
Cleveland-Cliffs Inc. – Northshore Property
| | | | | | | | | | | | | | | | | |
| Unit | Code | Mineralized | Unit | Code | Mineralized |
| Surface Overburden | OB | No | K | K1, K2, K3 | Yes |
| Duluth Complex | GB | No | L | L1, L2, L3 | Yes |
| VF | VF | No | M | M | Yes |
| A | A | No | N | N | Yes |
| B | B | No | O | O | Yes |
| C | C | No | P | P | No |
| D | D | No | Q | Q | No |
| E | E | No | LC | LC | Yes |
| F | F | No | Pokegama Formation | PF | No |
| G | G1, G2, G3 | Yes | Giants Range Granite | GR | No |
| H | H | Yes | Diabase | DB | No |
| I | I | Yes | Footwall Surface | FW | No |
| J | J | Yes | | | |
Cleveland-Cliffs Inc. | Northshore Property, SLR Project No: 138.02467.00001
Technical Report Summary - February 7, 2022 66
Figure 11-1: Typical Cross-section Illustrating the Stratigraphic Units in the Block Model
Cleveland-Cliffs Inc. | Northshore Property, SLR Project No: 138.02467.00001
Technical Report Summary - February 7, 2022 67
11.4Resource Assays
Basic statistics of assays within mineralized domains are shown in Table 11-3. In general, the economic variables for each unit show a minor reduction in the number of values, as well as a reduction in coefficient of variation (CV). Mean, maximum, and minimum values compare well.
Table 11-3: Assay Statistics of Mineralized Stratigraphic Domains
Cleveland-Cliffs Inc. – Northshore Property
| | | | | | | | | | | | | | | | | | | | |
| Unit | Variable | Count | Mean (%) | Minimum (%) | Maximum (%) | CV |
| G | Grindability | 10,906 | 65.98 | 23.50 | 99.50 | 0.16 |
| MagFe | 12,750 | 23.70 | 2.50 | 41.40 | 0.16 |
| Concentratability | 11,814 | 64.44 | 51.96 | 70.69 | 0.03 |
| H | Grindability | 3,395 | 64.44 | 30.20 | 99.50 | 0.17 |
| MagFe | 4,243 | 21.88 | 0.88 | 44.50 | 0.19 |
| Concentratability | 3,853 | 64.64 | 54.26 | 71.10 | 0.03 |
| I | Grindability | 2,681 | 61.96 | 30.20 | 97.14 | 0.21 |
| MagFe | 3,367 | 22.22 | 5.20 | 49.09 | 0.27 |
| Concentratability | 3,083 | 67.07 | 54.61 | 71.57 | 0.03 |
| J | Grindability | 7,238 | 58.83 | 26.50 | 97.14 | 0.24 |
| MagFe | 9,055 | 27.96 | 5.20 | 48.60 | 0.20 |
| Concentratability | 8,296 | 66.18 | 56.06 | 71.57 | 0.03 |
| K | Grindability | 21,508 | 49.28 | 17.90 | 95.05 | 0.28 |
| MagFe | 26,242 | 24.49 | 0.20 | 49.00 | 0.21 |
| Concentratability | 23,793 | 66.06 | 56.03 | 75.84 | 0.03 |
| L | Grindability | 27,760 | 43.91 | 16.50 | 91.96 | 0.30 |
| MagFe | 34,553 | 21.56 | 0.10 | 44.74 | 0.29 |
| Concentratability | 29,807 | 66.45 | 53.84 | 71.31 | 0.02 |
| M | Grindability | 10,013 | 37.87 | 16.50 | 89.00 | 0.28 |
| MagFe | 14,135 | 15.59 | 0.10 | 43.40 | 0.35 |
| Concentratability | 9,479 | 64.83 | 53.60 | 71.31 | 0.03 |
| N | Grindability | 2,282 | 43.21 | 14.00 | 87.11 | 0.26 |
| MagFe | 4,518 | 12.37 | 0.10 | 39.50 | 0.54 |
| Concentratability | 2,085 | 66.39 | 54.51 | 71.05 | 0.03 |
Cleveland-Cliffs Inc. | Northshore Property, SLR Project No: 138.02467.00001
Technical Report Summary - February 7, 2022 68
| | | | | | | | | | | | | | | | | | | | |
| Unit | Variable | Count | Mean (%) | Minimum (%) | Maximum (%) | CV |
| O | Grindability | 4,455 | 44.35 | 14.00 | 87.17 | 0.26 |
| MagFe | 10,055 | 14.15 | 0.10 | 42.30 | 0.54 |
| Concentratability | 4,536 | 66.97 | 54.38 | 71.16 | 0.03 |
| LC | Grindability | 1,110 | 46.82 | 33.50 | 72.00 | 0.16 |
| MagFe | 1,370 | 21.69 | 0.20 | 49.00 | 0.49 |
| Concentratability | 1,059 | 66.26 | 53.58 | 71.16 | 0.03 |
11.5Compositing and Capping
Exploration drilling is sampled on a nominal 10 ft interval by Northshore geologists, with breaks at stratigraphic contacts. Historical sample intervals were collected on uniform, five-foot intervals prior to Cliffs’ purchase of Northshore; therefore, the drill hole database contains a mixture of predominantly five-foot and 10 ft sample intervals.
Compositing is performed in Maptek’s Vulcan software. A five-foot run-length compositing method is used with the majority of geological unit codes recorded and intervals broken by geological domain. Within mineralized units, a total of 110,565 composites are generated, ranging from 0.001 ft to 5.5 ft and averaging 4.2 ft in length. No capping is applied to any variable in the composite database.
Table 11-4 shows composite statistics for Concentratability, Grindability, and MagFe (crude).
Table 11-4: Composite Statistics of Mineralized Stratigraphic Domains
Cleveland-Cliffs Inc. – Northshore Property
| | | | | | | | | | | | | | | | | | | | |
| Unit | Variable | Count | Mean (%) | Minimum (%) | Maximum (%) | CV |
| G | Grindability | 8,952 | 66.00 | 23.50 | 99.50 | 0.16 |
| MagFe | 10,420 | 23.70 | 2.92 | 40.30 | 0.14 |
| Concentratability | 9,687 | 64.44 | 54.26 | 70.66 | 0.03 |
| H | Grindability | 3,171 | 64.43 | 33.70 | 99.50 | 0.17 |
| MagFe | 3,917 | 21.88 | 7.40 | 44.50 | 0.16 |
| Concentratability | 3,583 | 64.64 | 54.61 | 71.10 | 0.03 |
| I | Grindability | 2,158 | 61.95 | 30.20 | 97.14 | 0.21 |
| MagFe | 2,693 | 22.22 | 5.20 | 49.09 | 0.24 |
| Concentratability | 2,482 | 67.07 | 59.00 | 71.32 | 0.02 |
| J | Grindability | 7,158 | 58.83 | 26.50 | 97.14 | 0.24 |
| MagFe | 8,865 | 27.96 | 5.20 | 46.90 | 0.18 |
| Concentratability | 8,162 | 66.18 | 56.06 | 71.54 | 0.03 |
| K | Grindability | 19,228 | 49.27 | 17.90 | 95.05 | 0.27 |
| MagFe | 23,377 | 24.48 | 0.20 | 47.76 | 0.19 |
| Concentratability | 21,197 | 66.06 | 56.03 | 75.51 | 0.02 |
Cleveland-Cliffs Inc. | Northshore Property, SLR Project No: 138.02467.00001
Technical Report Summary - February 7, 2022 69
| | | | | | | | | | | | | | | | | | | | |
| Unit | Variable | Count | Mean (%) | Minimum (%) | Maximum (%) | CV |
| L | Grindability | 25,461 | 43.91 | 16.50 | 91.96 | 0.30 |
| MagFe | 31,633 | 21.56 | 0.46 | 44.21 | 0.28 |
| Concentratability | 27,403 | 66.45 | 57.36 | 71.31 | 0.02 |
| M | Grindability | 9,903 | 37.77 | 16.50 | 89.00 | 0.28 |
| MagFe | 13,617 | 15.60 | 0.10 | 43.40 | 0.33 |
| Concentratability | 9,477 | 64.80 | 53.60 | 70.88 | 0.03 |
| N | Grindability | 1,815 | 43.11 | 14.00 | 87.11 | 0.26 |
| MagFe | 3,524 | 12.37 | 0.20 | 39.50 | 0.52 |
| Concentratability | 1,678 | 66.38 | 57.40 | 71.05 | 0.03 |
| O | Grindability | 4,597 | 44.09 | 14.00 | 87.17 | 0.26 |
| MagFe | 9,567 | 14.15 | 0.10 | 41.29 | 0.52 |
| Concentratability | 4,722 | 66.96 | 54.38 | 71.16 | 0.03 |
| LC | Grindability | 1,200 | 46.92 | 33.50 | 72.00 | 0.15 |
| MagFe | 1,395 | 21.69 | 0.22 | 43.50 | 0.47 |
| Concentratability | 1,153 | 66.25 | 53.58 | 71.16 | 0.03 |
Figure 11-2 highlights the change in interval length distribution within the mineralized units. The QP notes that, although the number of 10 ft samples in the assay database is small, the practice of sample splitting during the compositing process (from one 10 ft assay into two, five-foot composites) may artificially lower the CV of the composite database, and recommends compositing to the current sample length of 10 ft or lowering the current sample size to five feet.
Figure 11-2: Comparison of Assay and Composite Lengths within Mineralized Units
Cleveland-Cliffs Inc. | Northshore Property, SLR Project No: 138.02467.00001
Technical Report Summary - February 7, 2022 70
11.6Trend Analysis
Current estimation practices at Northshore do not incorporate modeled semi-variogram results within the estimation, as all variables are interpolated using an inverse distance squared (ID2) approach. Trend analysis of selected domains and variables was completed by SLR to confirm grade trends and continuity, and to support classification criteria developed and implemented by Cliffs. An example variogram model of MagFe composites within subunit K is shown in Figure 11-3. The result indicates zonal anisotropy (across strike dimension (down hole) is more variable than either the along strike or down dip orientations), and continuity of up to 4,000 ft along strike. Approximately 80% of the domain variance is captured within a range of 1,500 ft in the principal direction on continuity. SLR recommends completing a robust trend analysis for all economic variables and domains.
Cleveland-Cliffs Inc. | Northshore Property, SLR Project No: 138.02467.00001
Technical Report Summary - February 7, 2022 71
Figure 11-3: Subunit K MagFe Variogram Model
Cleveland-Cliffs Inc. | Northshore Property, SLR Project No: 138.02467.00001
Technical Report Summary - February 7, 2022 72
11.7Block Model
A sub-blocked model is created in Vulcan with dimension and origin as shown in Table 11-5. Parent blocks are 100 ft by 100 ft in the X and Y direction and 10 ft in the Z direction, honoring modeled geological surfaces. Sub-blocks are 50 ft (X) by 50 ft (Y) by 5 ft (Z).
Table 11-5: Block Model Parameters
Cleveland-Cliffs Inc. – Northshore Property
| | | | | | | | | | | |
| Parameter | X | Y | Z |
| Start | -50000 | -9000 | 300 |
| Length | 57,000 | 14,000 | 1,600 |
| Block Size | 100 | 100 | 10 |
| Number | 570 | 130 | 160 |
| Sub-block | 50 | 50 | 5 |
| Number | 1140 | 280 | 320 |
Codes are assigned to the following variables during block model creation:
•Stratigraphic units from the modeled geological surfaces
•FWHW from the modeled surface
•Lease boundaries from wireframe solids
•Air blocks from overburden surface roof
11.8Estimation Methodology
The following variables are estimated:
•MagFe: Crude iron percent as magnetite (DT pre-1967 and Satmagan 1967-present)
•Conc_fe: “Concentratability,” concentrate total iron percent at "projected plant grind"
•Grindability: Percent passing US standard sieve size 30 mesh after timed grind mill
•Alkali: Sodium oxide percent plus potassium oxide percent from XRF analysis of -200 mesh DT concentrate
•Mn: Manganese percent from XRF analysis of -200 mesh DT concentrate
•P: Phosphorus percent from XRF analysis of -200 mesh DT concentrate
•MgO: Magnesium oxide percent from XRF analysis of -200 mesh DT concentrate
•CaO: Calcium oxide percent from XRF analysis of -200 mesh DT concentrate
•Kwh325: Kilowatt hours per long ton (kWh/LT) at target grind of 88% passing 325 mesh
•Kwh_si: Kilowatt hours per long ton at target silica (7.5% SiO2 Flot Feed) at target silica content
•Wt325: Weight percent at +325 mesh from Concentratability
•Wt500: Weight percent at -500 mesh from Concentratability
•Fe_325: Total iron percent in the +325 mesh from Concentratability
Estimation parameters are described in Table 11-6.
Cleveland-Cliffs Inc. | Northshore Property, SLR Project No: 138.02467.00001
Technical Report Summary - February 7, 2022 73
Table 11-6: Estimation Parameters
Cleveland-Cliffs Inc. – Northshore Property
| | | | | | | | | | | | | | | | | | | | | | | | | | |
| Domain | ID Power | Pass | Variables | Field Restriction | Orientation | Distance (ft) | Min/Max Comps | Max per DH |
| C, D, E, F, G1-G3, H, I J | 2 | 1 | conc_fe, grind, magfe, kwhr325, fe325, kwh_si, wt_325, wt-500 | n/a | 090/05 | 1500/800/60 | 2/12 | 2 |
| K1-K3, L1-L3, M, N, O, P | 2 | 1 | conc_fe, grind, magfe, kwhr325, fe325, kwh_si, wt_325, wt-500 | FW | 090/05 | 1500/800/60 | 2/12 | 2 |
| K1-K3, L1-L3, M, N, O, P | 2 | 1 | conc_fe, grind, magfe, kwhr325, fe325, kwh_si, wt_325, wt-500 | HW | 090/05 | 1500/800/60 | 2/12 | 2 |
| K1-K3, M, N, O, P | 2 | 2 | conc_fe, grind, magfe | HW | 090/05 | 3,000/1,600/120 or 3,000/2200/400 | 1/15 | 2 |
| L1-L3, P | 2 | 2 | grind | HW | 090/05 | 5,000/2,200/400 | 1/15 | 2 |
| K1-K3, L1-L3, M, N, O, PK1-PK3, P | 2 | 2 | conc_fe, grind, magfe | HW | 090/05 | 1,500/800/60 | 2/12 | 1 |
| All | 3 | 1 | Alkali, Na2O, Mn, P, CaO, MgO | n/a | 090/05 | 3,000/3,000/500 | 2/12 | 5 |
| All | 3 | 2 | Alkali, Na2O, Mn, P, CaO, MgO | n/a | 090/05 | 3,000/7,500/500 | 1/15 | 1 |
A nearest neighbor (NN) estimate was run in parallel to allow comparison of grade variables. Trace elements were not estimated in stratigraphic unit P. Length weighting is used in all estimation runs. Composites used in the estimations were limited to lengths between one foot and 10,000 ft.
Following estimation, a series of block calculations were performed, which included assigned values for P, Mn, and Alkali where unestimated within and west of Block 34 and LC and material-type designation as shown in Table 11-7. Concentratability is calculated into the block model using the equation shown in section 8.1.2.6.
Table 11-7: Block Model Material Type Designation
Cleveland-Cliffs Inc. – Northshore Property
| | | | | |
| Subunit | Designation |
| I, J, K1-3 | Good |
| G1-3, H | Intermediate |
| A, B, N | Lean |
Cleveland-Cliffs Inc. | Northshore Property, SLR Project No: 138.02467.00001
Technical Report Summary - February 7, 2022 74
| | | | | |
| Subunit | Designation |
| L1-3, M, N, O | Footwall |
| C | Poor |
| D, E, F | Bad |
| P, Q | LowerSlaty |
| LC | LowerCherty |
The QP is of the opinion that the interpolation approach at Northshore is generally acceptable; however, the QP recommends testing the following approaches to investigate if block to composite conformance improves in future updates:
•Replace the existing search orientation and dimensions with a smaller, across-strike dimension and dynamic anisotropy to honor zonal anisotropy observed in variogram models. Test a more circular (less elongated) ellipse and a smaller first pass.
•Adjust the interpolation approach so that all key variables within and proximal to the LOM pit are estimated either by increasing the Y, or the X and Y dimensions of the search ellipse(s) in the second pass or by adding a third pass.
•Modify the composite strategy to limit the creation of very short composite lengths, such as a target length approach, and remove the small length limit on composites during interpolation.
11.8.1Density
Density is assigned per stratigraphic unit in the Mineral Resource block model based on numerical averages of validated density data for each stratigraphic unit (see section 8.1.2.1). The density values assigned to the block model are shown in Table 11-8.
Table 11-8: Density by Lithology
Cleveland-Cliffs Inc. – Northshore Property
| | | | | | | | | | | | | | |
| Description | Samples | Specific Gravity | Tonnage Factor
(ft3/LT) | Block Model Density
(LT/ft3) |
| Overburden | - | 1.709 | 21.01 | 0.048 |
| Gabbro | 33 | 2.902 | 12.37 | 0.081 |
| Virginia Formation | 446 | 2.736 | 13.12 | 0.076 |
| A | 100 | 2.754 | 13.03 | 0.077 |
| B | 99 | 3.048 | 11.78 | 0.085 |
| C | 99 | 3.579 | 10.03 | 0.100 |
| C-Sill | 86 | 2.959 | 12.13 | 0.082 |
| D | 48 | 3.419 | 10.50 | 0.095 |
| E | 41 | 3.137 | 11.44 | 0.087 |
| F | 83 | 3.328 | 10.79 | 0.093 |
| G | 122 | 3.374 | 10.64 | 0.094 |
Cleveland-Cliffs Inc. | Northshore Property, SLR Project No: 138.02467.00001
Technical Report Summary - February 7, 2022 75
| | | | | | | | | | | | | | |
| Description | Samples | Specific Gravity | Tonnage Factor
(ft3/LT) | Block Model Density
(LT/ft3) |
| H | 49 | 3.454 | 10.39 | 0.096 |
| I | 43 | 3.261 | 11.01 | 0.091 |
| J | 82 | 3.654 | 9.82 | 0.102 |
| K | 162 | 3.586 | 10.01 | 0.100 |
| L | 159 | 3.553 | 10.10 | 0.099 |
| M | 77 | 3.645 | 9.85 | 0.102 |
| N | 42 | 3.358 | 10.69 | 0.094 |
| O | 87 | 3.711 | 9.67 | 0.103 |
| P | 85 | 3.620 | 9.92 | 0.101 |
11.9Cut-Off Grade
The cut-off grade used for the estimation of Mineral Resources is 15.0% MagFe. This cut-off grade has been developed as a measure of maintaining product tonnage with constraints on the delivery of crude to the concentrator. This cut-off grade is verified through a break-even cut-off grade calculation (Figure 11-4).
Figure 11-4: Cut-Off Grade Formula
Costing is based upon the 2020 forecast mining cost for Northshore as detailed below, Northshore lease boundaries, and a US$90/LT pellet value.
•Cash Costs = $21.43/LT crude ore milled
•Sale Costs = $6.92/ LT dry pellet
•Revenue Rate = $92.27/LT dry pellet
•Pellet % Fe = 65.0%
•Crude Ore Milled = 16,120 LT
•% Mag Fe = 25.4%
•Pellets Produced = 5,480 dry pellets
The 15% MagFe cut-off grade also represents a natural inflection point in the composite data at Northshore, indicating that it mimics the natural deposit characteristics (Figure 11-5).
Cleveland-Cliffs Inc. | Northshore Property, SLR Project No: 138.02467.00001
Technical Report Summary - February 7, 2022 76
Figure 11-5: Log Probability Plot of MagFe Composite Values at Northshore
11.10Classification
Definitions for resource categories used in this TRS are those defined by SEC in S-K 1300. Mineral Resources are classified into Measured, Indicated, and Inferred categories.
Northshore Mineral Resource classification is based primarily on drill hole spacing and influenced by geologic continuity, ranges of economic criteria, and reconciliation. Classification is limited to a distance-based buffer around existing drill holes. Classification limits referencing drill hole spacing are consistent with neighboring Cliffs’ UTAC mine, also hosted within the Biwabik IF, and distance limits are
below continuity ranges resolved in variography completed by SLR. Classification criteria are listed in Table 11-9 and illustrated in Figure 11-6.
Table 11-9: Northshore Classification Criteria
Cleveland-Cliffs Inc. – Northshore Property
| | | | | | | | | | | |
| Criteria | Measured | Indicated | Inferred |
| Distance to Drill hole (ft) | < 400 | < 800 | > 800 |
| Geological Understanding | Very good geology and stratigraphic continuity |
| Range in Values | Narrow range in KEV (MagFe, Grindability, Concentratability) and density |
| Reconciliation (measured at mill vs. estimated) | F2 within 10% | N/A | N/A |
Cleveland-Cliffs Inc. | Northshore Property, SLR Project No: 138.02467.00001
Technical Report Summary - February 7, 2022 77
The QP is of the opinion that the classification at Northshore is generally acceptable but notes that some post-processing to remove isolated blocks of different classification is warranted. The QP recommends transitioning the classification process in future updates to consider local drill hole spacing over a distance to drill hole criterion.
Cleveland-Cliffs Inc. | Northshore Property, SLR Project No: 138.02467.00001
Technical Report Summary - February 7, 2022 78
Figure 11-6: Classification within Northshore LOM Pit
Cleveland-Cliffs Inc. | Northshore Property, SLR Project No: 138.02467.00001
Technical Report Summary - February 7, 2022 79
11.11Model Validation
Blocks were validated using industry-standard techniques including:
•Visual inspection of assays and composites versus block grades (Figure 11-7 and Figure 11-8)
•Visual comparison of 2020 drill hole logging and analytical results (drilled subsequent to current model) and block grades
•Comparison between ID2, NN, and composite means for MagFe (Table 11-10), Grindability (Table 11-11), and Concentratability (not shown)
•Swath plots (Figure 11-9)
Basic statistics of MagFe values within the LOM pit are summarized by subunit in Table 11-10, showing good agreement of ID2 and NN block mean values with composite results. Variability was reduced up to 50%; in general, the deposit has very low CV values, and the variance reduction is acceptable. The subunits where composites are shown to have a lower CV than blocks are those where splitting of longer (10 ft) assays into two, five-foot composites have artificially reduced the CV of the composite dataset.
Table 11-10: MagFe Block and Composite Statistics within LOM Pit
Cleveland-Cliffs Inc. – Northshore
| | | | | | | | | | | | | | | | | | | | | | | | | | | | | |
| Subunit | Blocks | Composites |
| Count | Min. (%) | Max. (%) | ID2 Mean (%) | NN Mean (%) | CV (ID2) | Mean (%) | Max. (%) | CV |
| g | 204,138 | 7.58 | 32.66 | 23.16 | 23.24 | 0.10 | 23.30 | 39.30 | 0.15 |
| h | 64,961 | 10.81 | 33.73 | 22.60 | 22.52 | 0.10 | 22.14 | 37.81 | 0.16 |
| i | 37,255 | 10.66 | 36.87 | 22.31 | 22.61 | 0.13 | 22.26 | 43.30 | 0.22 |
| j | 103,521 | 14.05 | 40.72 | 27.40 | 27.11 | 0.12 | 27.63 | 45.50 | 0.18 |
| k | 320,331 | 8.42 | 37.96 | 23.54 | 23.55 | 0.16 | 23.83 | 41.90 | 0.19 |
| l | 237,347 | 5.51 | 38.39 | 24.76 | 24.76 | 0.15 | 24.54 | 43.30 | 0.20 |
| m | 14,086 | 4.39 | 32.85 | 19.85 | 20.10 | 0.17 | 20.81 | 34.08 | 0.20 |
| n | 638 | 5.97 | 24.70 | 17.03 | 17.11 | 0.27 | 18.96 | 29.80 | 0.24 |
| o | 2,105 | 5.35 | 36.18 | 23.54 | 23.02 | 0.35 | 26.11 | 39.22 | 0.30 |
| lc | 8,570 | 4.40 | 39.16 | 23.92 | 24.22 | 0.31 | 25.22 | 43.30 | 0.38 |
Note: A small number of unestimated blocks have been excluded.
Cleveland-Cliffs Inc. | Northshore Property, SLR Project No: 138.02467.00001
Technical Report Summary - February 7, 2022 80
Figure 11-7: Section View Comparing Drill Hole and Block MagFe Values
Cleveland-Cliffs Inc. | Northshore Property, SLR Project No: 138.02467.00001
Technical Report Summary - February 7, 2022 81
Figure 11-8: Section View Comparing Drill Hole and Block Grindability Values
Cleveland-Cliffs Inc. | Northshore Property, SLR Project No: 138.02467.00001
Technical Report Summary - February 7, 2022 82
Table 11-11: Block and Composite Grindability Statistics within LOM Pit
Cleveland-Cliffs Inc. – Northshore Property
| | | | | | | | | | | | | | | | | | | | | | | | | | | | | | | | |
| Subunit | Blocks | Composites |
| Count | Mean (%) | CV | Min. (%) | Max. (%) | Count | Mean (%) | CV | Min. (%) | Max. (%) |
| g | 206,197 | 65.51 | 0.13 | 33.87 | 92.35 | 4,011 | 64.88 | 0.15 | 23.50 | 93.00 |
| h | 65,385 | 63.85 | 0.11 | 38.14 | 95.20 | 1,418 | 63.30 | 0.14 | 33.70 | 90.08 |
| i | 40,143 | 61.17 | 0.15 | 30.83 | 94.90 | 943 | 61.36 | 0.18 | 30.20 | 93.72 |
| j | 103,982 | 57.26 | 0.16 | 29.19 | 97.14 | 3,031 | 57.13 | 0.20 | 26.50 | 96.50 |
| k | 320,338 | 48.51 | 0.22 | 25.39 | 94.30 | 9,320 | 47.46 | 0.24 | 25.40 | 91.12 |
| l | 237,347 | 48.88 | 0.24 | 25.96 | 86.66 | 7,992 | 47.47 | 0.26 | 22.45 | 91.96 |
| m | 14,088 | 45.33 | 0.20 | 27.02 | 76.77 | 548 | 43.29 | 0.21 | 26.66 | 89.00 |
| n | 638 | 54.35 | 0.18 | 27.57 | 69.35 | 23 | 56.72 | 0.15 | 29.50 | 79.10 |
| o | 2,105 | 54.53 | 0.23 | 26.00 | 76.85 | 39 | 60.87 | 0.14 | 48.52 | 79.10 |
| LC | 8,570 | 45.57 | 0.09 | 34.39 | 60.37 | 585 | 45.81 | 0.12 | 33.50 | 61.50 |
The swath plot in Figure 11-9 shows very good agreement between NN and ID2 estimates for MagFe in subunit K, except for the northeast extent (circled in blue), which has very few blocks and a poor orientation for swath plot generation. Good conformance was observed for other subunits and key variables.
Cleveland-Cliffs Inc. | Northshore Property, SLR Project No: 138.02467.00001
Technical Report Summary - February 7, 2022 83
Figure 11-9: Swath Plot (Northings) of MagFe ID2 and NN Blocks of Subunit K within the LOM Pit
11.12Model Reconciliation
A reconciliation exercise was completed comparing actual production results versus model-predicted values of crude ore, pellet production, and process recovery for the years 2014 through 2020. The results of this study are summarized in Table 11-12. Model values were determined by creating solids of the actual mined areas for each year and then running those solids through the model to determine tons and grade.
Cleveland-Cliffs Inc. | Northshore Property, SLR Project No: 138.02467.00001
Technical Report Summary - February 7, 2022 84
Table 11-12: Model Reconciliation 2014-2020
Cleveland-Cliffs Inc. – Northshore Property
| | | | | | | | | | | | | | |
| Variable | Model | Actual | Variance |
| 2014 | Crude Ore (MLT) | 15.7 | 15.1 | -3.79% |
| Pellets Dry (MLT) | 5.2 | 5.1 | -1.93% |
| Process Recovery | 33.5% | 34.1% | 1.79% |
| 2015 | Crude Ore (MLT) | 12.0 | 12.2 | 1.74% |
| Pellets Dry (MLT) | 4.2 | 4.2 | 0.67% |
| Process Recovery | 34.8% | 34.4% | -1.09% |
| 2016 | Crude Ore (MLT) | 9.6 | 9.6 | -0.46% |
| Pellets Dry (MLT) | 3.3 | 3.2 | -3.16% |
| Process Recovery | 34.1% | 33.2% | -2.69% |
| 2017 | Crude Ore (MLT) | 14.9 | 14.6 | -2.29% |
| Pellets Dry (MLT) | 5.1 | 5.2 | 1.13% |
| Process Recovery | 34.6% | 35.8% | 3.34% |
| 2018 | Crude Ore (MLT) | 15.6 | 15.5 | -0.25% |
| Pellets Dry (MLT) | 5.3 | 5.6 | 4.19% |
| Process Recovery | 34.1% | 35.7% | 4.43% |
| 2019 | Crude Ore (MLT) | 15.6 | 15.7 | 0.45% |
| Pellets Dry (MLT) | 5.1 | 5.1 | 0.36% |
| Process Recovery | 32.6% | 32.5% | -0.09% |
| 2020 | Crude Ore (MLT) | 11.4 | 11.5 | 0.10% |
| Pellets Dry (MLT) | 3.7 | 3.7 | 0.10% |
| Process Recovery | 32.6% | 32.6% | 0.00% |
The QP offers the following conclusions with respect to the Northshore Mineral Resource estimate:
•The geological model is fit for purpose and captures the principal geological features of the Biwabik IF at Northshore.
•The block model’s KEV compare well with the source data.
•The methodology used to prepare the block model is appropriate.
•Validations compiled by the QP indicate that the block model is reflecting the underlying support data.
•Although the classification at Northshore is generally acceptable, some post-processing to remove isolated blocks of different classification is warranted.
•Visually, blocks and composites in cross-section and plan view compare well.
•In both 2019 and 2020, actual versus model-predicted values of crude ore, pellet production, and process recovery were accurate to between -0.09% and 4.43%.
Cleveland-Cliffs Inc. | Northshore Property, SLR Project No: 138.02467.00001
Technical Report Summary - February 7, 2022 85
The QP offers the following recommendations with respect to the Northshore Mineral Resource estimate:
1.A small volume of material is artificially produced at fault boundaries. Define faults using hard boundaries to prevent this effect in future updates.
2.Test the following approaches to investigate if block-to-composite conformance can be improved in future updates:
a.Replace the existing search orientation and dimensions with a smaller, across-strike dimension and dynamic anisotropy to honor zonal anisotropy observed in variogram models. Test a more circular (less elongated) ellipse and a smaller first pass.
b.Adjust the interpolation approach so that all key variables within and proximal to the LOM pit are estimated either by increasing the Y, or the X and Y dimensions of the search ellipse(s) in the second pass or by adding a third pass.
c.Modify the composite strategy to limit the creation of very short composite lengths, such as a target length approach, and remove the small length limit on composites during interpolation. Composite to the current sample length of 10 ft or lower the current sample size to five feet to avoid splitting samples during the compositing process.
3.Transition the process of classifying blocks in future updates to consider local drill hole spacing over a distance-to-drill-hole criterion.
4.Prepare model reconciliation over quarterly periods and document methodology, results, and conclusions and recommendations.
11.13Mineral Resource Statement
The Mineral Resource estimate at Northshore was prepared by Cliffs and audited and accepted by SLR using available data from 1946 to 2019.
The limit of Mineral Resources was optimized using pit shells that considered the forecast 2020 mining cost for Northshore, Northshore lease boundaries, and a US$90/LT pellet value. In addition to SLR’s review, Cliffs’ technical site and corporate teams have reviewed the input data, interpolation design and execution, as well as the resultant deposit block model’s KEV.
The Northshore Mineral Resource estimate as of December 31, 2021 is presented in Table 11-13.
Table 11-13: Summary of Northshore Mineral Resources - December 31, 2021
Cleveland-Cliffs Inc. – Northshore Property
| | | | | | | | | | | | | | |
| Resource
(MLT) | MagFe
(%) | Process Recovery
(%) | Wet Pellets
(MLT) |
| Measured | 766.7 | 22.1 | 25.5 | 195.3 |
| Indicated | 390.8 | 22.4 | 26.4 | 103.1 |
| M&I | 1,157.5 | 22.2 | 25.8 | 298.4 |
| Inferred | 13.6 | 19.8 | 22.5 | 3.1 |
Cleveland-Cliffs Inc. | Northshore Property, SLR Project No: 138.02467.00001
Technical Report Summary - February 7, 2022 86
Notes:
1.Tonnage is reported in long tons equivalent to 2,240 lb.
2.Tonnage is reported exclusive of Mineral Reserves and has been rounded to the nearest 100,000.
3.Mineral Resources are estimated at a cut-off grade of 15% MagFe.
4.Mineral Resources are estimated using a pellet value of US$90/LT.
5.Process recovery is reported as the percent mass recovery to produce two thirds DR-grade wet pellets containing 67% Fe and 2% silica, and one third standard wet pellets containing 65% Fe; shipped pellets average approximately 2.2% moisture.
6.Tonnage estimate based on depletion from a surveyed topography on December 21, 2020.
7.Resources are crude ore tons as delivered to the primary crusher; pellets are as loaded onto lake freighters at Silver Bay, Minnesota.
8.Classification of Mineral Resources is in accordance with the S-K 1300 classification system.
9.Bulk density is assigned based on average readings for each lithology type.
10.Mineral Resources are presented on a 100% basis, which includes both the Mesabi Trust lands and Cliffs.
11.Mineral Resources are 100% attributable to Cliffs.
12.Mineral Resources that are not Mineral Reserves do not have demonstrated economic viability.
13.Numbers may not add due to rounding.
The SLR QP is of the opinion that, with consideration of the recommendations summarized in Sections 1.0 and 23.0, any issues relating to all relevant technical and economic factors likely to influence the prospect of economic extraction can be resolved with further work.
Cleveland-Cliffs Inc. | Northshore Property, SLR Project No: 138.02467.00001
Technical Report Summary - February 7, 2022 87
12.0MINERAL RESERVE ESTIMATES
Mineral Reserves in this TRS are derived from the current Mineral Resources. The Mineral Reserves are reported as crude ore and are based on open pit mining. Crude ore is the unconcentrated ore as it leaves the mine at its natural in situ moisture content. The Proven and Probable Mineral Reserves for Northshore are estimated as of December 31, 2021, and summarized in Table 12-1.
Table 12-1: Summary of Northshore Mineral Reserves - December 31, 2021
Cleveland-Cliffs Inc. – Northshore Property
| | | | | | | | | | | | | | |
| Category | Crude Ore
Mineral Reserves
(MLT) | Crude Ore
MagFe (%) | Process Recovery
(%) | Wet Pellets
(MLT) |
| Proven | 303.2 | 25.3 | 30.3 | 92.0 |
| Probable | 519.2 | 24.1 | 28.8 | 149.6 |
| Proven & Probable | 822.4 | 24.6 | 29.4 | 241.6 |
Notes:
1.Tonnage is reported in long tons equivalent to 2,240 lb and has been rounded to the nearest 100,000.
2.Mineral Reserves are reported at a $90/LT wet standard pellet price freight-on-board (FOB) Lake Superior, based on the three-year trailing average of the realized product revenue rate.
3.Mineral Reserves are estimated at a cut-off grade of 19% MagFe or when mineralization concentrates to less than 63.5% Fe (Conc_Fe) or when the Grindability is less than 30.0.
4.Mineral Reserves include global mining dilution of 3% and mining extraction losses of 2% in addition to 33% mining extraction losses for intermediate crude ore.
5.The Mineral Reserve mining strip ratio (waste units to crude ore units) is at 0.8.
6.Mineral Reserves are Probable if not scheduled within the first 20 years.
7.Process recovery is reported as the percent mass recovery to produce two thirds DR-grade wet pellets containing 67% Fe and 2% silica, and one third standard wet pellets containing 65% Fe; shipped pellets average approximately 2.2% moisture.
8.Tonnage estimate is based on actual depletion as of December 31, 2021 from a December 21, 2020 topographic survey.
9.Mineral Reserve tons are as delivered to the primary crusher; pellets are as loaded onto lake freighters at Silver Bay, Minnesota.
10.Classification of Mineral Reserves is in accordance with the S-K 1300 classification system.
1.Mineral Reserves are 100% attributable to Cliffs.
2.Numbers may not add due to rounding.
The pellet price used to perform the evaluation of the Mineral Reserves was based on the mining model three-year trailing average of the realized product revenue rate of US$90/LT wet standard pellet. The saleable product (i.e., DR-grade pellets and standard pellets) mix may vary depending on market considerations and internal requirements. Total saleable product is within the range of 230 MLT (assuming all DR-grade pellets) and 271 MLT (assuming all standard pellets). The costs used in this study represent all mining, processing, transportation, and administrative costs including the loading of pellets into lake freighters at Silver Bay, Minnesota.
SLR is not aware of any risk factors associated with, or changes to, any aspects of the modifying factors such as mining, metallurgical, infrastructure, permitting, or other relevant factors that could materially affect the Mineral Reserve estimate.
12.1Conversion Assumptions, Optimization Parameters, and Methods
Using the mine planning block model for Northshore, pit optimizations and pit designs are conducted to convert the Mineral Resources to Mineral Reserves.
Cleveland-Cliffs Inc. | Northshore Property, SLR Project No: 138.02467.00001
Technical Report Summary - February 7, 2022 88
A new mine planning block model was constructed for Northshore in 2020 that forms the basis for the current Mineral Reserve estimate. The mine planning block model is based on the Mineral Resource block model from the June 2020 geologic model (nsm_model_June2020_1.bmf).
Scripts executed within Vulcan add variables for economic evaluation and mine planning, flag in-pit stockpile backfills, flag the current topography, re-block the model to represent the selective mining unit (SMU), incorporate crude ore loss and dilution impacts, and reinforce cut-off grades. Scripts also assign restrictions to blocks outside of the lease areas, inside the areas of facilities, and inside geologic boundaries – assigning blocks as restricted or waste when appropriate. The resulting block models are evaluated using the pit optimization and Chronos scheduling packages in Vulcan.
Iron formation can only be initially considered as “candidate” crude ore if the stratigraphy comprises one of the following geologic subunits (as detailed in section 6.4):
•Intermediate - G, H;
•High Grade - I, J, K; or
•Footwall Group - L, M, N, O; or
•Lower Cherty - LC
At the eastern end of the final pit limits, the following geologic subunits are also considered candidate crude ore: C, D, E, and F. All other geologic subunits are considered to be waste.
Candidate crude ore must then meet the following additional criteria to be considered crude ore blocks:
•Satisfy the metallurgical cut-off grades; in summary, candidate crude ore with MagFe lower than 19%, or a concentrate iron content (Conc_Fe) lower than 63.5%, or a Grindability index lower than 30.0 is considered to be waste.
•Be classified as a Measured or Indicated Mineral Resource; Inferred Mineral Resources are considered to be waste.
•Not occur within a mining restricted area.
•Generate a net block value greater than the cost of the block as if it were mined as waste.
The mine planning block model is based on 50 ft by 50 ft by 22.5 ft blocks and represents the SMU in relation to cut-off grade and subsequent mining dilution. Where the interpretation of the mineralized rock intersects a block model block centroid, the block within the mineralized shape is recorded. Thus, the flagging of crude ore type in the block model is based on the block centroid.
The current mining methodology along F (waste) and G (crude ore) contact is to mine 200 ft-wide blast patterns that are 20 ft deep. In the pit, the contact of waste and crude ore is clearly visible, so minimal mining dilution is expected along the contact. A base 3% crude ore loss and 2% mining dilution are added to all scheduled mining blocks to account for the contact dilution and any internal mining dilution. For the Intermediate crude ore, an additional ore loss of 33% is factored into the LOM plan. This is based on 10 years of reconciliation from 2010 through 2019 that indicates an approximate 36% Intermediate crude ore loss.
Northshore has a long history of plant recovery data, and empirical relationships are understood for the calculation of pellet production based on crude ore tons, MagFe, Conc_Fe, crude ore hardness (i.e., Grindability), and the amount of High Grade crude ore from subunits I, J, or K. A new equation was
Cleveland-Cliffs Inc. | Northshore Property, SLR Project No: 138.02467.00001
Technical Report Summary - February 7, 2022 89
implemented for the 2020 LOM plan in order to calculate crude ore to pellet for the new product mix that includes approximately two thirds of DR-grade pellets (SLR notes that, prior to this, Northshore only produced standard pellets).
Recovery for DR-grade product is defined by:
DR-grade Recovery (dry LT) = ((MagFe – 4)/24.5 * 0.22272
Recovery for standard grade product is defined by:
STD Recovery (dry LT) = ((MagFe – 4)/24.5) * 0.12077
Recovery for DR-grade and standard grade net product mix used is defined by:
NET Recovery (dry LT) = ((MagFe – 4)/24.5) * 0.34349
Total pellets for the LOM plan are then calculated by:
Dry Pellets (dry LT) – Crude Ore * Net Recovery
Reconciliation of the new recovery equations will begin with the completion of the 2021 mining year. Historical reconciliation is not relevant due to the plant flowsheet changes and the changes to the product mix.
All Measured and Indicated Mineral Resources within the final designed pit that meet the above criteria are converted into Mineral Reserves. The only additional criteria for Measured Mineral Resources converting into Proven Mineral Reserves is that they must be scheduled within the first 20 years of the mine life prior to depletion. Table 12-2 shows the criteria to convert Mineral Resource classifications to Mineral Reserve classifications.
Table 12-2: Mineral Resource to Mineral Reserve Classification Criteria
Cleveland-Cliffs Inc. – Northshore Property
| | | | | | | | |
| Mineral Resources | Criteria for Conversion | Mineral Reserves |
| Measured | Scheduled Within the First 20 Years | Proven |
| Measured | Scheduled After 20 Years | Probable |
| Indicated | As Scheduled | Probable |
| Inferred | As Scheduled | Waste |
12.2Previous Mineral Reserve Estimates by Cliffs
The first computer-generated block model for Northshore was built internally by Reserve Mining Company in 1984. Cliffs has periodically updated crude ore Mineral Reserve estimates since its acquisition of the Property in 1994. The SEC-reported Mineral Reserves for the past six LOM updates are shown in Table 12-3. These Mineral Reserves were not prepared under the recently adopted SEC guidelines; however, they followed SEC Guide 7 requirements for public reporting of Mineral Reserves in the United States.
The most recent prior update to the LOM plan and Mineral Reserves was in 2018; the Mineral Reserves in Cliffs' 10-K filings have been updated net of depletion since.
Cleveland-Cliffs Inc. | Northshore Property, SLR Project No: 138.02467.00001
Technical Report Summary - February 7, 2022 90
Table 12-3: Previous Cliffs Mineral Reserves
Cleveland-Cliffs Inc. – Northshore Property
| | | | | | | | | | | |
| Proven & Probable Crude Ore (MLT) | Process Recovery
(%) | Dry Standard Pellets (MLT) |
2018(1) | 866.3 | 29.0 | 250.8 |
2015(2) | 829.8 | 31.9 | 264.4 |
2012(3) | 1,075.0 | 33.9 | 364.4 |
2009(4) | 1,012.1 | 31.6 | 320.2 |
2007(5) | 1,013.9 | 31.4 | 318.0 |
2004(6) | 1,015.1 | 31.7 | 321.5 |
2002(7) | 1,097.0 | 30.9 | 339.0 |
Notes:
1.As of October 24, 2018
2.As of January 1, 2015; Source: Cliffs_MMMR_TR_NSM_2015
3.As of April 14, 2012; dry; Source: NSM Reserve Estimate 2012
4.As of January 1, 2009; Source: NSM Reserve Estimate 2009
5.As of January 1, 2006; Source: NSM Reserve Estimate 2007
6.As of July 1, 2003; Source: NSM Reserve Estimate 2004
7.As of October 1, 2002; Source: NSM Reserve Estimate 2002
12.3Pit Optimization
Pit optimizations were carried out for Northshore in Vulcan using the current mine planning block model. Inputs used for the optimization are derived from actual production metrics and first principles estimation for the LOM forecast.
12.3.1Summary of Pit Optimization Parameters
The pit optimization parameters are summarized as follows:
•Base case product average price = $90/LT wet standard pellets (based on the mine planning model’s three-year trailing average of the realized product revenue rate of US$90.42/LT wet standard pellet).
•Crude ore mining cost = $3.22/LT crude ore.
•In situ waste mining cost = $2.35/LT mined.
•Unconsolidated waste mining cost = $2.00/LT mined.
•Crude ore haul distance incremental cost = $0.15/LT every 2,000 ft from crusher.
•Crushing and concentrating costs = $7.65/LT crude ore.
•Pelletizing and general cost = $26.36/LT dry pellet.
•Sustaining capital = $3.50/LT dry pellet.
•Maximum overall pit slope angle = 41° for all material.
•Pit restriction = mining lease boundary (the permit to mine boundary is the same as or greater than the mining lease boundary).
Cleveland-Cliffs Inc. | Northshore Property, SLR Project No: 138.02467.00001
Technical Report Summary - February 7, 2022 91
12.3.2Pit Optimization Results and Analysis
Pit optimization results are used as a guide for pit and stockpile designs. Pit optimizations were run by varying the base case product price with a block revenue factor. The risk profile and revenue-generating potential of the deposit is evaluated based on the relationship between crude ore and waste rock and the associated relative discounted cash flows generated at each incremental pit (a discount rate of 10% utilized for the optimization analysis).
The optimization results are summarized in Table 12-4, showing the pit shell results from a price range of $66.60/LT to $99.00/LT of wet standard pellets. Pit shell 15 was chosen for the Mineral Reserve final pit design, which is based on a wet standard pellet price of $79.20/LT.
Table 12-4: Pit Optimization Results
Cleveland-Cliffs Inc. – Northshore Property
| | | | | | | | | | | | | | | | | | | | | | | | | | |
| Pit Shell | Revenue Factor | Product Price ($/LT wet pellets) | Crude Ore (MLT) | Stripping (MLT) | Total Tons (MLT) | Strip Ratio | Process Recovery (%) | Dry Total Pellets (MLT) |
| 1 | 0.74 | 66.60 | 73 | 5 | 78 | 0.1 | 32.5 | 24 |
| 2 | 0.75 | 67.50 | 97 | 8 | 105 | 0.1 | 32.0 | 31 |
| 3 | 0.76 | 68.40 | 125 | 12 | 138 | 0.1 | 31.5 | 39 |
| 4 | 0.77 | 69.30 | 163 | 21 | 184 | 0.1 | 31.1 | 51 |
| 5 | 0.78 | 70.20 | 211 | 35 | 246 | 0.2 | 30.7 | 65 |
| 6 | 0.79 | 71.10 | 275 | 55 | 330 | 0.2 | 30.2 | 83 |
| 7 | 0.80 | 72.00 | 337 | 83 | 420 | 0.2 | 30.0 | 101 |
| 8 | 0.81 | 72.90 | 384 | 102 | 485 | 0.3 | 29.7 | 114 |
| 9 | 0.82 | 73.80 | 451 | 139 | 590 | 0.3 | 29.5 | 133 |
| 10 | 0.83 | 74.70 | 535 | 213 | 748 | 0.4 | 29.4 | 157 |
| 11 | 0.84 | 75.60 | 602 | 272 | 873 | 0.5 | 29.3 | 176 |
| 12 | 0.85 | 76.50 | 658 | 316 | 974 | 0.5 | 29.2 | 192 |
| 13 | 0.86 | 77.40 | 724 | 377 | 1,101 | 0.5 | 29.0 | 210 |
| 14 | 0.87 | 78.30 | 809 | 474 | 1,283 | 0.6 | 29.0 | 234 |
| 15 | 0.88 | 79.20 | 880 | 566 | 1,446 | 0.6 | 28.9 | 254 |
| 16 | 0.89 | 80.10 | 931 | 631 | 1,561 | 0.7 | 28.8 | 268 |
| 17 | 0.90 | 81.00 | 961 | 671 | 1,632 | 0.7 | 28.8 | 277 |
| 18 | 0.91 | 81.90 | 989 | 712 | 1,702 | 0.7 | 28.7 | 284 |
| 19 | 0.92 | 82.80 | 1,021 | 768 | 1,789 | 0.8 | 28.7 | 293 |
| 20 | 0.93 | 83.70 | 1,029 | 782 | 1,812 | 0.8 | 28.7 | 296 |
| 21 | 0.94 | 84.60 | 1,041 | 799 | 1,840 | 0.8 | 28.7 | 299 |
| 22 | 0.95 | 85.50 | 1,048 | 812 | 1,860 | 0.8 | 28.7 | 301 |
| 23 | 0.96 | 86.40 | 1,055 | 826 | 1,881 | 0.8 | 28.7 | 302 |
Cleveland-Cliffs Inc. | Northshore Property, SLR Project No: 138.02467.00001
Technical Report Summary - February 7, 2022 92
| | | | | | | | | | | | | | | | | | | | | | | | | | |
| Pit Shell | Revenue Factor | Product Price ($/LT wet pellets) | Crude Ore (MLT) | Stripping (MLT) | Total Tons (MLT) | Strip Ratio | Process Recovery (%) | Dry Total Pellets (MLT) |
| 24 | 0.97 | 87.30 | 1,060 | 836 | 1,896 | 0.8 | 28.7 | 304 |
| 25 | 0.98 | 88.20 | 1,063 | 842 | 1,905 | 0.8 | 28.7 | 305 |
| 26 | 0.99 | 89.10 | 1,068 | 854 | 1,923 | 0.8 | 28.7 | 306 |
| 27 | 1.00 | 90.00 | 1,072 | 863 | 1,935 | 0.8 | 28.6 | 307 |
| 28 | 1.01 | 90.90 | 1,076 | 871 | 1,947 | 0.8 | 28.6 | 308 |
| 29 | 1.02 | 91.80 | 1,078 | 876 | 1,953 | 0.8 | 28.6 | 309 |
| 30 | 1.03 | 92.70 | 1,079 | 880 | 1,959 | 0.8 | 28.6 | 309 |
| 31 | 1.04 | 93.60 | 1,080 | 883 | 1,963 | 0.8 | 28.6 | 309 |
| 32 | 1.05 | 94.50 | 1,081 | 886 | 1,968 | 0.8 | 28.6 | 310 |
| 33 | 1.06 | 95.40 | 1,083 | 893 | 1,976 | 0.8 | 28.6 | 310 |
| 34 | 1.07 | 96.30 | 1,086 | 901 | 1,987 | 0.8 | 28.6 | 311 |
| 35 | 1.08 | 97.20 | 1,087 | 903 | 1,990 | 0.8 | 28.6 | 311 |
| 36 | 1.09 | 98.10 | 1,087 | 905 | 1,992 | 0.8 | 28.6 | 311 |
| 37 | 1.10 | 99.00 | 1,087 | 906 | 1,993 | 0.8 | 28.6 | 311 |
Note. Numbers may not add due to rounding.
The optimization pit-by-pit graph (Figure 12-1) presents tonnages and relative discounted cash flow results, along with the selected final pit shell highlighted (revenue factor of 0.88).
Cleveland-Cliffs Inc. | Northshore Property, SLR Project No: 138.02467.00001
Technical Report Summary - February 7, 2022 93
Figure 12-1: Pit Optimization Pit-by-Pit Graph
As observed in Figure 12-1, at higher product prices there is limited opportunity for increased Mineral Reserves. This is because the overall pit size is being restricted by the mining lease boundary, which is limiting further advance of the pit highwall to the south.
12.4Mineral Reserve Cut-off Grade
The Mineral Reserve cut-off grade is a combination of metallurgical constraints applied in order to produce a saleable product followed by verification through a break-even cut-off grade calculation, as described in section 11.8.1. The Mineral Reserve cut-off requirements for candidate crude ore are a minimum of 19% MagFe, 63.5% Conc_Fe, or Grindability index of 30.0.
12.5Mine Design
The Northshore final pit design incorporates several design variables including geotechnical parameters (e.g., wall angles and bench configurations), equipment size requirements (e.g., mining height and ramp configuration), and physical mining limits (e.g., property boundaries and existing infrastructure). The following summarizes the design variables and final pit results; more detail is provided in the preceding subsections and in Section 13.0.
The final highwall pit slope is designed at an inter-ramp angle (IRA) of 41°. The bench design consists of 45 ft-high mining benches with a 65° bench face angle (BFA) and alternating 10 ft and 50 ft catch
Cleveland-Cliffs Inc. | Northshore Property, SLR Project No: 138.02467.00001
Technical Report Summary - February 7, 2022 94
benches (CB). In general, haulage access ramps are developed along the pit footwall slope, which is at less than 8% for the majority of the mining areas.
There are multiple physical mining limits that are applied to the pit optimization and/or the mine plan:
•There is a 600 ft restriction that limits the distance of blasting near the primary crusher.
•The Duluth Gabbro overlies the Biwabik IF in the vicinity of Northshore. The Duluth Gabbro is known to contain elevated levels of sulfide mineralization in some areas. Elevated levels of sulfide minerals in rock present the potential for acid rock drainage and metals leaching when the rock is blasted and stockpiled. Current permits with the MDNR and the Minnesota Pollution Control Agency (MPCA) prohibit the mining and stockpiling of Duluth Gabbro rock by NSM. As a result, a mining limit in the model restricts mining of the Duluth Gabbro.
•Mining limits for crude ore are restricted to within the Northshore-controlled mining leases and owned mineral lands and within the existing Permit to Mine (SLR notes the Permit to Mine boundary limit is shared with or greater in extent than the mineral lease boundary). These leases are with the Mesabi Trust, the State of Minnesota, and Philips-Conoco (formerly Burlington Northern). The Mesabi Trust lease includes the Peters Lease and the Cloquet Lease.
Of additional consideration is the allowance for trespass stripping, which is common among other mines on the Mesabi Range. Trespass stripping allows for mining of waste rock outside of Northshore’s current mineral leases (provided it is still within the Permit to Mine boundary), to expose crude ore to the mineral lease boundary.
The selected final pit shell compared to the final pit design is detailed in Table 12-5 and shown in Figure 12-2 along with the physical mining limits. Pit design results are reported prior to depletion, to be consistent with the pit optimization results.
Table 12-5: Pit Optimization to Pit Design Comparison
Cleveland-Cliffs Inc. – Northshore Property
| | | | | | | | | | | | | | | | | |
| Crude Ore
(MLT) | Crude Ore MagFe
(%) | Stripping
(MLT) | Total
Material
(MLT) | Strip
Ratio |
| Pit Optimization | 880 | 24.6 | 566 | 1,446 | 0.6 |
| Pit Design | 848 | 24.6 | 649 | 1,497 | 0.8 |
Notes:
1.Comparison totals are per the mine planning model prior to depletion.
2.Numbers may not add due to rounding.
With consideration of the mining physical limits noted above applied to the final pit design, the results of the final pit design are a reasonable representation of the final pit shell guide.
Cleveland-Cliffs Inc. | Northshore Property, SLR Project No: 138.02467.00001
Technical Report Summary - February 7, 2022 95
Figure 12-2: Northshore Pit Optimization and Pit Design Limits
Cleveland-Cliffs Inc. | Northshore Property, SLR Project No: 138.02467.00001
Technical Report Summary - February 7, 2022 96
13.0MINING METHODS
13.1Mining Methods Overview
The Northshore deposit is mined using conventional surface mining methods. The surface operations include:
•Overburden (glacial till) removal
•Drilling and blasting (excluding overburden)
•Loading and haulage
•Crushing and rail loading
The Mineral Reserve is based on the ongoing annual crude ore production of 16 MLT to 18 MLT producing a total of approximately 5.1 MLT of wet pellets for domestic consumption.
Mining and processing operations are scheduled 24 hours per day, and the mine production is scheduled to directly feed the processing operations.
The current LOM plan has mining scheduled for 48 years and mines the known Mineral Reserve. The average strip ratio is approximately 0.8 waste units to 1 crude ore unit (0.8 strip ratio).
The final Northshore pit is a single pit approximately 10.5 mi along strike, up to 1.2 mi wide, and up to 420 ft deep.
The Mine’s operation has a strict crude ore blending requirement to ensure the Plant receives a uniform head grade. The most important blending characteristics of the crude ore are the MagFe, Conc_Fe, and ore hardness (i.e., Grindability). Generally, three crude ore loading points from different subunit groupings (i.e., the Intermediate, High Grade, Footwall Group, and Lower Cherty subunit groupings) are mined at one time to obtain the best blend for the Plant.
Crude ore is hauled to the crushing facility and either direct tipped to the primary crusher or stockpiled in an area adjacent to the primary crusher. Haul trucks are alternated to blend delivery from the multiple crude ore loading points. The crude ore stockpiles are used as an additional source for blending and production efficiency. Crushed crude ore is conveyed to a silo, where it is loaded into 85-ton rail cars for transport to the Plant located 47 mi southeast of the Mine at Silver Bay, Minnesota. Waste rock is hauled to one of the many waste stockpiles within and around the pit.
The major pieces of pit equipment include electric drills, electric rope shovels, haul trucks, front-end loaders (FELs), bulldozers, and graders. Extensive maintenance facilities are available at the mine site to service the mine equipment.
13.2Pit Geotechnical
13.2.1Overview
The Northshore final pit is relatively shallow and, structurally, the in situ crude ore and rock is of good quality. In 2019, SRK conducted a geotechnical study to assess the global stability of the final pit wall configuration (SRK, 2019). The following paragraphs are key excerpts from the SRK report:
•SRK considers the slopes at Northshore to be properly designed and rock fall hazards to be sufficiently managed in active mining areas.
Cleveland-Cliffs Inc. | Northshore Property, SLR Project No: 138.02467.00001
Technical Report Summary - February 7, 2022 97
•The mining practices and slope conditions observed at the site demonstrate that safety and geotechnical stability are integral to the mine plan.
SLR has reviewed the pit photographs in the SRK report and concurs with SRK’s overall observations. Although there are signs that some operational practices around scaling could be improved on site with instances of loose material on the bench faces, there is no evidence of geotechnical instability that would prevent development of the final pit design.
Final wall slopes are at 41°, effectively the IRA, where there are no haul ramps in the final walls. The bench height (BH) is 45 ft with alternating CBs of 50 ft and 10 ft widths.
Haulage ramps are incorporated into the pit highwalls and footwalls. Ramp width is sized at 150 ft, which can safely support two-way traffic of the 240 ton-payload mining trucks.
The maximum pit depth and vertical highwall exposure is at approximately 420 ft. Geotechnical parameters incorporated into the Northshore pit design are summarized in Table 13-1 and Figure 13-1.
Table 13-1: Pit Design Geotechnical Parameters
Cleveland-Cliffs Inc. – Northshore Property
| | | | | | | | |
| Parameter | Unit | Final Wall |
| IRA | Degrees | 41 |
| BFA | Degrees | 65 |
| BH | ft | 45 |
| CB - Primary | ft | 50 |
| CB - Secondary | ft | 10 |
| Ramp Width - 2 way | ft | 150 |
| Ramp Gradient (Steepest) | % | 8 |
Cleveland-Cliffs Inc. | Northshore Property, SLR Project No: 138.02467.00001
Technical Report Summary - February 7, 2022 98
Figure 13-1: Northshore Final Pit Wall Geometry Example
13.2.2Geotechnical Data
The geotechnical data summary is based on the description from SRK, 2019. Data contained in the Northshore geotechnical database is summarized in Table 13-2.
Table 13-2: Summary of Geotechnical Data
Cleveland-Cliffs Inc. - Northshore Property
| | | | | | | | | | | | | | |
| Data Type | Sandvik (July 2012) | Barr Eng. (Dec 2012) | Northshore Drilling (June 2019) | Total |
| Core Recovery & RQD | - | - | 37,999ft, 159 drill holes | 37,999ft, 159 drill holes |
| Uniaxial Compressive Strength (UCS) Test | 15 | 15 | - | 30 |
| Brazilian Tensile Strength (BTS) Test | 15 | 15 | - | 30 |
| Dynamic Elastic Constant Tests | 15 | - | - | 15 |
| Direct Shear Tests on natural joints | - | 3 | - | 3 |
SRK recognized that the overall rock mass is typically governed by the frequency, orientation, and frictional strength of the fractures in the rock mass and that the data for these is limited for Northshore.
13.2.3Material Strength Parameters
The Rock Mass Rating (RMR) system (Bieniawski, 1989) was used for rock mass characterization and estimation of the strength of the rock mass. Rating values were assigned as ranges to provide upper and lower values of RMR as presented in Table 13-3.
Cleveland-Cliffs Inc. | Northshore Property, SLR Project No: 138.02467.00001
Technical Report Summary - February 7, 2022 99
Table 13-3: Rock Mass Characterization Using the RMR System Bieniawski, 1989
Cleveland-Cliffs Inc. - Northshore Property
| | | | | | | | | | | | | | |
| | Low Value | High Value | RMR Rating Low | RMR Rating High |
| UCS, MPa | 100 | 250+ | 12 | 15 |
| RQD, % | 53% | 73% | 9 | 13 |
| Joint Spacing, m | 0.1 | 0.25 | 9 | 11 |
| Joint Condition | Continuous, planar, not highly weathered | 19 | 26 |
| Groundwater | Wet | Damp | 7 | 11 |
| TOTAL RMR'89* | | | 55 | 75 |
*RMR was calculated by spreadsheet. Rating summation in the table do not appear to equate due to rounding of decimal points.
The Geological Strength Index (GSI, Hoek et al., 1992) was used as an alternative method of rock mass classification as it can be input directly into the Hoek-Brown shear strength criterion used for stability analysis. Ratings are based on fracture spacing and joint condition from estimates in the field. GSI ratings for Northshore were estimated between 53 to 78.
Hoek-Brown strength parameters were determined for the Slaty and Cherty rocks using lower bound UCS values and lower GSI values (Table 13-4). Mohr-coulomb strength parameters were estimated for the overburden, dump/fill, and the floor rocks (Table 13-5).
Table 13-4: Hoek-Brown Strength Parameters Used for Stability Modelling
Cleveland-Cliffs Inc. - Northshore Property
| | | | | | | | | | | | | | | | | | | | |
| Unit | Density (kg/m3) | GSI | UCS (MPa) | mb | s | a |
| Slaty | 2.70 | 45 | 60 | 1.403 | 0.002 | 0.508 |
| Cherty | 3.45 | 53 | 100 | 3.173 | 0.005 | 0.505 |
Table 13-5: Mohr-Coulomb Strength Parameters Used for Stability Modelling
Cleveland-Cliffs Inc. - Northshore Property
| | | | | | | | | | | |
| Material | Density (kg/m3) | Friction Angle (°) | Cohesion (MPa) |
| Overburden | 2.34 | 30 | 0.20 |
| Fill/Dump | 2.60 | 32 | 0.05 |
| Floor Rock | 2.60 | 35 | 1.50 |
13.2.4Hydrogeology and Pit Water Management
Surface water is abundant as the Mine site is surrounded by natural lakes and wetlands. Water is known to be present within the rock mass; however, inflow of water from the pit walls has not been a significant issue to operations.
Cleveland-Cliffs Inc. | Northshore Property, SLR Project No: 138.02467.00001
Technical Report Summary - February 7, 2022 100
Hydrogeological modeling has not been undertaken for the purposes of slope stability analysis. Rather, an apparent worst-case scenario was assumed based on field observations, where the piezometric surface was modeled close to behind the slope face. SLR considers this to be appropriate considering a lack of an alternative model.
Historically, in-pit dewatering activities have averaged 3.4 billion gallons per year with a permitted maximum of 5.5 billion gallons per year.
The maximum in-pit dewatering discharge rate permitted under the current National Pollutant Discharge Elimination System (NPDES) is 51.8 million gallons per day. The individual discharge outfall limits are 15.8, 17.3, and 18.7 million gallons per day at the B101, B104 and B105 combined, and B109 discharge outfalls respectively.
As detailed in section 15.9, the operation is in a net-positive water environment, and there is ample water available to meet the operations demand. Water used for dust control on roads comes from pit sumps.
13.2.5Stability Assessment
SRK carried out 2D limit-equilibrium analysis on one section cut through the southern highwall of the ultimate Northshore pit (SRK, 2019). The section was chosen for being one of the highest slopes at 380 ft, with a 65 ft-high stockpile at the crest. Groundwater was included in stability analysis as a worse case, near-saturated condition, providing a conservative analysis result with respect to groundwater. Rock mass disturbance due to blasting does not appear to be considered; however, if it were, this would have the effect of lowering the rock mass strength. The resultant Factor of Safety (FoS) of 4.0 is well in excess of the acceptance criteria given of 1.3.
13.3Open Pit Design
The Northshore pit design combines current site access, mining width requirements, geotechnical parameters, pit optimization results, and hard mining limits as described previously in Sections 12.0 and 13.0.
Table 13-6 summarizes the contents of the final pit design depleted to December 31, 2021. Figure 13-2 presents a plan view of the final pit design (waste rock stockpiles are not shown as they include in-pit backfills, which would obscure the final pit design view). Figure 13-3 presents an example cross-section through the final pit.
Table 13-6: Final Pit Design LOM Total, December 31, 2021
Cleveland-Cliffs Inc. – Northshore Property
| | | | | | | | | | | | | | | | | | | | | | | |
| Pit | Crude
Ore
(MLT) | Crude Ore MagFe
(%) | Waste Rock Stripping (MLT) | Overburden Stripping
(MLT) | Total Stripping
(MLT) | Total
Material
(MLT) | Strip
Ratio |
| Northshore | 822.4 | 24.6 | 582.9 | 50.8 | 633.7 | 1,456.2 | 0.8 |
Note. Numbers may not add due to rounding.
Cleveland-Cliffs Inc. | Northshore Property, SLR Project No: 138.02467.00001
Technical Report Summary - February 7, 2022 101
Figure 13-2: Northshore Final Pit Plan View
Cleveland-Cliffs Inc. | Northshore Property, SLR Project No: 138.02467.00001
Technical Report Summary - February 7, 2022 102
Figure 13-3: Example Final Pit Cross-section Looking Southwest
Cleveland-Cliffs Inc. | Northshore Property, SLR Project No: 138.02467.00001
Technical Report Summary - February 7, 2022 103
13.3.1Pit Phase Design
Intermediate pit phase designs or pushbacks are included in the LOM planning. The main purpose for phased designs is to balance waste stripping and haulage profiles over the LOM and ensure haulage access is maintained while developing the pit. Pit optimization results at lower revenue factors are used to help guide the phase development.
Phase designs for the deposit are largely based on the effective mining width of 200 ft, a minimum BH of 20 ft to allow for increased mining selectivity at the ore-waste contact, and access to the Mineral Reserves. The same bench design parameters used in the final pit design are incorporated into the phase pit designs. Figure 13-4 shows the location of the phases within the mining area, where the surface footprint of each phase is represented by a different color.
Cleveland-Cliffs Inc. | Northshore Property, SLR Project No: 138.02467.00001
Technical Report Summary - February 7, 2022 104
Figure 13-4: Northshore Intermediate Pit Phase Footprints
Cleveland-Cliffs Inc. | Northshore Property, SLR Project No: 138.02467.00001
Technical Report Summary - February 7, 2022 105
13.4Production Schedule
13.4.1Clearing
Before mining operations commence in new undeveloped areas, it is necessary to remove any overburden material. The primary clearing and grubbing equipment includes bulldozers, hydraulic shovels, FELs, and trucks. This equipment has been successfully deployed in historical overburden clearing operations at Northshore.
13.4.2Grade Control
As described in Section 6.0, the geology is well known with four simplified crude ore types identified at Northshore: Intermediate, High Grade, Footwall Group, and Lower Cherty. Northshore uses the resource block model and geologic subunit contact grids as tools for grade control along with the visual differences between waste and crude ore in the pit. Due to the continuity and relative stability of the subunits, these methods have proven to reconcile with the plant and resource model.
A primary loading unit is generally active in each crude ore type at all times to maintain a consistent blend for the Plant. Operationally, blending is done on a shift-by-shift basis. The dispatcher is given instructions each shift for the percentage of truck loads from each loading position. The dispatcher monitors the blend percentages and the MagFe using data from a magnetic coil located on the secondary crusher discharge belt and adjusts the loads and source of the loads as the shift progresses. Mixing of the crude ore delivered to the crushing facility takes place in the crushers, the train loading bin, and in the loading and dumping of rail cars. If the crushing facility is down for maintenance, then the loads are stockpiled on the ground in surge piles near the crusher and picked up later and crushed.
13.4.3Production Schedule
The basis of the production schedule is to:
•Produce a total of approximately 5.1 MLT/y of wet pellets for the LOM:
◦This production rate was selected as it represents maintaining the current production assumption throughout the LOM;
◦At least 90% of the crude ore used in pellet production must be mined from Mesabi Trust lands (for the first 6.0 MLT of pellets per year).
•Preserve blending of the crude ore types for as long as possible.
•Limit total mined tons per period at approximately 32 MLT to balance the mine fleet utilization.
The production schedule is planned yearly throughout the LOM. Scheduling is by mining blocks within the pit phases, with mining blocks sized at approximately 1 MLT per block during the first 20 years of the production schedule, and larger mining blocks (up to 30 MLT) for the remainder of the production schedule.
Table 13-7 presents the LOM mine production schedule for Northshore.
Cleveland-Cliffs Inc. | Northshore Property, SLR Project No: 138.02467.00001
Technical Report Summary - February 7, 2022 106
Table 13-7: LOM Mine Production Schedule
Cleveland-Cliffs Inc. – Northshore Property
| | | | | | | | | | | | | | | | | | | | | | | |
| Year | Crude Ore (MLT) | Crude Ore MagFe (%) | Stripping (MLT) | Total Tons (MLT) | Strip Ratio | Process Recovery (%) | Wet Pellets (MLT) |
| 2022 | 17.3 | 25.2 | 9.5 | 26.8 | 0.6 | 30.4% | 5.3 |
| 2023 | 16.6 | 25.6 | 12.9 | 29.5 | 0.8 | 30.9% | 5.1 |
| 2024 | 16.9 | 25.0 | 12.6 | 29.5 | 0.7 | 30.1% | 5.1 |
| 2025 | 16.9 | 25.0 | 12.6 | 29.5 | 0.8 | 30.1% | 5.1 |
| 2026 | 16.6 | 25.6 | 12.9 | 29.5 | 0.8 | 30.9% | 5.1 |
| 2027 | 16.4 | 25.6 | 14.6 | 31.0 | 0.9 | 30.9% | 5.1 |
| 2028 | 16.7 | 25.6 | 13.1 | 29.8 | 0.8 | 30.9% | 5.2 |
| 2029 | 17.1 | 25.0 | 12.4 | 29.5 | 0.7 | 30.1% | 5.1 |
| 2030 - 2034 | 82.8 | 25.4 | 64.9 | 147.7 | 0.8 | 30.7 | 25.4 |
| 2035 - 2039 | 83.8 | 25.3 | 65.2 | 149.0 | 0.8 | 30.5 | 25.5 |
| 2040 - 2044 | 85.6 | 24.6 | 78.9 | 164.5 | 0.9 | 29.6 | 25.3 |
| 2045 - 2049 | 86.2 | 24.7 | 76.4 | 162.6 | 0.9 | 29.7 | 25.5 |
| 2050 - 2054 | 87.7 | 24.1 | 79.3 | 167.0 | 0.9 | 28.8 | 25.3 |
| 2055 - 2059 | 88.1 | 24.0 | 74.9 | 163.0 | 0.9 | 28.7 | 25.2 |
| 2060 - 2064 | 87.9 | 23.9 | 57.2 | 145.1 | 0.7 | 28.5 | 25.1 |
| 2065 - 2069 | 85.8 | 23.3 | 36.4 | 122.2 | 0.4 | 26.9 | 23.2 |
| TOTAL | 822.4 | 24.6 | 633.7 | 1,456.2 | 0.8 | 29.4 | 241.6 |
Note. Numbers may not add due to rounding.
Recent past production (2015 to current) and LOM planned production for Northshore is summarized graphically in Figure 13-5.
Cleveland-Cliffs Inc. | Northshore Property, SLR Project No: 138.02467.00001
Technical Report Summary - February 7, 2022 107
Figure 13-5: Past and Forecast LOM Production
13.5Overburden and Waste Rock Stockpiles
Overburden and waste-rock material is stockpiled in designated stockpile areas based on where it was mined from and material type.
Northshore meets requirements for stockpiling of waste rock and overburden as required by the MDNR Reclamation Rules (6130.24 and 6130.27).
Waste rock is non-mineralized material or mineralized iron formation material that does not meet the cut-off grade criteria as designated on a per blast basis and is stockpiled in appropriately designated areas. The majority of waste rock is stockpiled within the final pit outline in mined-out areas on the north side of the pit (i.e., the final pit footwall). Stockpiling to the south of the pit is avoided where possible to prevent encumbrance of future potential Mineral Resources lying down-dip of the current pit.
The LOM plan includes a relatively small quantity of Type II Virginia Formation (VF) waste rock. VF waste rock is identified for special handling and is stockpiled in contained areas within the final pit outline, as described in Section 17.0.
Overburden stockpiles are designed to the south and outside of the final pit outline to take advantage of shorter hauls. The stockpile designs follow MDNR Reclamation rules for a maximum slope of 2.5 horizontal to 1 vertical after final sloping.
The overburden and waste rock stockpile design parameters are detailed in Table 13-8.
Cleveland-Cliffs Inc. | Northshore Property, SLR Project No: 138.02467.00001
Technical Report Summary - February 7, 2022 108
Table 13-8: Stockpile Parameters
Cleveland-Cliffs Inc. – Northshore Property
| | | | | | | | | | | |
| Parameter | Unit | Waste Rock | Overburden |
| Overall Slope Angle | degrees | 23 | 19 |
| Batter Angle | degrees | 36 | 36 |
| Bench Height | ft | 30 | 40 |
| Berm Width | ft | 30 | 75 |
| Ramp Width - 2 way | ft | 120 | 120 |
| Ramp Width - 1 way | ft | 70 | 70 |
| Ramp Gradient | % | 8 | 8 |
Waste rock and overburden stockpiles were designed and 3D solids were generated to calculate the volume of the stockpiles. Swell factors of 35% for waste rock and 10% for overburden were used to calculate the annual stockpile volume requirement.
Table 13-9 summarizes the volume and capacity for all stockpiles at Northshore along with the LOM stripping quantities based on the current mine planning model (i.e., prior to depletion).
Table 13-9: Waste Rock and Overburden Stockpile Capacities
Cleveland-Cliffs Inc. – Northshore Property
| | | | | | | | |
| Area | Volume
(million ft3) | Stockpile Capacity (MLT) |
| WASTE ROCK STOCKPILES | | |
| Design Capacity | 10,032 | 618 |
| LOM Plan Waste Rock | | 586 |
| OVERBURDEN STOCKPILES | | |
| Design Capacity | 1,152 | 56 |
| LOM Plan Overburden | | 51 |
SLR notes that there is sufficient overburden and waste rock stockpile capacity included in the LOM plan. In particular, there is approximately 68 MLT of VF waste rock identified in the LOM plan, while the waste rock stockpiles design capacity considers for up to 82 MLT of VF waste rock. Figure 13-6 shows the stockpile designs along with the final pit limits.
Cleveland-Cliffs Inc. | Northshore Property, SLR Project No: 138.02467.00001
Technical Report Summary - February 7, 2022 109
Figure 13-6: LOM Waste Rock and Overburden Stockpile Locations
Cleveland-Cliffs Inc. | Northshore Property, SLR Project No: 138.02467.00001
Technical Report Summary - February 7, 2022 110
In 2018, Golder Associates Inc. (Golder, 2018) assessed the current stockpiles using guidelines published by Hawley and Cunning (2017) to classify the instability hazard as either very low, low, moderate, high, or very high. All Northshore in-pit stockpiles were classified as being a low instability hazard, while two stockpiles located outside of the pit were rated as moderate (Shaigetz and Cunning, 2019).
13.6Mining Fleet
The primary mine equipment fleet consists of electric drills, electric cable shovels, and off-road dump trucks. In addition to the primary equipment, there are FELs, bulldozers, graders, water trucks, and backhoes for mining support. Additional equipment is on site for non-productive mining fleet tasks. The current fleet is to be maintained with replacement units as the current equipment reaches its maximum operating hours.
Table 13-10 presents the existing fleet (2022) and planned average major fleet requirements estimated to achieve the LOM plan.
Table 13-10: Major Mining Equipment
Cleveland-Cliffs Inc. – Northshore Property
| | | | | | | | | | | | | | | | | | | | |
| Year | Drills | Shovels | Trucks | Loaders | Dozers | Graders |
| 2022 | 5 | 4 | 10 | 1 | 2 | 3 |
| 2023 | 6 | 4 | 10 | 1 | 2 | 3 |
| 2024 | 6 | 4 | 10 | 1 | 2 | 3 |
| 2025-2029 | 6 | 4 | 10 | 1 | 2 | 3 |
| 2030-2034 | 6 | 4 | 10 | 1 | 2 | 3 |
| 2035-2039 | 6 | 4 | 10 | 1 | 2 | 3 |
| 2040-2044 | 6 | 4 | 12 | 2 | 3 | 3 |
| 2045-2049 | 6 | 4 | 12 | 2 | 3 | 3 |
| 2050-2054 | 6 | 4 | 12 | 2 | 3 | 3 |
| 2055-2059 | 6 | 4 | 12 | 2 | 3 | 3 |
| 2060-2065 | 5 | 4 | 11 | 1 | 2 | 4 |
| 2065-2069 | 4 | 4 | 9 | 1 | 2 | 3 |
| Size/Payload | 100,000 lb | 44 yd3 | 240 ton | 37 yd3 | 57 yd3 | 16 ft |
| Useful Life (hrs) | 90,000 | 120,000 | 85,000 | 60,000 | 65,000 | 65,000 |
| Example Unit | Sandvik DR412i | P&H 2800 XPC | Komatsu 830E | LeTourneau L1850 | CAT D11 | CAT 18M |
The primary loading and hauling equipment was selected to provide good synergy between mine selectivity of crude ore and the ability to operate in wet and dry conditions. Since crude ore is blended at the primary crusher, the loading units in crude ore do not operate at capacity.
Longer haulage distances will be realized as the Mine expands to the west. During the longer haulage periods, more trucks will be required, as seen during years 2040 through 2065 in Table 13-10.
Extensive maintenance facilities are available at the Mine site to service the mine equipment.
Cleveland-Cliffs Inc. | Northshore Property, SLR Project No: 138.02467.00001
Technical Report Summary - February 7, 2022 111
13.7Mine Workforce
Current mining headcount totals 184 and is summarized as follows:
•Mine operations – 96
•Mine maintenance – 56
•Mine supervision and technical services – 32
Mine operations and mine maintenance manpower will increase proportionately with the increase in haul trucks over the LOM. The additional required manpower will be sourced from local communities.
Cleveland-Cliffs Inc. | Northshore Property, SLR Project No: 138.02467.00001
Technical Report Summary - February 7, 2022 112
14.0PROCESSING AND RECOVERY METHODS
14.1Crushing and Rail Transport from Babbitt to Silver Bay
The Mine and primary and secondary crushing plant are located in Babbitt, Minnesota and the tertiary and quaternary crushing plant is located in Silver Bay, Minnesota. Mine haul trucks dump the crude ore directly into a 60 in. x 89 in. primary gyratory crusher. The primary crushed crude ore falls directly into the four, secondary 30 in. x 70 in. gyratory crushers located directly beneath the primary crusher, and is crushed to -4 in. The -4 in. material is conveyed into rail car loading bins and then loaded into trains and transported to Silver Bay, Minnesota, where the tertiary and quaternary crushing stations, the concentrator, and the pellet plant are located. Silver Bay is linked to Babbitt by a 47 mi rail track owned by Northshore Mining Railroad, a wholly owned Cliffs subsidiary. Upon arriving at Silver Bay, the secondary crushed crude ore (-4 in.) is dumped from the rail cars by automated, two-car dumpers and transported by belt conveyors to the tertiary-quaternary crushing plant storage silos. The crude ore is drawn from the silos and crushed to -0.75 in. in tertiary and quaternary Nordberg 7 ft shorthead cone crushers and then passed over double-drum dry cobbers for primary magnetic separation. Figure 14-1 illustrates the crushing flowsheet. There are no blending facilities at the concentrator, as crude ore blending is accomplished through the proper selection of the blast sites at the Mine and truck deliveries to the primary crusher.
14.2Concentrator
The following discussion of the concentrator is illustrated on the flowsheet presented in Figure 14-2. The concentrator building contains 17 complete sections and three partial scavenging sections. All 17 sections are similar as per layout, although there are some minor differences in equipment from one section to another. Two products are made in the concentrator: standard concentrate, which targets a pellet silica of 4.80%, and DR-grade concentrate, which targets a pellet silica of 2.00%. The concentrator flowsheet consists of the following unit operations:
•Rod milling – open circuit
•Cobber magnetic separation
•Ball milling – closed circuit
•Rougher magnetic separation
•Cyclone classification
•Cyclone overflow screening
•Finisher hydroseparation
•Finisher magnetic separation
•Finisher magnetic concentrate
•Primary concentrate reverse flotation (primary and secondary)
•Flotation concentrates hydroseparation
•Flotation concentrate thickening
•Concentrate collection and vacuum filtration
•Filter cake conveyed to pellet plant
Cleveland-Cliffs Inc. | Northshore Property, SLR Project No: 138.02467.00001
Technical Report Summary - February 7, 2022 113
Crushed ore (-0.75 in.) from the quaternary crushing station is treated in double-drum, dry cobber magnetic separators. The cobber concentrate is sent to rod mills by belt conveyors, and the cobber tails (approximately 13% of the incoming crude ore) are hauled by rail and discarded as coarse final tails. The cobber concentrate has a MagFe target of 28.5%.
The magnetic cobber concentrate is fed to the rod mills, which are operated in an open circuit configuration. The rod mill discharge is treated in rougher, low-intensity, drum magnetic separators. The resulting magnetic rougher concentrate is pumped to a cluster of 10 cyclones (Cavex Cyclones), which are operated in closed circuit with two parallel ball mills to produce a final grind of 90% passing 325 mesh (45 micron) in the cyclone overflow. The cyclone underflow is returned to the ball mills for additional grinding, with the ball mill discharge combining with the rod mill discharge in the rougher, low-intensity, drum magnetic separators.
The cyclone overflow passes through magnetizing coils that cause magnetite particles to flocculate prior to being fed to two parallel primary hydroseparators. The primary hydroseparator overflow, composed mainly of silica particles, discharges to the tailings launder. The heavy primary hydroseparator underflow product is then pumped through demagnetizing coils and fed to the fine primary and secondary screen station (eight sets of primary screens and eight sets of secondary screens per section). The screen undersize is then passed through magnetizing coils to be flocculated prior to being fed to the finisher hydroseparator. Screen oversize is returned to the rougher concentrate pumps to be re-processed through the cyclones.
The finisher hydroseparator overflow is discharged to the tailings launder, and the dense underflow is pumped to two parallel, double-drum finisher magnetic separators. The finisher magnetic separator tails are discharged to the tailings launder, and the concentrate is pumped to the primary flotation cells. The primary flotation concentrate is thickened to a target density in the flotation hydroseparator after first passing through a magnetizing block to produce the final iron concentrate product, which is pumped to the concentrate collection sump. The flotation hydroseparator overflow is discharged to the tailings launder. The concentrate collected from the sections is sent to the 40 ft concentrate thickener in the filter building for dewatering and then to the vacuum disc filtration circuit for final dewatering. Filter cake at 9.5% moisture is transported by belt conveyors to the pellet plant concentrate bins. Standard final concentrate has an iron grade of approximately 68% Fe and a particle size of 90% passing 325 mesh. DR-grade final concentrate has an iron grade of approximately 70% Fe and a particle size of 93% passing 325 mesh.
During standard concentrate production, the primary flotation cell tails are pumped to the regrind ball mill, first passing through the regrind magnetic separator. The reground product is then pumped to the secondary flotation cells. The secondary flotation concentrate is re-processed in the primary flotation circuit, whereas the secondary flotation tails are sent to the tailings launder. Silica contaminants are floated using cationic amine collectors.
During DR-grade concentrate production, the primary flotation cell tails stream is directed to either the regrind ball mill or to the scavenger sump. Depending on ore quality and process performance, the secondary flotation tails can also be sent to either the tailings launder or the scavenger sump. The primary and secondary flotation tails sent to the scavenger sump are then sent to a scavenger collection sump at the Nuclear On-Line Analyzer (NOLA) stations, where they are then sent to the scavenger building for dewatering and storage.
Cleveland-Cliffs Inc. | Northshore Property, SLR Project No: 138.02467.00001
Technical Report Summary - February 7, 2022 114
NSM uses NOLAs to measure the amount of silica in the concentrate. Deviations in silica readings or silica concentration can cause large fluctuations in the section performance, resulting in decreased section recovery and throughput. There are four operational NOLAs (1, 2 ,3, and 4) at Northshore, and each NOLA analyzes feed from five sections. The silica content is measured every 20 to 30 minutes for each section. A control loop adjusts the reagent dosing automatically based on silica content. If the silica level is high, the reagent increases. The inverse is true when a low silica value is reported, and the reagent rate decreases, resulting in floating off less silica particles in the flotation circuit.
Soda ash is added to the concentrator process water system to achieve target water hardness, by causing precipitation of any calcium ions, which would otherwise compete with the amine collector for adsorption onto the silica mineral surfaces.
The main reagents used in the concentrator include:
•Amine is one of the two chemicals used to make reagent for use in flotation.
•Frother used in flotation is 2-ethyl hexanol, an aliphatic alcohol.
•Soda ash or sodium carbonate (Na2CO3) is a white powder that is used in an aqueous solution in the concentrator grinding circuits to control the water chemistry.
•Cationic polymers are used as flocculants in the clarifiers and in the water treatment plant.
Cleveland-Cliffs Inc. | Northshore Property, SLR Project No: 138.02467.00001
Technical Report Summary - February 7, 2022 115
Figure 14-1: Northshore Crushing Flowsheet
Cleveland-Cliffs Inc. | Northshore Property, SLR Project No: 138.02467.00001
Technical Report Summary - February 7, 2022 116
Figure 14-2: Northshore Concentrator Flowsheet
Cleveland-Cliffs Inc. | Northshore Property, SLR Project No: 138.02467.00001
Technical Report Summary - February 7, 2022 117
14.2.1Scavenging
Economic recovery of iron to make the DR-grade concentrate and pellets requires the diversion, collection, and re-processing of part of the middling slurry stream coming from the primary flotation froth and the secondary flotation froth on each concentrator section producing DR-grade concentrate. Due to a lower silica set-point on the DR-grade sections, the reagent addition rate increases at the section, resulting in increased flotation tails. The two flotation froth streams on each DR-grade section are directed to a sump and pump that transfers the “scavenged material” from each section to the scavenger transfer pumps in each of the four NOLA buildings. The scavenger sumps and pumps in each NOLA then transfer material to the scavenger building.
14.3Pellet Plant
The pellet plant and yard operations are illustrated in Figure 14-3.
After vacuum disc filtering, the concentrate is transported by belt conveyors to the balling circuit. The following description relates only to the circuits linked to the newer furnaces 11 and 12 at Silver Bay.
The concentrate is rolled in a balling drum to produce green balls at a target size of +3/8 in. to 1/2 in. Target wet strength is required to survive the journey to the furnace as well as support the furnace bed thickness in the early drying zone. The following balling circuit variables determine the quality of the green pellets:
•Balling drum speed in revolutions per minute (rpm) - Increasing the drum rotation does the following:
◦Increases the size of the green pellet.
◦Decreases the recycle tons.
•Bentonite addition - Adding bentonite does the following:
◦Serves as a binder.
◦Absorbs excess moisture.
◦Decreases the size of the green pellet.
◦Reduces explosions of green pellets in the furnace.
◦Increases silica.
•Organic binder addition - Adding organic binder does the following:
◦Serves as a binder.
◦Reduces bentonite addition rates.
◦Pushes the moisture to the surface of the pellet.
◦Increases reducibility of the pellet.
◦Decreases silica.
•Concentrate grind does the following:
◦A coarse grind increases ball size.
Cleveland-Cliffs Inc. | Northshore Property, SLR Project No: 138.02467.00001
Technical Report Summary - February 7, 2022 118
◦A coarse grind contains less than 89% passing 325 mesh.
◦A fine grind contains more than 92% passing 325 mesh. The feed varies with the grinding requirements to remove undesired silica from the concentrate.
◦Concentrate grind sizes outside the target limits negatively affects filter cake moisture control.
•Concentrate moisture - Moisture content of the concentrate feed, or filter cake, should range between 9.4% and 9.6% water.
•Water sprays - There are both automatic and manual water sprays in the balling drum to add moisture to the concentrate.
•Green pellet roll screen - The roll screen determines green pellet size and the quantity of recycle tons in the balling drums. The gap between rollers is set to meet the customers’ sizing requirements.
The balling drums are 30 ft long and inclined in the direction of the green ball movement and discharge onto a roll-type sizing screen. The balling drums are rubber lined and rotate between 5 rpm and 12 rpm. The green pellet roll screen determines the green ball size. The roll screen consists of 51 rollers. The upper 43 rollers are spaced 0.375 in. apart to let undersized material drop onto the recycle belt beneath the rollers. The last eight rollers are spaced 0.5 in. apart to allow +0.375 in. to - 0.5 in. product-sized green pellets to fall onto the belt for feeding to the furnace. Spacer bars are used to check and adjust the spacing of the rollers.
The roll screen oversize is broken up by a pulverizer that breaks up oversize material that passes over the last eight rollers of the roll screen.
In the filter section, limestone is added at 0.85 wt% during standard production and 0.80% during DR-grade pellet production. Two binders are used at Northshore to assist with making a green pellet: Wyoming bentonite (sodium montmorillonite) and an organic binder.
The pellet plant follows the straight grate technology, using drums for balling and a traveling grate furnace for drying, preheating, and firing the pellets. Natural gas provides a heat supply of approximately 620,000 Btu per ton of pellets. Two 240 LT per hour (LT/h) furnaces and two 105 LT/h furnaces are available. Furnace production rates are dependent upon meeting customer quality targets.
The No. 11 and No. 12 grate furnaces, which consist of approximately 280, 8 ft x 2 ft pallets with 20 in. side plates, are continuous traveling, conveyor-type furnaces that have upper and lower return strands of pallets. The pallets ride on the top and bottom rails and in double rails at the feed and discharge ends of the furnaces. Each pallet has approximately 57 grate bars with air spaces between the bars. The pallets move along the top strand through the furnace zones from the feed end of the furnace.
The upper strand of pallets accepts an 18 in. layer of green balls that are produced in the balling drums. The upper strand of pallets also accepts a hearth layer of fired pellets. The green balls are dried, fired, cooled, and discharged while the pallets ride over twenty-seven 8 ft2 windboxes. The windboxes are connected by a series of twenty-seven downcomers to the main furnace air ducts, breechings, and six process fans. Each windbox has a dust leg with a dump valve that allows dust, fines, or pellets that infiltrate the system through the grate bars on the pallets to be dumped. Pellet plant process air is cleaned by wet electrostatic precipitators that collect the airborne dust.
The hearth layer of pellets protects the grate bars from excessive heat and ensures good quality pellets in the bottom layer of green balls by providing a more uniform heat transfer.
Cleveland-Cliffs Inc. | Northshore Property, SLR Project No: 138.02467.00001
Technical Report Summary - February 7, 2022 119
Figure 14-3: Pellet Plant and Yard Flowsheet
Cleveland-Cliffs Inc. | Northshore Property, SLR Project No: 138.02467.00001
Technical Report Summary - February 7, 2022 120
14.4Major Equipment
A list of all major equipment is provided in Table 14-1.
Table 14-1: Major Processing Equipment
Cleveland-Cliffs Inc. – Northshore Property
| | | | | | | | | | | | | | | | | |
| Area | Equipment | Model | In Use | Size | Power |
| Coarse Crusher | Gyratory Crusher | Allis Chalmers | 1 | 60" x 90" | 1,000 hp |
| Coarse Crusher | Gyratory Crusher | Allis Chalmers | 4 | 30" x 70" | 350 hp |
| Fine Crusher | Short Head Cone Crusher | Symons | 12 | 7’ | |
| Dry Cobb | Double-Drum Magnetic Separator | Stearns | 12 | 36" x 120" | |
| Concentrator | Rod Mill | Allis Chalmers | 18 | 10.5'ø x 18' | 870 hp |
| Concentrator | Ball Mill | Allis Chalmers | 20 | 10.5'ø x 18' | 1,000 hp |
| Concentrator | Ball Mill | Allis Chalmers | 14 | 10.5'ø x 16' | 800 hp |
| Concentrator | Regrind Mill | Allis Chalmers | 17 | 8'ø x 12' | 350 hp |
| Concentrator | Rougher Magnetic Separators | Svedala | 17 | 48" x 10' | |
| Concentrator | Finisher Magnetic Separators | Stearns | 40 | 36" x 8' | |
| Concentrator | Regrind Magnetic Separators | Stearns | 20 | 36" x 10" | |
| Concentrator | Primary Hydro Separator | Dorr - Oliver | 20 | 18' ø | |
| Concentrator | Primary Hydro Separator | Dorr - Oliver | 14 | 16' ø | |
| Concentrator | Finisher Hydro Separator | Dorr - Oliver | 20 | 16' ø | |
| Concentrator | Flotation Hydro Separator | Dorr - Oliver | 20 | 16' ø | |
| Concentrator | Flotation Cells | Denver | 80 | 500ft3 | |
| Scavenger | De-Watering Magnetic Separator | Eriez | 6 | 48" x 10' | |
| Filter Building | Filters - 10 Disk | Dorr - Oliver | 10 | 9' ø | |
| Filter Building | Vacuum Pumps | Nash | 20 | | 500 hp |
| Pelletizer | Cooling Fan (Furnace 11&12) | Westinghouse | 2 | 254,000 acfm | 1,750 hp |
| Pelletizer | Furnace Fan (Furnace 11&12) | Westinghouse | 2 | 335,000 acfm | 900 hp |
| Pelletizer | Waste Gas Fan (Furnace 11&12) | General Electric | 2 | 215,000 acfm | 1,750 hp |
Cleveland-Cliffs Inc. | Northshore Property, SLR Project No: 138.02467.00001
Technical Report Summary - February 7, 2022 121
| | | | | | | | | | | | | | | | | |
| Area | Equipment | Model | In Use | Size | Power |
| Pelletizer | Recuperation Fan (Furnace 11&12) | General Electric | 2 | 464,000 acfm | 3,000 hp |
| Pelletizer | Updraft Drying Fan (Furnace 11&12) | Electric Machine | 2 | 447,000 acfm | 3,000 hp |
| Pelletizer | Hood Exhaust Fan (Furnace 11&12) | Westinghouse | 2 | 314,000 acfm | 500 hp |
14.5Plant Performance
Table 14-2 shows the production performance of the Plant from 2008 to 2020. Crude ore is magnetite taconite grading approximately 25% MagFe. Concentrate production has ranged from 3.1 MLT dry to 5.5 MLT dry per year (MLT/y), with a 12 year average of 4.45 MLT/y dry. Concentrate is fed to the pellet plant to produce pellets, which are sold as the main final product. Pellet production has ranged from 3.1 MLT/y to 5.6 MLT/y dry, with a 12-year average of 4.54 MLT/y.
Table 14-2: Crude to Pellet Recoveries
Cleveland-Cliffs Inc. – Northshore Property
| | | | | | | | | | | | | | | | | | | | | | | | | | | | | | | | |
| | Crude Ore Delivered | Rod Mill Feed %Fe | Dry Cobb Recovery | Rod Mill Feed LT | Concentrator Recovery | Concentrate LT | Concentrate % Fe | Pellets Dry LT | Pellet % Fe | Crude to Pellet Recovery |
| 2008 | 15,882,123 | 27.7% | 83.7% | 13,293,337 | 38.66% | 5,139,846 | 67.85 | 5,311,267 | 65.07 | 33.44% |
| 2009 | 9,392,021 | 27.9% | 87.6% | 8,227,410 | 36.94% | 3,039,489 | 67.93 | 3,096,762 | 65.12 | 32.97% |
| 2010 | 14,540,209 | 28.6% | 87.4% | 12,708,143 | 37.39% | 4,751,702 | 67.90 | 4,619,666 | 65.01 | 31.77% |
| 2011 | 17,342,420 | 28.8% | 86.1% | 14,931,824 | 37.11% | 5,540,709 | 67.90 | 5,599,674 | 65.08 | 32.29% |
| 2012 | 15,977,322 | 28.1% | 86.8% | 13,868,315 | 36.93% | 5,120,937 | 67.99 | 5,086,819 | 65.22 | 31.84% |
| 2013 | 11,750,388 | 28.3% | 84.6% | 9,940,828 | 37.17% | 3,695,091 | 67.96 | 3,773,450 | 65.06 | 32.11% |
| 2014 | 15,222,026 | 28.7% | 85.4% | 12,999,610 | 38.14% | 4,958,315 | 67.90 | 5,111,579 | 65.12 | 33.58% |
| 2015 | 12,045,587 | 28.7% | 87.1% | 10,491,706 | 37.64% | 3,949,373 | 67.91 | 4,103,708 | 65.23 | 34.07% |
| 2016 | 9,512,268 | 28.5% | 86.7% | 8,247,136 | 37.21% | 3,068,474 | 67.80 | 3,118,248 | 65.11 | 32.78% |
| 2017 | 14,503,761 | 28.5% | 90.1% | 13,067,889 | 37.88% | 4,950,089 | 67.88 | 5,088,295 | 65.22 | 35.08% |
| 2018 | 15,332,354 | 28.5% | 90.3% | 13,845,116 | 38.06% | 5,268,850 | 67.85 | 5,360,332 | 65.07 | 34.96% |
| 2019 | 15,045,388 | 28.3% | 90.9% | 13,670,899 | 34.46% | 4,710,344 | 68.44 | 5,056,282 | 65.50 | 33.61% |
| 2020 | 10,632,293 | 28.9% | 90.3% | 9,600,961 | 38.66% | 3,711,560 | 68.04 | 3,711,942 | 65.56 | 34.91% |
14.6Pellet Quality
The customers purchasing NSM pellets monitor the physical and chemical characteristics of the pellets with respect to required specifications. Northshore products must meet these specifications to be accepted as shown in Table 14-3, Table 14-4, and Table 14-5.
Cleveland-Cliffs Inc. | Northshore Property, SLR Project No: 138.02467.00001
Technical Report Summary - February 7, 2022 122
Table 14-3: Standard Pellets – Cargo Specification
Cleveland-Cliffs Inc. – Northshore Property
| | | | | | | | | | | |
| Quality Variable | Cargo Specification |
| Min | Target | Max |
| Iron | 65.00 | N/A | N/A |
| Silica | 4.60 | 4.80 | 5.00 |
| CaO | 0.77 | 0.85 | 1.20 |
| P | 0.016 | 0.021 | 0.025 |
Na2O+K2O | N/A | 0.062 | 0.073 |
| -1/4" BT | N/A | 1.90 | 3.60 |
| + 1/4 AT | 95.3 | N/A | N/A |
| -28 Mesh AT | 3.0 | N/A | N/A |
| Compression, Average | 400 | 440 | N/A |
| -300 lb Compression | N/A | 15.0 | 20.0 |
| -1/2" +3/8" Sizing | 80.0 | 86.0 | N/A |
| +1/2" Sizing | N/A | 2.8 | 7.0 |
| Moisture | N/A | 2.75 | 4.30 |
Note: BT is before tumble testing and AT is after tumble testing.
Table 14-4: DR-Grade Coated Pellets – Cargo Specification
Cleveland-Cliffs Inc. – Northshore Property
| | | | | | | | | | | |
| Quality Variable | Cargo Specification |
| Min | Target | Max |
| Iron | 67.10 | 67.35 | N/A |
| Silica | 1.75 | 2.00 | 2.25 |
| CaO | N/A | 0.80 | N/A |
| P | N/A | 0.016 | N/A |
| Na2O+K2O | N/A | 0.040 | 0.070 |
| + 1/4 AT | 95.0 | N/A | N/A |
| Compression, Average | 450 | 500 | N/A |
| -300 lb Compression | N/A | N/A | N/A |
| -1/2" +3/8" Sizing | 80.0 | 85.0 | N/A |
| +1/2" Sizing | N/A | 7.5 | N/A |
| Moisture | N/A | 2.5 | 4.20 |
Cleveland-Cliffs Inc. | Northshore Property, SLR Project No: 138.02467.00001
Technical Report Summary - February 7, 2022 123
Table 14-5: DR-Grade Uncoated Pellets – Cargo Specification
Cleveland-Cliffs Inc. – Northshore Property
| | | | | | | | | | | |
| Quality Variable | Cargo Specification |
| Min | Target | Max |
| Iron | 67.10 | 67.35 | N/A |
| Silica | 1.75 | 2.00 | 2.25 |
| CaO* | N/A | 0.80 | N/A |
| P | N/A | 0.016 | N/A |
| Na2O+K2O | N/A | 0.040 | 0.070 |
| + 1/4 AT* | 95.0 | N/A | N/A |
| Compression, Average | 450 | 500 | N/A |
| -300 lb Compression | N/A | N/A | N/A |
| -1/2" +3/8" Sizing | 80.0 | 85.0 | N/A |
| +1/2" Sizing | N/A | 7.5 | N/A |
| Moisture | N/A | 2.5 | 4.20 |
SLR has reviewed yearly performance data for NSM standard and DR-grade pellet production since 2014 and notes that Cliffs has achieved these specifications on a consistent basis during that period.
14.7Consumable Requirements
Current requirements for energy and process consumables are shown in Table 14-6 and Table 14-7.
Table 14-6: Energy Usage Per Long Ton of Pellets
Cleveland-Cliffs Inc. – Northshore Property
| | | | | | | | |
| Energy Usage | Unit | Usage |
| Natural Gas | MBTU/LT | 620 |
| Total Electrical Power | kWh/LT | 132.38 |
| Pit | kWh/LT | 8.43 |
| Crusher | kWh/LT | 9.79 |
| Concentrator | kWh/LT | 72.68 |
| Pellet Plant | kWh/LT | 40.88 |
| General Operating | kWh/LT | 0.60 |
| Total Water Consumption | gal/LT | 72.81 |
| Process Makeup | gal/LT | 65.45 |
| Dust Control | gal/LT | 7.36 |
Cleveland-Cliffs Inc. | Northshore Property, SLR Project No: 138.02467.00001
Technical Report Summary - February 7, 2022 124
Table 14-7: Consumable Usage
Cleveland-Cliffs Inc. – Northshore Property
| | | | | | | | |
| Consumables | Unit | Usage |
| Concentrator | | |
| Grinding Balls and Rods | lb/LT Pellet | 4.48 |
| Diamine | lb/LT Pellet | 0.144 |
| Flocculant | lb/LT Pellet | 0.027 |
| Soda Ash | lb/LT Pellet | 1.556 |
| Frother | lb/LT Pellet | 0.027 |
| Pelletizer | | |
| Bentonite | lb/LT Pellet | 9.0 |
| Organic | lb/LT Pellet | 0.50 |
| Fluxstone | lb/LT Pellet | 26.93 |
14.8Process Workforce
Current processing headcount totals 269 and is summarized as follows:
•Plant operations – 139
•Plant maintenance – 90
•Plant supervision and technical services – 40
Cleveland-Cliffs Inc. | Northshore Property, SLR Project No: 138.02467.00001
Technical Report Summary - February 7, 2022 125
15.0INFRASTRUCTURE
15.1Roads
The Mine is located approximately four miles southeast of the city of Babbitt, Minnesota. The Mine is accessed from St. Louis County Road 112 (Figure 15-1).
The Plant is located 47 mi to the southeast and immediately adjacent to the city of Silver Bay, Minnesota in Lake County. The facility is accessed from MN Highway 61.
Both sites are accessed by County, State, and Federal paved and unpaved roads. Both sites are easily accessible from the major regional population center of Duluth, Minnesota, which is located approximately 50 mi to the southwest.
15.2Rail
Crushed crude ore is transported via rail from the Mine site near Babbitt to the Plant at Silver Bay. Tailings produced at the processing plant are backhauled on the same railroad to the Milepost 7 Tailings Basin. These Northshore Mining Railroad operations are operated by the wholly owned Cliffs subsidiary, Northshore Mining Company.
ROM crude ore is crushed to minus four inches at the mine site and stored in 7,500 LT-capacity loading bins. From the loading bins, rail cars are loaded by pulling the train under the loading bins. A crushed crude ore stockpile is maintained after the loading bins at the mine to provide blended crude ore to the processing plant as necessary. The crushed crude ore stockpile is utilized when trains cannot be loaded due to scheduled maintenance or in cases of unscheduled downtimes to the crushing or load-out facilities at the mine. The stockpile is built by loading Caterpillar 777-sized trucks from the loading bins and hauling the crushed crude ore to the stockpile. Material is reclaimed from the stockpile by Caterpillar 992 loaders and loaded directly into crude ore cars.
Unit trains move an average of 50,000 LT/d of crude ore and 10,000 stpd of dry tailings.
The unit trains use open-top rotary dumping cars that discharge their load into the fine crusher bins. The rotary car dump was replaced in 2010 and allows for two cars to be discharged without uncoupling the train. Material in this bin is fed into the beneficiation circuit for upgrading to pellet specifications.
Seventeen diesel locomotives are used in the system, with two rated at 1,200 hp, two at 2,000 hp, and the remainder at 3,000 hp. Each train is made up of 156 cars rated at 80 LT each for a train capacity of 12,480 LT. Rolling stock includes 674 open-top rotary dump cars, 37 side-dump tailings cars with a capacity of 80 LT, flat bed cars, and bottom-dump cars.
The track system includes:
•47 mi of mainline track, 22.2 mi of which is single track with the remainder being double track, from Babbitt to Silver Bay
•Upper and Lower Silver Bay Yard
•Babbitt Yard and workshops
•Northshore Junction
•Milepost 7 Tailings Siding
Cleveland-Cliffs Inc. | Northshore Property, SLR Project No: 138.02467.00001
Technical Report Summary - February 7, 2022 126
Dry tailings from the concentrator are loaded in 80 LT side-dump cars at Silver Bay and hauled to the Milepost 7 Tailings Basin. Their load is discharged at this site for permanent storage.
Maintenance of the rail line and rolling stock is done by NSM personnel in workshops located at the Mine site in Babbitt. Locomotive fueling is performed by contractors at the Babbitt and Silver Bay Yards; no fueling stations are located at either Northshore yard.
An overall diagram of the rail system is shown in Figure 15-2.
Cleveland-Cliffs Inc. | Northshore Property, SLR Project No: 138.02467.00001
Technical Report Summary - February 7, 2022 127
Figure 15-1: Northshore Roads and Rail
Cleveland-Cliffs Inc. | Northshore Property, SLR Project No: 138.02467.00001
Technical Report Summary - February 7, 2022 128
Figure 15-2: Northshore Mining Railroad
15.3Port Facilities
The port serves two primary purposes: to load ships with iron pellets, and to receive limestone. The facility includes the following:
•3,500,000 LT and 490,000 LT pellet stockpiles
•Caterpillar 992 FEL for reclaiming from stockpile
•50,000 LT short-term boat loading bins and belt feeders
•Two parallel, 4,000 LT/h boat loaders
•Automatic sample collection equipment
•3,000 ft-long berth that can accommodate one self-unloading stone boat and one pellet boat docked at the same time
•Normal boat capacity of 25,000 LT to 60,000 LT
•60,000 LT vessel loaded in 10 hours
The channel was dredged in 2018 to maintain access for larger 1,000 ft (60,000 LT capacity) boats. The normal shipping season is from mid- to late March through early to mid-January with United States Coast Guard icebreakers used during heavy ice conditions.
Off-loading at the port is completed by self-unloading vessels only. No unloading equipment is present at the port. The facility has staff of 26 people working around the clock year round. During the non-
Cleveland-Cliffs Inc. | Northshore Property, SLR Project No: 138.02467.00001
Technical Report Summary - February 7, 2022 129
shipping season, staff continues operating pellet stockpile conveyors and performing maintenance. A photograph of the port facility is shown in Figure 15-3.
Figure 15-3: Silver Bay Port Facility
15.4Tailings Disposal
NSM operates a tailings storage facility (TSF), which encompasses approximately 2,500 acres located approximately seven miles by rail northwest of the Plant, referred to as the Milepost 7 Tailings Basin. The TSF is unlined and is comprised of three perimeter dams (Dams 1, 2, and 5) with natural ground abutments and one interior dam that forms the reclaim water pond (Reclaim Dam). The tailings basin currently encompasses nearly 2,100 acres of land and a 3,500 acre watershed.
The tailings basins were permitted as unlined facilities, with the foundation materials and tailings providing a low-permeability material to reduce seepage.
NSM generates two tailings streams. The first is plant aggregate, which is a portion of the tailings stream produced from the concentrating process, defined as the combined dry cobb aggregate (approximately 60% to 80% of the tailings) and filter sands (approximately 20% to 40%) classified as poorly graded gravel with sand. The plant aggregate is hauled by rail from the Plant, approximately seven miles to the basin, and used to construct the containment dams (Dams 1, 2, and 5) and other structures. The second product is the fine-fraction tailings, which is defined by Northshore as the -200 mesh (75 micron-size) product of the concentrating process. The fine-fraction tailings are pumped to the TSF in a slurry at a rate of approximately 8,500 gpm at 35% solids and are discharged upstream of Dams 1 and 2 to create beaches to provide a seal for limiting seepage through the dams. Water that is retained by Dam 2 (North Pond) is allowed to flow in a culvert connected to water retained by Dam 1 (South Pond). From the South Pond, water overflows a weir into the Reclaim Pond, where water is pumped back to the mill for re-use or treated and discharged to the Beaver River. The water treatment
Cleveland-Cliffs Inc. | Northshore Property, SLR Project No: 138.02467.00001
Technical Report Summary - February 7, 2022 130
plant reduces the volume of free water accumulating in the basin, minimizes the pond level rises, and limits the need to raise the dams.
The TSF configuration is presented in Figure 15-4, and the facilities are discussed in the following sections.
Source: Barr, 2019
Figure 15-4: Tailings Storage Facility Layout
Cleveland-Cliffs Inc. | Northshore Property, SLR Project No: 138.02467.00001
Technical Report Summary - February 7, 2022 131
15.4.1Facility Description
15.4.1.1Dam 1
Dam 1 is located on the southern end of the Milepost 7 Tailings Basin. The dam is currently approximately 10,000 ft long and 110 ft high.
The general stratigraphy of native soils beneath the dam consists of lacustrine clay deposits that are 10 ft to 20 ft thick and glacial till of varying thickness, with bedrock below the till. The dam was initially constructed as a sand and gravel starter dam with an upstream clay face.
The original intent was to raise the dam using downstream construction methods; however, as a result of closure activities in the 1980s, regulators required operation and construction under the Consensus Closure Plan when the Plant restarted in the 1990s and during operation until 1996. This arrangement required placement of plant aggregate and filters over the fine tailings beach out to a distance approximately 1,400 ft upstream of the starter dam. In 1997, the dam was raised by placing plant aggregate over the plant aggregate and filters placed per the Closure Consensus Plan. As part of the construction of this raise, the centerline was modified with a one-time offset in the upstream direction approximately 800 ft with fine tailings discharged upstream, creating a beach. In about 2003, dam construction continued following an upstream centerline method, including a filter berm with plant aggregate backing material to create the dam body and fine tailings are discharged upstream from the shoulder, creating a beach. The area downstream of the filter berm is constructed with plant aggregate and filter tailings overlying fine-fraction tailings. Fine-fraction tailings previously deposited by pipeline from near the original starter dam occur from near the old dam crest and extend into the basin. The plant aggregate zones are generally approximately 50 ft to 60 ft thick, and the fine-fraction tailings are generally approximately 40 ft to 55 ft thick. Future raises are also presently planned to continue to use an upstream centerline method, and the downstream slope for Dam 1 (above an approximate elevation of 1,200 ft) will continue to be 6H:1V. The ultimate height of the dam will be approximately 180 ft based on an ultimate crest elevation of 1,315 ft.
Seepage collection ditches are present to control seepage for Dam 1. The seepage is routed to the ends of the dam, where it flows over weirs into ditches leading into one of the two seepage collection ponds downstream of the dam.
15.4.1.2Dam 2
Dam 2 is located on the northern end of the Milepost 7 Tailing Basin. The dam is currently approximately 5,700 ft long and 85 ft high.
At Dam 2, the glacial till cut-off was constructed as a central core in the starter dam. The fill material placed on natural ground to the existing dam elevation consists of plant aggregate, which extends upstream of the starter dam for approximately 500 ft to 600 ft. After completion of the plant aggregate placement, fine-fraction tailings were discharged into the basin creating beaches. Similar to Dam 1, Dam 2 was originally planned to be raised using downstream construction methods, but following Plant restart until about 1996, plant aggregate and filters were placed over the beach for a distance of approximately 1,400 ft upstream of the Dam 2 starter dam per the Consensus Closure Plan. An upstream centerline method used for Dam 1 was also used for Dam 2 beginning in about 1997 and continuing in 2003, with a filter berm constructed approximately 800 ft upstream of the starter dam. The area downstream of the filter berm is raised using only plant aggregate. Future raises are also
Cleveland-Cliffs Inc. | Northshore Property, SLR Project No: 138.02467.00001
Technical Report Summary - February 7, 2022 132
presently planned to continue to use an upstream centerline method, and the downstream dam slope for Dam 2 (above an approximate elevation of 1,200 ft) will continue to be 6H:1V. The ultimate height of the dam will be approximately 155 ft based on an ultimate crest elevation 1,315 ft.
A peat deposit overlying the lacustrine clay and glacial till exists in the approximate middle portion of the dam cross section. The peat has been compressed from its original 10 ft thickness to a thickness of approximately three to five feet. Previous investigations identify an alluvial channel cut into the glacial till in the center of the dam site near the middle of the dam cross section. A toe berm consisting of plant aggregate was constructed in 1997 along the downstream toe of Dam 2 in the area of the lowest natural ground and where the dam section will be highest. The toe berm increased the dam’s stability by providing a means for drainage of seepage and additional weight along the toe of the dam.
A seepage cut-off was constructed in the northeastern corner of Dam 2 in May 2012. The seepage cut-off was constructed beyond the eastern extent of the clay core to significantly reduce the amount of seepage flowing along the hillside, through more permeable plant aggregate zones located in this area of the dam. The first stage consisted of a soil-cement-bentonite cut-off to an elevation 1,216 ft, with the second stage consisting of compacted clay till to a present surface elevation of 1,240 ft. The cut-off will be extended vertically with glacial till as part of subsequent dam raises to the ultimate dam height.
15.4.1.3Dam 5
Dam 5 is located on the east side of the Milepost 7 Tailing Basin and north of the Reclaim Pond. This dam was originally constructed as two dams, Dam 5A and Dam 5B, although the dams were joined as they were raised. The dam is constructed over a layer of clay on the south end, a rock knob in the middle, and a rock foundation on the north end. The northern rock foundation was improved using blanket grouting during initial construction while the middle rock knob was covered by filter tailings as the dams were raised. A central glacial till cut-off was used in the initial design and has continued to be incorporated into recent raises. Dam construction originally employed the downstream method using a downstream sloping glacial till cut-off. Dam 5 construction was changed to the centerline method in 2004, and the cut-off was changed to a wider, vertical glacial till cut-off in 2005. Filter tailings have been placed over the downstream portion of the clay foundation, and a plant aggregate drain has been constructed above the filter tailings along the entire downstream portion of the dam. A buttress was added along the toe of the dam starting in 2013 and is raised and extended with each dam raise.
Future raises are also presently planned to continue to use the centerline method, and the downstream dam slope for Dam 5 will continue to be 6H:1V. The ultimate height of the dam will be approximately 125 ft based on an ultimate crest elevation of 1,315 ft.
15.4.1.4Reclaim Dam
The Reclaim Dam separates the South Pond from the Reclaim Pond. The Reclaim Pond supports two floating pump stations that supply water for Plant operations and to the water treatment plant. The water flows into the Reclaim Pond over a steel decant structure (weir) and into pipes that discharge in the Reclaim Pond. A chemical treatment system is housed within the decant structure that is used to treat the water by adding a flocculant as it enters the pond to reduce the total suspended solids. The Reclaim Dam, reportedly built over a former haul road and splitter dike, is constructed of plant aggregate, and uses the centerline construction method.
Cleveland-Cliffs Inc. | Northshore Property, SLR Project No: 138.02467.00001
Technical Report Summary - February 7, 2022 133
The Reclaim Dam is raised as the water level rises in the basin to maintain freeboard. The dam is at a crest elevation of 1,235 ft with a 4H:1V downstream slope.
15.4.2Design and Construction
SLR understands that NSM has retained Barr Engineering Co. (Barr) as the Engineer of Record (EOR) for the Milepost 7 Tailings Basin. Typical EOR services include the design (i.e., volumetrics, stability analysis, water balances, hydrology, seepage cut-off design, etc.), construction and construction monitoring, inspections (i.e., annual dam safety inspections), and instrumentation monitoring data review (i.e., regularly scheduled instrumentation monitoring and interpretation), to verify that the tailings basins are being constructed and operated by Cliffs as designed and to meet all applicable regulations, guidelines, and standards.
Barr noted the slope stability FoS, and the flood storage requirements, meeting MDNR requirements for the currently designed Dam 1 crest elevation of 1,245 ft (Barr, 2013) and Dam 2 crest elevation of 1,248 ft (Barr, 2016). Barr was able to calculate acceptable slope stability FOS values for Dam 5 at a crest elevation of 1,265 ft (Barr, 2020a) with the construction of a buttress. SLR understands that Barr is developing a design report for Dam 5 to allow for an additional five foot raise, which will result in a crest elevation of 1,270 ft to accommodate additional room required for railroad construction and to account for a favorable construction season. A design report for the Reclaim Dam was not presented; however, SLR understands one is being prepared to summarize the findings.
During the ongoing construction of the tailings dams, field instrumentation (such as piezometers and inclinometers) is monitored bi-annually, and there is a transition in progress to an automated system that records data more frequently, with the data reported to a web-based data visualization and instrumentation monitoring database. Action levels to monitor the performance of the dams are being developed.
15.4.3Audits
Third-party audits have been performed on the TSF by Golder Associates Inc. (Golder) in 2008 (Golder, 2008) and by AECOM in 2012 (AECOM, 2012). SLR understands that Cliffs plans to perform an external audit for the Milepost 7 Tailings Basin in 2022.
15.4.4Inspections
Instruments have been installed within Dams 1, 2, 5, Reclaim Dam, and seepage recovery dams including settlement plates, inclinometers, seepage weirs, piezometers, and a weather station. The monitoring instruments are used to measure the performance of the dams and their foundations as the dams are raised and the elevation of adjacent ponds increases. The most recent annual dam inspection performed by Barr (Barr, 2020b) did not identify any conditions immediately affecting the integrity of the basin, and Barr noted that each of the dams appeared to be in acceptable condition for continued use.
15.4.5Reliance on Data
SLR relies on the statements and conclusions of Barr and Cliffs and provides no conclusions or opinions regarding the stability or performance of the listed dams and impoundments.
Cleveland-Cliffs Inc. | Northshore Property, SLR Project No: 138.02467.00001
Technical Report Summary - February 7, 2022 134
15.4.6Recommendations
Cliffs has been operating the Northshore Tailings Basin since 1980, which is currently operating under the permit requirements of the Minnesota Department of Natural Resources. Dam raises following similar methods to those being carried out by Cliffs at Northshore are typically done in low seismic zones and can be constructed using the coarse-fraction tailings (plant aggregate) material. This type of construction approach, however, requires comprehensive communication and documentation system, careful water management, monitoring of the dam and foundation performance, and the placement of tailings material to ensure that it meets the design requirements. To address these issues, Cliffs has retained Barr as the EOR, with the EOR designation being an industry standard for tailings management, as the EOR typically verifies that the Tailings Storage Basin Cells are being constructed and operated by Cliffs as designed and to meet all applicable regulations, guidelines, and standards.
Based on a review of the documentation provided, SLR has the following recommendations:
1.Prioritize the completion of an Operations, Maintenance and Surveillance (OMS) Manual for the TSF with the EOR in accordance with Mining Association of Canada (MAC) guidelines and other industry recognized standard guidance for tailings facilities.
2.Document, prioritize, track, and close out in a timely manner the remediation, or resolution, of items of concern noted in TSF audits or inspection reports.
3.Establish an External Peer Review Team (EPRT) with experience in tailings management facilities similar to other Cliffs properties .
15.5Power
Minnesota Power, a division of ALLETE, Inc., supplies electric power to both the Mine and Plant locations. In 2016, a new 10-year agreement with Minnesota Power was executed that included the Mine in Babbitt. This agreement was finalized in May 2016 and was approved by Minnesota Public Utilities Commission (MPUC) in November 2016. Silver Bay Power, Cliffs’ wholly owned subsidiary with a 115 MW power plant, previously provided power to the Plant in Silver Bay. As of September 2019, Silver Bay Power began purchasing 100% of the electricity requirements for the Plant from Minnesota Power and will continue to do so through 2031. Silver Bay Power Company idled both generating units and is maintaining the units and permits to allow start-up if needed. This could include extenuating circumstances on the regional electrical grid or at the end of 2031 when the power purchase agreement ends. Minnesota Power will supply the power to the Plant and the Mine through its existing electricity grid, which is interconnected to the grids of neighboring states (Figure 15-5). A maintenance program is in place to clean, inspect, and repair the power distribution system on a regular basis. All areas are serviced on a three-year rotating schedule.
Heating steam previously supplied by Silver Bay Power is now produced by a new boiler house constructed and commissioned in 2018. The new facility, constructed adjacent to the powerhouse, is comprised of three natural gas-fired steam boilers, each rated at 69,000 lb/h. Typical plant steam load is 100,000 lb/h during the winter.
Cleveland-Cliffs Inc. | Northshore Property, SLR Project No: 138.02467.00001
Technical Report Summary - February 7, 2022 135
Source: Minnesota Power Company
Figure 15-5: Regional Electrical Power Distribution
15.6Natural Gas
Natural gas is provided by Northern Natural Gas (NNG) and scheduled by Constellation Energy. Gas is delivered to the Plant using a high-pressure pipeline that connects into the North American network. Cliffs has a long-term contract providing for the transport of natural gas on the NNG pipeline for its mining and pelletizing operations. NNG has an extensive interstate pipeline system that travels through the Midwest and is interconnected to other major interstate pipelines (Figure 15-6). Northshore has the capability to burn both natural gas and oil.
NNG supplies the Plant via a 20 in. pipeline. The pipeline was designed and constructed for a flow capacity of 3,215 MCF/h to supply the processing facility and powerhouse.
Cleveland-Cliffs Inc. | Northshore Property, SLR Project No: 138.02467.00001
Technical Report Summary - February 7, 2022 136
Source: Northern Natural Gas Company
Figure 15-6: Regional Natural Gas Supply
15.7Diesel, Gasoline, and Propane
Large diesel equipment is fueled in the field by a contractor. Small diesel and gasoline fueling stations are used for small maintenance equipment and fleet vehicles. Best Oil supplies diesel fuel to all of Cliffs’ Minnesota operations, while Thompson Gas supplies propane. There is sufficient fuel supply in the region to meet the requirements of the operation.
15.8Communications
Each site has fiber-optic connections into the Century Link public phone system. Radios are used at both the Mine and Plant for communications between equipment dispatchers and foremen to direct activities and help maintain a safe working environment.
The Plant process is controlled and monitored with an up-to-date Honeywell Experion interface and Honeywell C300 and UOC controllers. Allen Bradley Controllogix PLCs are used in field locations.
Cleveland-Cliffs Inc. | Northshore Property, SLR Project No: 138.02467.00001
Technical Report Summary - February 7, 2022 137
Data backup is performed daily with copies of files created in separate locations. The Mine site and the Plant site are connected via fiber-optic cable owned by NSM to allow continuous communications. The overhead lines run parallel to the railroad corridor connecting Silver Bay and Babbitt locations.
15.9Water Supply
Water for the Mine comes from groundwater wells for a potable water source and fire protection of the facilities. Water used for dust control on roads comes from pit sumps.
The process water for the Plant is returned from the Milepost 7 Tailings Basin, with makeup water coming from Lake Superior. Permits allow Northshore to withdraw a total of 50 billion gal/y from Lake Superior for combined use; this limit has not been reached. Potable water is supplied by the city of Silver Bay.
The operation is in a net-positive water environment, and there is ample water available to meet the operations demand.
The tailings basin treats and releases water through a multi-media, filter water treatment plant that has a maximum design discharge rate of 7.5 million gal/d and an average design discharge rate of 6.0 million gal/d. Permits allow Northshore to discharge 8.7 million gal/d.
15.10Peter Mitchell Mine Support Facilities
The mine support facilities (Figure 15-7) located at the Mine include an office building for mine management staff, production engineers, environmental personnel, safety personnel, and other support staff.
Truck shops, truck wash, railroad shop, and warehouse buildings are located on the site. There are four bays used for the maintenance of large production equipment including trucks.
Explosive delivery and handling is performed by contractors. There is no storage of explosives at the site.
Security is provided by General Security Services Corporation (GSSC) and is managed by the Northshore Safety department. Hazardous waste disposal is contracted to OSI Environmental, Inc. and is managed by the Northshore Environmental department.
Cleveland-Cliffs Inc. | Northshore Property, SLR Project No: 138.02467.00001
Technical Report Summary - February 7, 2022 138
Figure 15-7: Peter Mitchell Mine Facilities
15.11Silver Bay Plant Facilities
Figure 15-8 shows a general layout of the Plant facilities.
The General Office Building and the Department Maintenance Office (DMO) building house administration, management, engineering, and other support staff. Additional salaried staff offices, locker rooms, and employee parking lots are located at the fine crusher, concentrator, truck shop, warehouse, pellet plant, and powerhouse. Several service buildings are located in Silver Bay: Hazardous Waste building, Truck Shop, Belt Shop, Stores/Repair Building, and additional auxiliary sheds and storage buildings. A laboratory is located inside the concentrator building. Samples from the Mine and Plant are analyzed here. The laboratory is ISO-certified to iron industry standard procedures. Several support facilities are distributed throughout the Plant site in Silver Bay.
The plant utility systems (water, sewer, gas, compressed air, heating steam, etc.) interconnect all areas and departments. All systems on the Plant property are owned and operated by NSM. The potable water and sanitary sewer are connected to the public systems, owned and operated by the city of Silver Bay.
Security is provided by GSSC and is managed by the Northshore Safety department. Hazardous waste disposal is contracted to OSI Environmental, Inc. and is managed by the Northshore Environmental department.
Cleveland-Cliffs Inc. | Northshore Property, SLR Project No: 138.02467.00001
Technical Report Summary - February 7, 2022 139
Figure 15-8: Silver Bay Plant Facilities
Cleveland-Cliffs Inc. | Northshore Property, SLR Project No: 138.02467.00001
Technical Report Summary - February 7, 2022 140
16.0MARKET STUDIES
16.1Markets
Note that while iron ore production is listed in long or gross tons (2,240 lb), steel production is normally listed in short tons (2,000 lb) or otherwise noted.
Cliffs is the largest producer of iron ore pellets in North America. It is also the largest flat-rolled steel producer in North America. In 2020, Cliffs acquired two major steelmakers, ArcelorMittal USA (AMUSA), and AK Steel (AK), vertically integrating its legacy iron ore business with steel production and emphasis on the automotive end market.
Cliffs owns or co-owns five active iron ore mines in Minnesota and Michigan. Through the two acquisitions and transformation into a vertically integrated business, the iron ore mines are primarily now a critical source of feedstock for Cliffs’ downstream, primary steelmaking operations. Based on its ownership in these mines, Cliffs’ share of annual rated iron ore production capacity is approximately 28.0 million tons, enough to supply its steelmaking operations and not have to rely on outside supply.
In 2021, with underlying strength in demand for steel, the price reached an all time high. It is expected to remain at historically strong levels going forward for the foreseeable future. In 2020, North America consumed 124 million tons of steel while producing only 101 million tons, which is consistent with the historical trend of North America being a net importer of steel. That trend is expected to continue going forward, as demand is expected to outpace supply in North America. Given the demand, it will likely be necessary for most available steelmaking capacity to be utilized.
On a pro forma basis, in 2019 Cliffs shipped 16.5 million tons of finished flat-rolled steel. The next three largest producers were Nucor with 12.7 million tons, U.S. Steel with 10.7 million tons, and Steel Dynamics with 7.7 million tons. In 2019, total US flat-rolled shipments in the United States were approximately 60 million short tons, so these four companies make up approximately 80% of shipments.
With respect to its blast furnace (BF) capacity, Cliffs’ ownership and operation of its iron ore mines is a primary competitive advantage against electric arc furnace (EAF) competitors. With its vertically integrated operating model, Cliffs is able to mine its own iron ore at a relatively stable cost and supply its BF and DRI facilities with pellets in order to produce an end steel or HBI product, respectively. Flat-rolled EAFs rely heavily on bushelling scrap (offcuts from domestic manufacturing operations and excludes scrap from obsolete used items), which is a variable cost. The supply of prime scrap is inelastic, which has caused the price to rise with the increased demand. S&P Global Platts has stated the open-market demand for scrap could grow by nearly 9 million tons through 2023 as additional EAF capacity comes online, with the impact of the scrap market to continue to tighten as all new steel capacity slated to come online is from EAFs (S&P Global Platts, news release, March 18, 2021).
In addition to its traditional steel product lines, Cliffs-produced steel is found in products that are helping in the reduction of the global emissions and modernization of the national infrastructure. For example, Cliffs’ research and development center has been working with automotive manufacturer customers to meet their needs for electric vehicles. Cliffs also offers a variety of carbon and plate products that can be used in windmills, while it is also the sole producer of electrical steel in the United States. Additionally, in Cliffs’ opinion, future demand for steel given its low CO2 emissions positioning will increase relative to other materials such as aluminum or carbon fiber.
Cleveland-Cliffs Inc. | Northshore Property, SLR Project No: 138.02467.00001
Technical Report Summary - February 7, 2022 141
Cliffs is uniquely positioned for the present and future due to a diverse portfolio of iron ore, HBI, BFs, and EAFs generating a wide variety of possible strategic options moving forward, especially with iron ore. For instance, Cliffs has the optionality to continue to provide iron ore to its BFs, create more DRI internally, or sell iron ore externally to another BF or DRI facility.
The necessity for virgin iron materials like iron ore in the industry is apparent, as EAFs rely on bushelling scrap or metallics. As of 2020, EAFs accounted for 71% of the market share, a remarkably high percentage among major steelmaking nations. Because scrap cannot be consistently relied upon as feedstock for high-quality steel applications, the industry needs iron ore-based materials like those provided by Cliffs to continue to make quality steel products.
The US automotive business consumes approximately 17 million tons of steel per year and is expected to consume around or at this level for the foreseeable future. Cliffs’ iron ore reserves provide a competitive advantage in this industry as well, due to high quality demands that are more difficult to meet for scrap-based steelmakers. As a result, Cliffs is the largest supplier of steel to the automotive industry in the United States by a large margin.
Table 16-1 shows the historical pricing for hot rolled coil (HRC) product, Bushelling Scrap feedstock, and IODEX iron ore indexes for the last five years. The table includes the 2021 pricing for each index, which shows a significant increase that is primarily driven by demand.
Table 16-1: Five Year Historical Average Pricing
Cleveland-Cliffs Inc. – Northshore Property
| | | | | | | | | | | | | | | | | | | | |
| Indices | 2017 | 2018 | 2019 | 2020 | 2021 | 5 Yr. Avg. |
| U.S. HRC ($/short ton) | 620 | 830 | 603 | 588 | 1611 | 850 |
| Busheling ($/gross ton) | 345 | 390 | 301 | 306 | 562 | 381 |
| IODEX ($/dry metric ton) | 71 | 69 | 93 | 109 | 160 | 100 |
The economic viability of Cliffs’ iron ore reserves will in many cases be dictated by the pricing fundamentals for steel, as well as scrap and seaborne iron ore itself.
The importance of the steel industry in North America, and specifically the USA, is apparent by the actions of the US federal government by implementing and keeping import restrictions in place. Steel is a product that is a necessity to North America. It is a product that people use every day, often without even knowing. It is important for middle-class job generation and the efficiency of the national supply chain. It is also an industry that supports the country’s national security by providing products used for US military forces and national infrastructure. Cliffs expects the US government to continue recognizing the importance of this industry and does not see major declines in the production of steel in North America.
For the foreseeable future, Cliffs expects the prices of all three indexes to remain well above their historical averages, given the increasing scarcity of prime scrap as well as the shift in industry fundamentals both in the US and abroad.
Cleveland-Cliffs Inc. | Northshore Property, SLR Project No: 138.02467.00001
Technical Report Summary - February 7, 2022 142
16.2Contracts
16.2.1Pellet Sales
Since Cliffs’ 2020 acquisition of AK and AMUSA’s BF steel making facilities, Northshore pellets are shipped predominantly to Cliffs’ steelmaking facilities in the Midwestern USA.
For cash flow projections, Cliffs uses a blended three-year trailing average revenue rate based on the dry standard pellet from all Cliffs mines, calculated from the blended wet pellet revenue average of $98/WLT Free on Board (FOB) Mine as shown in Table 16-2. Pellet prices are negotiated with each customer on long-term contracts based on annual changes in benchmark indexes such as those shown in Table 16-1 and other adjustments for grade and shipping distances.
Table 16-2: Cliffs Consolidated Three-Year Trailing Average Wet Pellet Revenue
Cleveland-Cliffs Inc. – Northshore Property
| | | | | | | | | | | | | | |
| Description | 2017 | 2018 | 2019 | 3YTA |
| Revenue Rate ($/WLT) | 88.02 | 105.64 | 99.50 | 98.00 |
| Total Pellet Sales (MWLT) | 18.7 | 20.6 | 19.4 | 19.5 |
SLR examined annual pricing calculations provided by Cliffs for the period from 2017 to 2019 for external customers, namely AK. The terms appear reasonable. It should be noted that Cliffs has subsequently acquired AK and AMUSA steelmaking facilities in 2020, making the company a vertically integrated, high-value steel enterprise, beginning with the extraction of raw materials through the manufacturing of steel products, including prime scrap, stamping, tooling and tubing.
For the purposes of this TRS, it is assumed that the internal transfer pellet price for Cliffs’ steel mills going forward is the same as the $98/WLT pellet price when these facilities were owned by AK and AMUSA. Based on macroeconomic trends, SLR is of the opinion that Cliffs pellet prices will remain at least at the current three-year trailing average of $98/WLT or above for the next five years.
16.2.2Operations
Major current suppliers for the Northshore operation include, but are not limited to, the following:
•Electrical Grid Power: Minnesota Power
•Natural Gas: NNG with scheduling by Constellation Energy
•Diesel Fuel: Best Oil
•Propane: Thompson Gas
•Pellet Rail Transport to Silver Bay: Northshore Mining Railroad, Cliffs’ wholly owned subsidiary
Cleveland-Cliffs Inc. | Northshore Property, SLR Project No: 138.02467.00001
Technical Report Summary - February 7, 2022 143
17.0ENVIRONMENTAL STUDIES, PERMITTING, AND PLANS, NEGOTIATIONS, OR AGREEMENTS WITH LOCAL INDIVIDUALS OR GROUPS
The SLR review process for Northshore included updating information that Cliffs had developed as part of its draft 2019 SK-1300 report. SLR also conducted a site visit at Northshore in 2019. SLR has not seen nor reviewed environmental studies, management plans, permits, or monitoring reports. The original and updated information included in this section is based on the information provided by the Cliffs project team.
17.1Environmental Studies
Northshore has conducted several environmental impact assessments for specific projects over time that have supported different aspects of its current operation. Each of those studies culminated in a determination by the relevant state and/or federal authorities to grant permits to construct and operate NSM’s facilities. The relevant historical studies are listed below. There are no environmental impact studies in process at this time.
•1976 Environmental Impact Statement (State) for an on-land tailings disposal plan
•1977 Environmental Impact Statement (Federal) for an on-land tailings disposal plan
•1976 Environmental Impact Statement (State) for an on-land tailings disposal plan
•2005 Environmental Assessment Worksheet (State) for reactivation of pelletizing Furnace #5
•2013 Environmental Assessment Worksheet (State) for development of the Gilmore Creek stream mitigation site
•2014 Environmental Assessment Worksheet (State) for mining and storage of Virginia Formation overburden rock
•2017 Environmental Review Needs Determination (State) for an on-land tailings disposal plan.
•2021 Environmental Review Needs Determination (State) for an on-land tailings disposal plan
Northshore has been operating for over 65 years, and baseline and other environmental studies have been undertaken as needed to support various approvals over the site’s operating history. Currently, additional environmental studies, including collecting new or updated baseline information, are undertaken on an as-required basis to support new permit applications or to comply with specific permit conditions.
Northshore operates and reports on two “test plots” being used as a control for an engineered stockpile cover in Babbitt, for material referred to as “Type II Virginia Formation”. It is a requirement under the State Permit to Mine.
17.2Environmental Requirements
NSM maintains an environmental management system (EMS) that is registered to the international ISO 14001:2015 standard. The ISO standard requires components of leadership commitment, planning, internal and external communication, operations, performance evaluation, and management review. NSM’s continued registration to the ISO standard is evaluated every two years through external auditors.
Cleveland-Cliffs Inc. | Northshore Property, SLR Project No: 138.02467.00001
Technical Report Summary - February 7, 2022 144
Nearly all NSM’s permits require self-reporting at a regular interval (i.e., water compliance is monthly, solid waste is annually, air either quarterly, semi-annually or annually, depending on the permit requirements). Cliffs also reports internal corporate metrics that are tallied monthly. Compliance audits are conducted through a third-party consultant every three years.
Cliffs tracks and records external complaints/compliments in an internal log that is audited during the ISO 14001 audits.
17.2.1Site Monitoring
Northshore operates through permission granted by multiple permits, which are summarized in Table 17-1. The permits contain requirements for site monitoring including air, water, waste, and land aspects of the Property. The permit-required data are maintained by the facility, and exceptions to the monitoring obligations are reportable to the permitting authority. Monitoring is conducted in compliance with permit requirements, and management plans are developed as needed to outline protocols and mitigation strategies for specific components or activities. Monitoring and management programs currently undertaken in compliance with NSM’s existing permits include:
•Air Quality: Management plans including fugitive dust control plans, operation and maintenance plans, and malfunction plans; monitoring of fugitive sources and stacks, visible dust emission monitoring at the TSF; and greenhouse gas (GHG) emissions monitoring and reporting.
•Noise and Vibration: Blast management plans including vibration monitoring.
•Surface Water: Routine water quality sampling in receiving waters; quantity of water takings and discharges.
•Groundwater: Routine water quality sampling at mine and plant monitoring wells; quantity of water takings; monitoring discharge seepage around the tailings basin.
•Wetlands: monitoring of nearby wetlands where a potential impact has been identified, including related to drawdown and/or discharge activities.
•Wildlife: monitoring of endangered species in accordance with specific permit conditions.
•Solid Waste: Industrial Solid Waste Management Plan, Closure and Post-closure Care Plan, Operations and Maintenance Plan, and Sampling and Analysis Plan for the ash landfill near the Milepost 7 Tailings Basin.
•Mineland Reclamation: Type II Virginia Formation Stockpile Plan for the management of higher sulfur-containing material.
There are no specific management plans related to social aspects in place.
There have been a series of engineering stack tests over the past three years that have resulted in emissions above the permitted limits. All exceedances are reported as required to the MPCA in the semi-annual deviations reports. SLR understands that all exceedances undergo a thorough root cause analysis to identify corrective actions that are then implemented. These events are also reported in the internal corporate environmental metrics and are reported up through the senior management within Cliffs.
The State and Federal government conduct regional ecologic monitoring in the vicinity of the Northshore operations. Two recent examples of such monitoring include:
Cleveland-Cliffs Inc. | Northshore Property, SLR Project No: 138.02467.00001
Technical Report Summary - February 7, 2022 145
•U.S. Environmental Protection Agency (EPA) conducted its residual risk and technology review (RTR) of the Taconite NESHAP (40 CFR 63). EPA’s final rule (July 28, 2020) documents that risks from the Taconite Iron Ore Processing source category are acceptable, and the current standards provide a margin of safety to protect public health and prevent an adverse environmental effect.
•The State of Minnesota conducts regional watershed monitoring to assess the overall health of waterbodies throughout the state including water quality and macroinvertebrate and fish population diversity and health. The State may develop watershed management tools for waterbodies of concern such as Total Maximum Daily Load (TMDL) plans. Northshore is not currently subject to any TMDL-based load restrictions.
17.2.2Water
Northshore presently maintains NPDES/State Disposal System (SDS) permits for both the Mine in Babbitt, Minnesota and the Plant in Silver Bay, Minnesota. The following are permitted under NPDES Permit MN0046981 in Babbitt: twelve mine pit dewatering outfalls, four sanitary outfalls, and four outfalls from the crushers and associated shops. The Milepost 7 water treatment plant (WTP) and Silver Bay Power’s non-contact cooling water are regulated under NPDES Permit MN0055301 and discharge to the Beaver River and Lake Superior, respectively. The following are permitted under NPDES Permit MN0055301 in Silver Bay: twelve groundwater wells, ten surface water discharge stations, seven surface water stations, and twelve waste stream stations. These discharge outfalls have provided adequate permitted capacity to move water as necessary to support the mining process.
NSM submits Discharge Monitoring Reports for several parameters (separate for each parameter) for both the Mine and Plant on a monthly basis as per the NPDES permits. It also conducts additional monitoring in Babbitt while it manages Type II Virginia Formation material.
Northshore maintains five water appropriations permits for both surface and groundwater with excess capacity for the Mine and Plant sites.
Northshore’s current LOM is projected at 48 years as referenced in section 13.4 of this TRS. This long life makes preparation of a detailed closure plan difficult to undertake, as the final configuration of the Mine and Plant facilities are not established. Minnesota Rule 6130.4600 does not require a plan for deactivation of the mine until at least two years in advance of deactivation of a mining area. No plan has yet been required or requested by the State agency with the exception of a Closure Plan for the Milepost 7 Tailings Basin, which is incorporated into the Five-Year Operations Plan for the basin. That plan requires operation of the existing water treatment facility to reduce the basin pond levels and operate until such time that direct release of water can occur as necessary. Cliffs currently has a post-closure care plan for the ash landfill near the Milepost 7 Tailings Basin, but the landfill is still active.
17.2.3Hazardous Materials, Hazardous Waste, and Solids Waste Management
The Mine qualifies as a Small Quantity Generator status according to the federal Resource Conservation and Recovery Act (RCRA). At the E.W. Davis Works, waste generation from maintenance projects dictates the generator status. Because generator status is determined month-by-month, the facility fluctuates between a Large Quantity Generator and a Small Quantity Generator status. Hazardous waste management is authorized by permits from the applicable regulatory authorities (see Table 17-1 for a full list of permits). NSM manages coal ash from the onsite power plant at its industrial landfill
Cleveland-Cliffs Inc. | Northshore Property, SLR Project No: 138.02467.00001
Technical Report Summary - February 7, 2022 146
permitted through the State of Minnesota. Northshore generates other waste materials typical of any large industrial site and manages those wastes offsite through approved vendors.
17.2.4Tailings Disposal
Requirements for tailings disposal are discussed in section 15.4 of this TRS. Tailings disposal is authorized by permits from the applicable regulatory authorities (see Table 17-1 for a full list of permits).
Because iron ore geology is different from some other mineral deposits, acid rock drainage (ARD) is not a concern with the iron ore mines and associated tailings in Minnesota. Moreover, EPA itself describes the iron ore mining and beneficiation process as generating wastes that are “earthen in character.” Chemical constituents from iron ore mining include iron oxide, silica, crystalline silica, calcium oxide, and magnesium oxide — none of which are Comprehensive Environmental Response, Compensation, and Liability Act (CERCLA) hazardous substances. The acid-neutralizing potential of carbonates in iron ore offsets any residual ARD risks, leading to pit water that naturally stabilizes at a pH of 7.5 to 8.5.
Over 20 years of monitoring of the effluent from the tailings basin has not indicated any cause for concern of ARD or metals leaching. NSM continues to monitor its effluent from the basin going forward as prescribed under its applicable permits.
17.2.5Mine Overburden and Waste Rock Materials
Requirements for the disposal of mine overburden and non-mineralized or lean rock are discussed in section 13.5 of this report. Stockpiling of these materials is authorized by permits from the applicable regulatory authorities (see Table 17-1 for a full list of permits).
Northshore's pit has localized regions of Virginia Formation that overlie the iron formation. Virginia Formation can have elevated levels of sulfur, giving rise for the potential for ARD as this layer is stripped. A plan for identification, extraction, material management, and monitoring has been approved by the Minnesota DNR and provides reasonable safeguards to continue to remove the Virginia Formation material without undue risk of ARD. This plan is required by and covered under the Permit to Mine through the MDNR and the NPDES Permit for Babbitt through the MPCA.
The MDNR conducts annual reclamation inspections at Babbitt and Silver Bay. For the Type II Virginia Formation Stockpile, inspections will be carried out in accordance with the Type II Virginia Formation Stockpile Plan.
17.3Operating Permits and Status
NSM operates through permission granted by multiple permits, which are summarized in Table 17-1. Northshore is operating under a Schedule of Compliance issued by the MPCA in 2015 that establishes milestones and obligations relative to fluoride and amphibole mineral particle concentrations in the WTP discharge. There was one amphibole exceedance; however, Cliffs believes that it is due to a laboratory error. Cliffs indicated that Northshore is operating in compliance with the terms of the Schedule of Compliance.
While permitting always involves varying degrees of risk due to external factors, Cliffs has indicated that it has a demonstrated record of obtaining necessary environmental permits without unduly impacting the facility operational plan.
The following permit applications are pending with a permitting authority:
Cleveland-Cliffs Inc. | Northshore Property, SLR Project No: 138.02467.00001
Technical Report Summary - February 7, 2022 147
•MDNR: Wetlands Conservation Act approval to impact wetlands associated with the progression of the mine pit.
•MDNR: Permit to Mine Amendment to update the Milepost 7 Permit to Mine boundary, incorporate clay borrow areas.
It is understood that all required permits are in place.
Table 17-1: List of Major Permits and Licenses
Cleveland-Cliffs Inc. – Northshore Property
| | | | | | | | | | | | | | | | | |
| Permit No | Description | Type | Jurisdiction | Agency | Status |
| SNM-1562 | Radiation Sources | Radiation Sources | Federal | USNRC | Active |
| 22-13759-01 | Radiation Sources | Radiation Sources | Federal | USNRC | Active |
| - | Western Mine Progression | Wetlands | State | MDNR | Active |
| 2005-2628-TWP | Milepost 7 Wetlands Filling Permit | Wetlands | Federal | USACE | Active |
| 2005-01560-TWP | Expansion of Mine Main and East Pits | Wetlands | Federal | USACE | Active |
| 2014-01685-DWW | Southern Pit Progression | Wetlands | Federal | USACE | Active |
| 2007-00841-TWP | Bear Lake Outlet | Wetlands | Federal | USACE | Active |
| 2010-04573-DWW | East End Progression/Gilmore Creek | Wetlands | Federal | USACE | Active |
| 2107-02604-KAL | Babbitt RR Yard | Wetlands | Federal | USACE | Active |
| --- | Expansion of Mine Main and East Pits: WCA Notice of Decision | Wetlands | State | MDNR | Active |
| --- | Southern Pit Progression: WCA Notice of Decision | Wetlands | State | MDNR | Active |
| --- | Bear Lake Outlet: WCA Notice of Decision | Wetlands | State | MDNR | Active |
| --- | East End Progression/Gilmore Creek: WCA Notice of Decision | Wetlands | State | MDNR | Active |
Cleveland-Cliffs Inc. | Northshore Property, SLR Project No: 138.02467.00001
Technical Report Summary - February 7, 2022 148
| | | | | | | | | | | | | | | | | |
| Permit No | Description | Type | Jurisdiction | Agency | Status |
| --- | Babbitt RR Yard: WCA Notice of Decision | Wetlands | State | MDNR | Active |
| --- | West Ridge Railroad Relocation and Tailings Basin Progression: WCA Notice of Decision | Wetlands | State | MDNR | Active |
| PWSID 5690080 | MDH Non-Community Non-Transient Public Water Supply | Potable Water Plant | State | MDH | Active |
| various | Wells | Wells | State | MDH | Active |
| 1979-2120 | Harbor Dredging | Public Waters Work Permit | State | MDNR | Active |
| MP7 Op | Milepost 7 Five-Year Operations Plan | Plan | State | MDNR | Active |
| MP7 Master | Milepost 7 Master Permit | Tailings Basin Master Permit | State | MDNR | Active |
| Mine Permit | Permit to Mine | Mining | State | MDNR | Active |
| 852065 | Water Appropriations - Babbitt Potable Water | Water Appropriation | State | MDNR | Active |
| 822097 | Water Appropriations - Mine Dewatering | Water Appropriation | State | MDNR | Active |
| 762052 | Water Appropriations - Milepost 7 WTP | Water Appropriation | State | MDNR | Active |
| 912189 | Water Appropriations - Pellet Cooling Water | Water Appropriation | State | MDNR | Active |
| 470012 | Water Appropriations - PH Non-Contact Cooling | Water Appropriation | State | MDNR | Active |
| various | Aboveground Storage Tank Permit | Tanks | State | MPCA | Active |
| MNS000102392 | Hazardous Waste Generator - Babbitt | Hazardous Waste | State | MPCA | Active |
Cleveland-Cliffs Inc. | Northshore Property, SLR Project No: 138.02467.00001
Technical Report Summary - February 7, 2022 149
| | | | | | | | | | | | | | | | | |
| Permit No | Description | Type | Jurisdiction | Agency | Status |
| MND006449649 | Hazardous Waste Generator - Silver Bay | Hazardous Waste | State | MPCA | Active |
| SW-409 | Industrial Landfill (IL001) at Milepost 7 | Landfill | State | MPCA | Active |
| MN0055301-2005 | NPDES/SDS E.W. Davis Works, Milepost 7 and Silver Bay Power | NPDES | State | MPCA | Active, Administratively Extended |
| MN0046981 | NPDES/SDS: Peter Mitchell Mine | NPDES | State | MPCA | Active, Administratively Extended |
| 13700032 | Title V Air Permit - Babbitt | Air | State | MPCA | Active, Administratively Extended |
| 7500003 | Title V Air Permit - Silver Bay | Air | State | MPCA | Active, Administratively Extended |
Notes:
MDH: Minnesota Department of Health
MDNR: Minnesota Department of Natural Resources
MPCA: Minnesota Pollution Control Agency
USACE: United States Army Corps of Engineers
USNRC: United States Nuclear Regulatory Commission
WCA: Wetland Conservation Act
Regulatory issues that could have a bearing on NSM’s current plans to address any issues related to environmental compliance and permitting are actively monitored and disclosed in Cliffs’ 10-K. Please refer to Part I – Environment of that document for discussion relevant to:
•Minnesota’s Withdrawal of Proposed Amendments to the Sulfate Wild Rice Water Quality Standard
•Evolving water quality standards for conductivity
•Definition of “Waters of the United States” Under the Clean Water Act
•Mercury TMDL and Minnesota Taconite Mercury Reduction Strategy
•Climate Change and GHG Regulation
•Regional Haze Federal Implementation Plan Rule
•NO2 and SO2 National Ambient Air Quality Standards (NAAQS)
•CERCLA 108(b)
•Regulation of Discharges to Groundwater
17.4Mine Closure Plans and Bonds
Northshore’s current mine life is projected at 48 years as outlined in section 13.4 of this TRS. This long life makes preparation of a detailed closure plan difficult to undertake as the final configurations of the
Cleveland-Cliffs Inc. | Northshore Property, SLR Project No: 138.02467.00001
Technical Report Summary - February 7, 2022 150
Mine and Plant facilities are not established. Minnesota Rule 6130.4600 does not require a plan for deactivation of the mine until at least two years in advance of deactivation of a mining area. No plan has yet been required or requested by the State agency with the exception of a Closure Plan for the Milepost 7 Tailings Basin, which is incorporated into the current Five-Year Operations Plan for the basin. As a matter of good mining practice, NSM seeks to conduct progressive reclamation throughout its mining life to minimize risk and costs at closure. NSM actively reclaims the outer surfaces of the tailings basin dams and develops in-pit stockpiles to reduce new stockpile footprints consistent with the State of Minnesota mining rule requirements.
Cliffs performs an annual review of significant changes to each operation's Asset Retirement Obligation (ARO) cost estimates. Additionally, Cliffs conducts an in-depth review every three years to ensure that the ARO legal liabilities are accurately estimated based on current laws, regulations, facility conditions, and cost to perform services. The cost estimates are conducted in accordance with the Financial Accounting Standards Board (FASB) Accounting Standards Codification (ASC) 410. FASB ARO estimates comply with rules set forth by the United States General Accepted Accounting Principles (US GAAP) and the SEC, and those costs are reported as part of Cliffs’ SEC disclosures. Arcadis calculated the 2020 ARO legal obligation closure and reclamation costs associated with project deactivation to be $113.4 million (Arcadis, 2020). The total ARO liability for Cliffs is $120 million; to calculate the total ARO liability, Cliffs deducts Arcadis’ specified contingency value and adds Cliffs accounting policy contingency at 15% and Cliffs accounting policy market risk at 4%. SLR notes that there are differences between the ARO estimate and the book value calculated by Cliffs due to the long life of the operation.
While a formal, site-wide closure plan has not been established, NSM worked with a third party to develop a site-specific estimate of actual closure and reclamation cost, which considers likely approaches and techniques to close the facility. Cliffs indicated that from a water management perspective, the closure concept includes closure of the tailings basin consistent with Cliffs’ closure forecast described in the Milepost 7 Five-Year Operations Plan, which anticipates a gradual reduction of water levels in the basin coupled with reclamation of the tailings surfaces as they are dewatered. Mine pits will be allowed to naturally refill with groundwater, which will eventually reach an elevation with a natural outfall toward the east and into the Dunka River.
SLR cannot comment on adequacy of the closure costing and the closure plan based on currently available information.
17.4.1Post-Performance or Reclamations Bonds
Current requirements for performance or reclamation bonds are:
•Performance Bond: Assurance of Closure/Post Closure Care for Industrial Solid Waste Landfill, $3,630,143.00
•Performance Bond: Assurance of Performance of Gilmore Creek Stream Mitigation, $200,000.00
•Performance Bond: Assurance of Performance of waste tire management, $30,000.00
•Performance Bond: Assurance of Closure/Post Closure Care for Type II Virginia Formation stockpile rock management, $12,630,264
•Letter of Credit: Assurance of Closure/Post Closure Care for tailings basin, $4,000,000.00
Cleveland-Cliffs Inc. | Northshore Property, SLR Project No: 138.02467.00001
Technical Report Summary - February 7, 2022 151
•Letter of Credit: Assurance of Closure/Post Closure Care for Type II Virginia Formation stockpile rock management, $3,157,565.80
17.5Social and Community
Cliffs has been investing in the region for over a century, including direct employment and contributions to state, local, and taconite taxes. Taconite taxes contribute to an existing government-administered property tax credit program for people living in the Mesabi Iron Range mining region funded through mining production taxes. SLR is not aware of any formal commitments to local procurement and hiring; however, Cliffs has indicated that it has long-standing relationships with local vendors and also purchases through local and regional services and suppliers.
Cliffs employees make contributions to local United Way chapters through donations that are matched with a company contribution. Cliffs employees are also board members and volunteers for the United Way. Another initiative includes agreements with local municipalities or organizations to make Cliffs-owned or leased land that is not utilized for mining available for local community use including trails used for snowmobiling, biking, and ATV use. There is also a lease agreement in place for a local marina with Silver Bay and MDNR for Black Beach, a popular tourist area. Cliffs also leases property to the city of Silver Bay that provides a publicly accessible overlook of the city and taconite plant operation and installed signage with information about Northshore and tourist attractions in the city.
SLR is not able to verify adequacy of management of social issues and what the general issues raised are; however, it understands that Cliffs has a positive relationship with stakeholders and that, in the event of a complaint, Cliffs works directly with affected community members to develop a mutually acceptable resolution of the issue. Public Affairs representatives from Cliffs formally engage with the community on an ongoing basis and serve as the face of the company. They sit on boards of community and business organizations at regional and local levels, participate in discussions with government officials, and act as a point of contact within the community. In doing so, they keep stakeholders apprised of critical issues to the operations, understand important topics in the community, and seek to listen to any questions or concerns. Cliffs indicated that this strategy allows it to maintain an ongoing relationship with stakeholders and collaborate with communities to find solutions should any issues arise. Cliffs’ Public/Government Affairs maintains a list of stakeholders for Cliffs’ iron ore mine operations.
Cleveland-Cliffs Inc. | Northshore Property, SLR Project No: 138.02467.00001
Technical Report Summary - February 7, 2022 152
18.0CAPITAL AND OPERATING COSTS
Cliffs’ forecasted capital and operating costs estimates are derived from annual budgets and historical actuals over the long life of the current operation. According to the American Association of Cost Engineers (AACE) International, these estimates would be classified as Class 1 with an accuracy range of -3% to -10% to +3% to +15%. All unit rates are reported in WLT pellets.
18.1Capital Costs
Capital costs were derived from current levels and work of similar scope based on the Q2 2021 forecast. Table 18-1 shows the sustaining capital cost forecast for the five-year period from 2022 to 2026, which totals $197.6 million, or $6.17/WLT pellet. These costs include but are not limited to:
•Mobile equipment additions and replacements
•Infrastructure and fixed equipment improvements
For the remaining life of the operation starting in 2027, a sustaining capital cost of $4/WLT pellet, or $20.3 million annually, is used in the economic model for an additional $830.8 million for the remaining mine life. A further $25 million in “Other” additional mine fleet purchases (grader, haul trucks, loader, dozer, and drill) are to be added at regular intervals during the remaining mine life.
Table 18-1: LOM Capital Costs
Cleveland-Cliffs Inc. – Northshore Property
| | | | | | | | | | | | | | | | | | | | | | | | | | |
| Type | Values | Total | 2022 | 2023 | 2024 | 2025 | 2026 | 2027-2069 |
| Capital Costs |
| Productive/Other | $ millions | 25.0 | 0 | 0 | 0 | 0 | 0 | 25.0 |
| Sustaining | $ millions | 989 | 43.8 | 40.9 | 35.9 | 20.4 | 16.8 | 830.8 |
| Total | $ millions | 1,014 | 43.8 | 40.9 | 35.9 | 20.4 | 16.8 | 855.8 |
| Pellet Sales |
| Pellet Sales | MWLT | 241.6 | 5.3 | 5.4 | 5.4 | 5.4 | 5.4 | 214.9 |
| Unit Rates |
| Productive/Other | $/WLT | 0.10 | 0 | 0 | 0 | 0 | 0 | 0.12 |
| Sustaining | $/WLT | 4.09 | 8.24 | 7.64 | 6.71 | 3.81 | 3.14 | 3.85 |
| Total | $/WLT | 4.20 | 8.24 | 7.64 | 6.71 | 3.81 | 3.14 | 3.96 |
A final closure reclamation cost of $120 million is estimated, with $40 million spent annually starting in the last year of production in 2069 and the two subsequent years.
18.2Operating Costs
Operating costs for the LOM are based on the 2022 plan. For this period, costs are based on a full run rate with a combination of both standard and low-silica production consistent with what is expected for the LOM. At this point in time there are no items identified that should significantly impact operating costs either positively or negatively for the evaluation period. Minor year-to-year variations should be
Cleveland-Cliffs Inc. | Northshore Property, SLR Project No: 138.02467.00001
Technical Report Summary - February 7, 2022 153
expected based upon maintenance outages and production schedules. Forecasted 2021 and average operating costs over the remaining 48 years of mine life are shown below in Table 18-2.
Table 18-2: LOM Operating Costs
Cleveland-Cliffs Inc. – Northshore Property
| | | | | | | | |
| Parameter | 2022
($/WLT Pellet) | LOM
($/WLT Pellet) |
| Mining | 16.38 | 20.37 |
| Processing | 40.21 | 42.59 |
| Site Administration | 3.51 | 3.80 |
| General/Other Costs | 11.07 | 13.30 |
| Operating Cash Cost ($/WLT Pellet) | 71.17 | 80.06 |
Processing costs consist of railing ore from the Mine to the Plant, as well as typical crushing, grinding, concentrating, pelletizing, and ship loading activities and tailings basin disposal. General/Other costs include production tax and royalty costs, insurance, corporate cost allocations, and other minor costs.
The operation employs a total of 605 salaried and hourly employees per the 2022 budget as of consisting of 152 salaried and 453 hourly employees, which are non-union.
Table 18-3 summarizes the current workforce levels by department for the Property.
Table 18-3: Workforce Summary
Cleveland-Cliffs Inc. - Northshore Property
| | | | | | | | | | | |
| Category | Salary | Hourly | Total |
| Mine | 32 | 152 | 184 |
| Railroad | 12 | 72 | 84 |
| Silver Bay Plant | 40 | 229 | 269 |
| Asset Management | 33 | 0 | 33 |
| General Staff Organization | 35 | 0 | 35 |
| Total | 152 | 453 | 605 |
Cleveland-Cliffs Inc. | Northshore Property, SLR Project No: 138.02467.00001
Technical Report Summary - February 7, 2022 154
19.0ECONOMIC ANALYSIS
19.1Economic Criteria
The economic analysis detailed in this section is based on the current mine plan. The assumptions used in the analysis are current at the time the analysis was completed (Q2 2021), which may be different from the economic assumptions defined in Sections 11.0 and 12.0 when calculating the economic pit. For this period, costs are based on a full run rate with a combination of both standard and low-silica pellet production, consistent with what is expected for the LOM.
An un-escalated technical-economic model was prepared on an after-tax DCF basis, the results of which are presented in this section. Key criteria used in the analysis are discussed in detail throughout this TRS. General assumptions used are summarized in Table 19-1.
Cliffs uses a 10% discount rate for DCF analysis incorporating quarterly cost of capital estimates based on Bloomberg data. SLR is of the opinion that a 10% discount/hurdle rate for after-tax cash flow discounting of large iron ore and/or base metal operations is reasonable and appropriate.
Table 19-1: Technical-Economic Assumptions
Cleveland-Cliffs Inc. – Northshore Property
| | | | | |
| Description | Value |
| Start Date | December 31, 2021 |
| Mine Life | 48 years |
| Three-Year Trailing Average Revenue | $98/WLT Pellet |
| Operating Costs | $80.06/WLT Pellet |
| Sustaining Capital (after six years) | $4/WLT Pellet |
| Discount Rate | 10% |
| Discounting Basis | End of Period |
| Inflation | 0% |
| Federal Income Tax Rate | 20% |
| State Income Tax Rate | None – Sales made out of state |
The operating cost of $80.06/WLT pellet includes royalties and State of Minnesota production taxes.
The production and cost information developed for the Property are detailed in this section. Table 19-2 is a summary of the estimated mine production over the 48-year mine life.
Cleveland-Cliffs Inc. | Northshore Property, SLR Project No: 138.02467.00001
Technical Report Summary - February 7, 2022 155
Table 19-2: LOM Production Summary
Cleveland-Cliffs Inc. – Northshore Property
| | | | | | | | |
| Description | Units | Value |
| ROM Crude Ore | MLT | 822.4 |
| Total Material | MLT | 1,456.2 |
| MagFe Grade | % | 24.6 |
| Annual Mining Rate | MLT/y | 30.0 |
Table 19-3 is a summary of the estimated plant production over the 48-year mine life.
Table 19-3: LOM Plant Production Summary
Cleveland-Cliffs Inc. – Northshore Property
| | | | | | | | |
| Description | Units | Value |
| ROM Material Milled | MLT | 822.4 |
| Annual Processing Rate | MLT/y | 17.0 |
| Process Recovery | % | 29.4 |
| Standard Pellet | MLT | 80.5 |
| DR-Grade Pellet | MLT | 161.1 |
| Total Pellet | MLT | 241.6 |
| Annual Pellet Production | MLT/y | 5.0 |
19.2Cash Flow Analysis
The indicative economic analysis results, presented in Table 19-4, indicate an after-tax NPV, using a 10% discount rate, of $619 million at an average blended wet pellet price of $98/WLT. The after-tax IRR is not applicable since the Plant has been in operation for a number of years. Capital identified in the economics is for sustaining operations and plant rebuilds as necessary.
Project economic results and estimated cash costs are summarized in Table 19-4. Annual estimates of mine production and pellet production with associated cash flows are provided for years 2022 to 2026 and then by ten year groupings through to the end of the mine life.
The economic analysis was performed using the estimates presented in this TRS and confirms that the outcome is a positive cash flow that supports the statement of Mineral Reserves.
Cleveland-Cliffs Inc. | Northshore Property, SLR Project No: 138.02467.00001
Technical Report Summary - February 7, 2022 156
Table 19-4: Life of Mine Indicative Economic Results
Cleveland-Cliffs Inc. – Northshore Property
| | | | | | | | | | | | | | | | | | | | | | | | | | | | | | | | | | | |
| Mine Life | | 1 | 2 | 3 | 4 | 5 | 6-15 | 16-25 | 26-35 | 36-45 | 46-48 |
| Calendar Years | Total | 2022 | 2023 | 2024 | 2025 | 2026 | 2027- 2036 | 2037- 2046 | 2047- 2056 | 2057- 2066 | 2067- 2069 |
| Reserve Base: | | | | | | | | | | | |
| Northshore Ore Pellet Reserve Tons (millions) | 241.6 | 236.3 | 231.0 | 225.6 | 220.3 | 214.9 | 164.0 | 113.0 | 62.4 | 12.2 | (0.0) |
| Tonnage Data: | | | | | | | | | | | |
| Northshore Total Tons Moved (millions) | 1,456.2 | 26.1 | 30.9 | 30.1 | 29.9 | 29.4 | 298.4 | 318.0 | 332.6 | 293.7 | 67.0 |
| Northshore Crude Ore Tons Mined (millions) | 822.4 | 17.0 | 17.3 | 17.9 | 17.7 | 16.4 | 166.3 | 169.4 | 175.7 | 176.0 | 48.7 |
| | | | | | | | | | | | |
| Northshore Pellet Production Tons (millions) | 241.6 | 5.3 | 5.4 | 5.4 | 5.4 | 5.4 | 51.0 | 50.9 | 50.6 | 50.2 | 12.2 |
| | | | | | | | | | | | |
| Inputs: | | | | | | | | | | | |
| Northshore Pellet Revenue Rate ($/ton) | 98 | 98 | 98 | 98 | 98 | 98 | 98 | 98 | 98 | 98 | 98 |
| | | | | | | | | | | | |
| Income Statement: | | | | | | | | | | | |
| Northshore Gross Revenue ($ in millions) | 23,681 | 521 | 524 | 524 | 524 | 524 | 4,996 | 4,989 | 4,960 | 4,924 | 1,195 |
| | | | | | | | | | | | |
| Mining | 4,922 | 93 | 97 | 98 | 99 | 100 | 1,012 | 1,078 | 1,128 | 996 | 223 |
| Processing | 10,288 | 219 | 218 | 220 | 222 | 224 | 2,156 | 2,163 | 2,170 | 2,158 | 539 |
| Site Administration | 919 | 19 | 18 | 19 | 19 | 19 | 192 | 192 | 192 | 192 | 58 |
| General/Other Costs | 3,218 | 65 | 67 | 67 | 67 | 67 | 671 | 671 | 671 | 671 | 201 |
| Northshore Operating Cash Cost ($ in millions) | 19,347 | 395 | 400 | 403 | 407 | 409 | 4,031 | 4,103 | 4,160 | 4,017 | 1,020 |
| Operating Cash Costs ($/LT Pellet) | 80.06 | 74.39 | 74.77 | 75.41 | 76.13 | 76.50 | 79.07 | 80.60 | 82.20 | 79.95 | 83.71 |
| | | | | | | | | | | | |
| Northshore Operating Income (excl. D&A) | 4,335 | 125 | 124 | 121 | 117 | 115 | 965 | 886 | 800 | 907 | 174 |
| | | | | | | | | | | | |
| Federal Income Taxes ($ in millions) | (867) | (25) | (25) | (24) | (23) | (23) | (193) | (177) | (160) | (181) | (35) |
| Depreciation Tax Savings ($ in millions) | 252 | 4 | 5 | 5 | 5 | 6 | 54 | 54 | 53 | 53 | 13 |
| Accretion Tax Savings ($ in millions) | 5 | 0 | 0 | 0 | 0 | 0 | 0 | 0 | 1 | 3 | 0 |
| | | | | | | | | | | |
| Northshore Income after Taxes ($ in millions) | 3,725 | 105 | 104 | 102 | 99 | 98 | 826 | 763 | 694 | 781 | 153 |
Cleveland-Cliffs Inc. | Northshore Property, SLR Project No: 138.02467.00001
Technical Report Summary - February 7, 2022 157
| | | | | | | | | | | | | | | | | | | | | | | | | | | | | | | | | | | |
| Mine Life | | 1 | 2 | 3 | 4 | 5 | 6-15 | 16-25 | 26-35 | 36-45 | 46-48 |
| Calendar Years | Total | 2022 | 2023 | 2024 | 2025 | 2026 | 2027- 2036 | 2037- 2046 | 2047- 2056 | 2057- 2066 | 2067- 2069 |
| | | | | | | | | | | | |
| Other Cash Inflows & Outflows ($ in millions): | | | | | | | | | | | |
| Sustaining Capital Investments | (989) | (44) | (41) | (36) | (20) | (17) | (204) | (204) | (202) | (201) | (20) |
| Significant All Material Change Capital Additions | (25) | - | - | - | - | - | (1) | (24) | - | - | - |
| Mine Closure Costs (Incl. Post Closure) | (120) | - | - | - | - | - | - | - | - | - | (120) |
| | | | | | | | | | | |
| Northshore Cash Flow ($ in millions) | 2,592 | 61 | 63 | 66 | 79 | 81 | 621 | 536 | 492 | 580 | 13 |
| | | | | | | | | | | |
| Northshore Discounted Cash Flow ($ in millions) | 619 | 55 | 52 | 50 | 54 | 50 | 237 | 80 | 28 | 12 | 0 |
19.3Sensitivity Analysis
Project risks can be identified in both economic and non-economic terms. Key economic risks were examined by running cash flow sensitivities. The operation is nominally most sensitive to market prices (revenues) followed by operating cost as shown in Table 19-5. For each dollar movement in sales price and operating cost, respectively, the after tax NPV changes by approximately $38 million.
It is noted that recovery and head grade sensitivity do not vary much in iron ore deposits compared to metal price sensitivity. In addition, sustaining capital expenditures amount to 5% of LOM operating costs and, therefore, do not have much impact on the viability of operating mines.
Cleveland-Cliffs Inc. | Northshore Property, SLR Project No: 138.02467.00001
Technical Report Summary - February 7, 2022 158
Table 19-5: After-tax NPV at 10% Sensitivity Analysis
Cleveland-Cliffs Inc. – Northshore Property
| | | | | | | | | | | | | | | | | | | | | | | |
Operating Costs
($/WLT Pellet) |
| Sales Price ($/WLT Pellet) | | $95 | $90 | $85 | $80 | $75 | $70 |
| $83 | ($517) | ($328) | ($138) | $51 | $241 | $430 |
| $88 | ($328) | ($138) | $51 | $241 | $430 | $619 |
| $93 | ($138) | $51 | $241 | $430 | $619 | $809 |
| $98 | $51 | $241 | $430 | $619 | $809 | $998 |
| $103 | $241 | $430 | $619 | $809 | $998 | $1,188 |
| $108 | $430 | $619 | $809 | $998 | $1,188 | $1,377 |
| $113 | $619 | $809 | $998 | $1,188 | $1,377 | $1,566 |
| $118 | $809 | $998 | $1,188 | $1,377 | $1,566 | $1,756 |
| $123 | $998 | $1,188 | $1,377 | $1,566 | $1,756 | $1,945 |
Cleveland-Cliffs Inc. | Northshore Property, SLR Project No: 138.02467.00001
Technical Report Summary - February 7, 2022 159
20.0ADJACENT PROPERTIES
There are several iron ore mines along the Mesabi Iron Range in Minnesota. The Mineral Resource and Mineral Reserves stated in this TRS are contained entirely within NSM’s mineral leases, and information from other operations was not used in this TRS.
Cleveland-Cliffs Inc. | Northshore Property, SLR Project No: 138.02467.00001
Technical Report Summary - February 7, 2022 160
21.0OTHER RELEVANT DATA AND INFORMATION
No additional information or explanation is necessary to make this Technical Report understandable and not misleading.
Cleveland-Cliffs Inc. | Northshore Property, SLR Project No: 138.02467.00001
Technical Report Summary - February 7, 2022 161
22.0INTERPRETATION AND CONCLUSIONS
Northshore has successfully produced iron pellets for over 69 years. The update to the Mineral Resource and Mineral Reserve does not materially change any of the assumptions from previous operations. An economic analysis was performed using the estimates presented in this TRS and confirms that the outcome is a positive cash flow that supports the statement of Mineral Reserves for a 48 year mine life.
SLR offers the following conclusions by area.
22.1Geology and Mineral Resources
•Above a crude MagFe cut-off grade of 15%, Northshore Measured and Indicated Mineral Resources exclusive of Mineral Reserves are estimated to total 1,158 MLT at an average grade of 22.2% MagFe.
•Exploration sampling, preparation, and analyses are appropriate for the style of mineralization and are sufficient to support the estimation of Mineral Resources.
•Work towards a comprehensive QA/QC program at Northshore is progressing well, and sample and data security are consistent with industry best practice.
•Results as compiled by Cliffs’ personnel and reviewed by the QP indicate an acceptable level of accuracy and a good level of repeatability for economic variables at Northshore. The range of acceptability for MagFe (24.6% to 32.2% MagFe), as well as other variables in standard NSMCOS_Block 21 is quite high and based on more recent results higher precision is achievable.
•Coarse duplicate values for crude MagFe by Satmagan are generally acceptable. Based on observations from the neighboring UTAC mine, improvements are possible and warranted to reduce variation and improve analytical precision in future drill core analyses.
•The turnaround time for exploration drilling samples at the Silver Bay laboratory is very long, sometimes exceeding twelve months.
•The geological model is fit for purpose and captures the principal geological features of the Biwabik IF at Northshore. The methodology used to prepare the block model is appropriate, and validations compiled by the QP indicate that the block model is reflecting the underlying support data.
•The classification at Northshore is generally acceptable, but some post-processing to remove isolated blocks of different classification is warranted.
•In both 2019 and 2020, actual versus model-predicted values of crude ore, pellet production, and process recovery were accurate to -0.09% to 4.43%.
22.2Mining and Mineral Reserves
•Northshore has been in production since 1952, and specifically under 100% Cliffs operating management since 1994. Cliffs conducts its own Mineral Reserve estimations.
•Total Proven and Probable Mineral Reserves are estimated at 822.4 MLT of crude ore at an average grade of 24.6% MagFe.
•Mineral Reserve estimation practices follow industry standards.
•The Mineral Reserve estimate indicates a sustainable project over a 48 year LOM.
Cleveland-Cliffs Inc. | Northshore Property, SLR Project No: 138.02467.00001
Technical Report Summary - February 7, 2022 162
•The geotechnical design parameters used for pit design are reasonable and supported by previous operations.
•The LOM production schedule is reasonable and incorporates large mining areas and open benches.
•An appropriate mining equipment fleet, maintenance facilities, and manpower are in place, with additions and replacements estimated, to meet the LOM production schedule requirements.
•Sufficient storage capacity for waste stockpiles and tailings has been identified to support the production of the Mineral Reserve.
22.3Mineral Processing
•The E.W. Davis Works in Silver Bay has been in production since the 1950s, so metallurgical sampling and testing is primarily used in support of plant operations and product quality control. A laboratory is located inside the concentrator building where samples from the Mine and Plant are analyzed. The laboratory is ISO-certified to iron industry standard procedures.
•In 2019, Northshore completed an upgrade at the Silver Bay Plant that allows for the production of lower silica iron pellets that will be used internally or sold to customers for the production of DRI products such as HBI.
•Crude ore is magnetite taconite with a ROM MagFe grade of approximately 25%. The concentrator averages 87.8% MagFe recovery into a concentrate derived from 32.9 weight % of the original crude ore feed.
•Historical concentrate production ranged from 3.1 MLT/y dry to 5.5 MLT/y dry, with a 12-year average of 4.45 MLT/y dry.
•Concentrate is supplied to the pellet plant to produce pellets, which are sold as the main final product. Historical pellet production ranged from 3.1 MLT/y dry to 5.6 MLT/y dry, with a 12-year average of 4.54 MLT/yr dry.
•The operations are consistently run and well maintained.
22.4Infrastructure
•The Northshore facilities are in a historically important, iron-producing region of Northeastern Minnesota. All the infrastructure necessary to mine and process significant commercial quantities of iron ore is in place.
•NSM operates a TSF, which encompasses approximately 2,500 acres located approximately seven miles by rail northwest of the Plant, referred to as the Milepost 7 Tailings Basin.
22.5Environment
•NSM indicated that it maintains the requisite state and federal permits and is in compliance with all permits. Various permitting applications have been submitted to authorities and are pending authorization. Environmental liabilities and permitting are further discussed in Section 17.
Cleveland-Cliffs Inc. | Northshore Property, SLR Project No: 138.02467.00001
Technical Report Summary - February 7, 2022 163
23.0RECOMMENDATIONS
23.1Geology and Mineral Resources
1.Continue to develop the QA/QC program to ensure that the program includes clearly defined limits when action or follow up is required, and that results are reviewed and documented in a report including conclusions and recommendations regularly and in a timely manner. Continue to work with the Silver Bay laboratory to improve analytical precision. Support primary laboratory results with a check assay program through a secondary laboratory.
2.Improve the turnaround time for exploration drilling samples at the Silver Bay laboratory.
3.Modify the interpolation strategy to see whether local block to composite conformance can be improved.
4.In future updates, use local drill hole spacing instead of a distance-to-drill hole criterion for block classification.
5.Prepare model reconciliation over quarterly periods and document methodology, results, and conclusions and recommendations.
23.2Infrastructure
1.Prioritize the completion of an OMS Manual for the TSF with the EOR in accordance with MAC guidelines and other industry recognized, standard guidance for tailings facilities.
2.Document, prioritize, track, and close out in a timely manner the remediation, or resolution, of items of concern noted in TSF audits or inspection reports.
3.Establish an EPRT with experience in tailings management facilities similar to other Cliffs properties.
Cleveland-Cliffs Inc. | Northshore Property, SLR Project No: 138.02467.00001
Technical Report Summary - February 7, 2022 164
24.0REFERENCES
AACE International, 2012, Cost Estimate Classification System – As applied in the Mining and Mineral Processing Industries, AACE International Recommended Practice No. 47R-11, 17 p.
Arcadis, 2020, 2020 Asset Retirement Obligation Summary, Northshore Mining, December 2020.
AECOMM, 2012, Impoundment Audit Report Northshore Tailings Basin Silver Bay, MN. December, 2012
Barr Engineering Co., 2013, Dam 1 Stability Evaluation, Dam crest elevation 1,245 feet, Prepared for Northshore Mining Company, Silver Bay, Minnesota, September 2013.
Barr Engineering Co., 2016, Dam 2 Stability Evaluation, Dam crest elevation 1,248 feet, Prepared for Northshore Mining Company, Silver Bay, Minnesota, June 2016.
Barr Engineering Co., 2019, Five-Year Operations Plan, Years 2019-2023, Milepost 7 Tailings Basin, Prepared for Northshore Mining Company, Silver Bay, Minnesota, January 2019
Barr Engineering, 2019, NSM SEC Tailings Info Memo.
Barr Engineering Co., 2020a, Dam 5 Stability Evaluation, Dam crest elevation 1,265 feet, Prepared for Northshore Mining Company, Silver Bay, Minnesota, January 2020.
Barr Engineering Co., 2020b, Milepost 7 Tailings Basin, Dam Safety Inspection Report, Fall 2020, Prepared for Northshore Mining Company, December 2020.
Bieniawski Z. T., 1989, Engineering Rock Mass Classifications, John Wiley & Sons, New York
Eames, H.H., 1866, On the metalliferous regions bordering on Lake Superior: St. Paul, Minn., Report of the State Geologist of Minnesota, 23 p.
Golder, 2007, Tailings Basin Audit Report Northshore Mining Company, Silver Bay, Minnesota. January 2008.
Golder, 2019a, Report - Overburden and waste rock stockpile stability rating and hazard classification for Northshore Mine (REV. A): April 3, 2019 report to D. Korri and C. McCue prepared by Shaigetz, M.L., and Cunning, J., of Golder Associates, Montréal, QC, Canada, 24 p.
Golder, 2019b, Waste dump and stockpile stability rating and hazard classification for Northshore Mine (Rev. A), prepared by J. Obermeyer, April 3, 2019, 76 p.
Guilbert, J.M., and Park, C.F., 1986, The Geology of Ore Deposits: W. H. Freeman and Company, New York. 985 p.
Gundersen, J.N., and Schwartz, G.M., 1962, The geology of the metamorphosed Biwabik Iron-Formation, Eastern Mesabi District, Minnesota: The University of Minnesota Press, Minnesota Geological Survey Bulletin, Volume 43. Pg. 15.
Cleveland-Cliffs Inc. | Northshore Property, SLR Project No: 138.02467.00001
Technical Report Summary - February 7, 2022 165
Hawley, M., and Cunning, J. (eds.), 2017, Guidelines for mine waste dump and stockpile design, CSIRO Publishing, Melbourne, Australia, 370 p.
Hoek E, Wood D & Sha S, 1992, A modified Hoek-Brown criterion for jointed rock masses. Rock Characterization. Proceedings of the ISRM Symposium EUROCK’92 (ed. J Hudson), Chester, UK, pp 209-213. British Geotechnical Society, London.
James H. L., 1954, Sedimentary facies of iron formation, Economic Geology, Volume 49, pp. 235-293.
James H. L., 1966, Chemistry of the iron-rich sedimentary rocks, In: Fleischer M. (ed.), ‘Data of Geochemistry’, 6th edition, Paper 440-W: U.S. Govt. Printing Office, Washington D.C.
Jirsa, M.A., Chandler, V.W., and Lively, R.S., 2005, Bedrock geology of the Mesabi Iron Range, Minnesota: St. Paul, Minnesota Geological Survey Miscellaneous Map Series M-163.
Lerch Brothers Inc. Standard Procedure LLP-60-02, Stage 1 Crushing - Drill Core.
Lerch Brothers Inc. Standard Procedure LLP-60-03, Stage 2 Crushing - Drill Core.
Lerch Brothers Inc. Standard Procedure LLP-60-04, Stage 3 Crushing - Drill Core.
Lerch Brothers Inc. Standard Procedure LLP-60-05, Splitting Samples - Drill Core.
Miller, James D., Jr., Green, J.C., Severson, M.J., Chandler, V.W., Peterson, D.M., 2001, M-119 Geologic map of the Duluth Complex and related rocks, Northeastern Minnesota: Minnesota Geological Survey. Retrieved from the University of Minnesota Digital Conservancy, http://hdl.handle.net/11299/183.
Minnesota Department of Natural Resources (MDNR), 2011, The Minnesota Department of Natural Resources Website Accessed 10/2011 at https://www.dnr.state.mn.us
Morey, G. B., 1999, High-grade iron ore deposits of the Mesabi Range, Minnesota - Product of a continental-scale Proterozoic ground-water flow system, Economic Geology, Volume 94, pp. 133-142.
NOAA, 2021, Hibbing Chisholm Station. Retrieved from NOAA: https://www.ncei.noaa.gov/access/services/data/v1?dataset=normals-monthly-1991-2020&startDate=0001-01-01&endDate=9996-12-31&stations=USW00094931&format=pdf
NSM SOP, Silica Calcium and Trace Metals Determination QCSW 1-01: NSM Sharepoint.
NSM SOP, Davis Tube Procedure QCSW 5-04: NSM SharePoint.
NSM SOP, Drill Core Magnetic Iron Determination, QCSW 5-01: NSM SharePoint.
NSM SOP, Grindability Index Determination, QCSW 5-03: NSM SharePoint.
Cleveland-Cliffs Inc. | Northshore Property, SLR Project No: 138.02467.00001
Technical Report Summary - February 7, 2022 166
NSM SOP, Mini Mill Grindability Index Determination, QCSW 5-06: NSM SharePoint.
NSM SOP, Concentratability Determination Drill Core QCSW 5-02: NSM SharePoint.
NSM SOP, Gas Pycnometer Density Determination, QCSW 5-07: NSM SharePoint.
Ojakangas, R.W., 1994, Sedimentology and provenance of the Early Proterozoic Michigamme Formation and the Goodrich Quartzite, Northern Michigan: Regional stratigraphic implications and suggested correlations: U.S. Geological Survey Bulletin 1904, 31 p.
Ojakangas, R.W., Severson, M.J., Campbell, T.J., Lubben, J.D., Jongewaard, P.K., Halverson, D.G., Bird, J., and Everett, W., 2009, Field Trip 5: Geology and metamorphism of the eastern Mesabi Iron Range, in Peterson, D.M., ed., Proceedings Volume 55, Part 2 - Field Trip Guidebook: Institute on Lake Superior Geology, 55th annual meeting, pp. 116-155.
Orobona, M., 2020, Internal Memo: Exploration Quality Assurance/Quality Control campaign report, 2017-2019, Northshore.
Perry, E.C., Jr., Tan, F.C., Morey G.B., 1973, Geology and stable isotope geochemistry of the Biwabik Iron Formation, Northern Minnesota: Economic Geology, Volume 68, pp. 1110-1125.
SRK, 2019, Northshore geotechnical pit slope review: September 6, 2019 memo to M. Young prepared by Poeck, E. of SRK Consulting, Denver, CO, 59 p.
S&P Global Platts (https://www.spglobal.com/platts/en/market-insights/latest-news/metals/031821-open-market-scrap-demand-in-us-could-grow-by-almost-9-million-mt-through-2023), Analysis: Open market scrap demand in US could grow by almost 9 million mt through 2023, news release, March 18, 2021.
Severson, M.J., Heine, J.J., and Patelke, M.M., 2009, Geologic and stratigraphic controls of the Biwabik Iron Formation and the aggregate potential of the Mesabi Iron Range, Minnesota: NRRI Technical Report Number 2009-09, 173 p.
Simonson, B.M., and Hassler, S.W., 1996, Was the deposition of large Precambrian iron formations linked to major marine transgression? Journal of Geology, Volume 104, pp 665–676.
US Securities and Exchange Commission, 2018: Regulation S-K, Subpart 229.1300, Item 1300 Disclosure by Registrants Engaged in Mining Operations and Item 601 (b)(96) Technical Report Summary.
Winchell, N.H., 1883, The geological and natural history survey of Minnesota. The eleventh annual report for the year 1882: Minnesota Geological Survey. Retrieved from the University of Minnesota Digital Conservancy, http://hdl.handle.net/11299/56242.
Cleveland-Cliffs Inc. | Northshore Property, SLR Project No: 138.02467.00001
Technical Report Summary - February 7, 2022 167
25.0RELIANCE ON INFORMATION PROVIDED BY THE REGISTRANT
This report has been prepared by SLR for Cliffs. The information, conclusions, opinions, and estimates contained herein are based on:
•Information available to SLR at the time of preparation of this report,
•Assumptions, conditions, and qualifications as set forth in this report, and
•Data, reports, and other information supplied by Cliffs and other third party sources.
For the purpose of this report, SLR has relied on ownership information provided by Cliffs and verified in an email from Gabriel D. Johnson, Cliffs' Senior Manager – Land Administration dated January 20, 2022. SLR has not researched property title or mineral rights for Northshore as we consider it reasonable to rely on Cliffs’ Land Administration personnel who are responsible for maintaining this information.
SLR has relied on Cliffs for guidance on applicable taxes, royalties, and other government levies or interests, applicable to revenue or income from the Northshore Property in the Executive Summary and Section 19.0. As the Northshore Property has been in operation for over 70 years, Cliffs has considerable experience in this area.
SLR has relied on information provided by Cliffs pertaining to environmental studies, management plans, permits, compliance documentation, and monitoring reports that were verified in an email from Scott A. Gischia, Cliffs' Director – Environmental Compliance, Mining and Pelletizing, dated January 21, 2022.
The Qualified Persons have taken all appropriate steps, in their professional opinion, to ensure that the above information from Cliffs is sound.
Except for the purposes legislated under applicable securities laws, any use of this report by any third party is at that party’s sole risk.
Cleveland-Cliffs Inc. | Northshore Property, SLR Project No: 138.02467.00001
Technical Report Summary - February 7, 2022 168
26.0DATE AND SIGNATURE PAGE
This report titled “Technical Report Summary on the Northshore Property, Minnesota, USA” with an effective date of December 31, 2021 was prepared and signed by:
Signed SLR International Corporation
Dated at Lakewood, CO
February 7, 2022 SLR International Corporation
Cleveland-Cliffs Inc. | Northshore Property, SLR Project No: 138.02467.00001
Technical Report Summary - February 7, 2022 169